
Digital Finance Analytics (DFA) has released the April 2018 mortgage stress and default analysis update.
Across Australia, more than 963,000 households are estimated to be now in mortgage stress (last month 956,000). This equates to 30.1% of owner occupied borrowing households. In addition, more than 21,600 of these are in severe stress, up 500 from last month. We estimate that more than 55,600 households risk 30-day default in the next 12 months. We expect bank portfolio losses to be around 2.8 basis points, though losses in WA are higher at 5 basis points. We continue to see the impact of flat wages growth, rising living costs and higher real mortgage rates.
 Martin North, Principal of Digital Finance Analytics says “overall, risks in the system continue to rise, and while recent strengthening of lending standards will help protect new borrowers, there are many households currently holding loans which would not now be approved. The recent Royal Commission laid bare some of the industry practices which help to explain why stress is so high. This is a significant sleeping problem and the risks in the system remain higher than many recognise”.
News On the Finance Sector Is Set to Get Worse.
Australia is horrified by what they are learning from the Royal Commission; yet this is only the beginning. News on the finance sector is set to get much worse.
Gill North, a Professor of law at Deakin University and Principal at DFA, suggests “the issues highlighted by the RC represent only the tip of the iceberg and Australia is in for a bumpy and uncomfortable ride”. The systemic risks across the financial sector and economy are now much higher than most participants realise, and these risks are exacerbated by the concentration of the finance sector and its many interconnections, the laxity of the lending standards over the last decade, the high levels of household debt (and the distribution of this debt), and the heavy reliance of the Australian economy on the health of the residential property market.
At some point down the road, the true resilience of the financial institutions, their consumers, and the broader economy will be tested and put under extreme pressure. And when this occurs, the high levels of household debt and financial stress, and the large disparities between the population segments that have considerable income, savings and wealth buffers, and those who have no such buffers, will become starker. “When the next housing or financial crisis hits (and the question is when and not if), the ensuing impact on the finance sector, many Australian households, and the broader economy will be severe. Yet most, if not all, of the financial institutions, the regulators, policy makers, and consumers still remain largely oblivious to what lies ahead.”
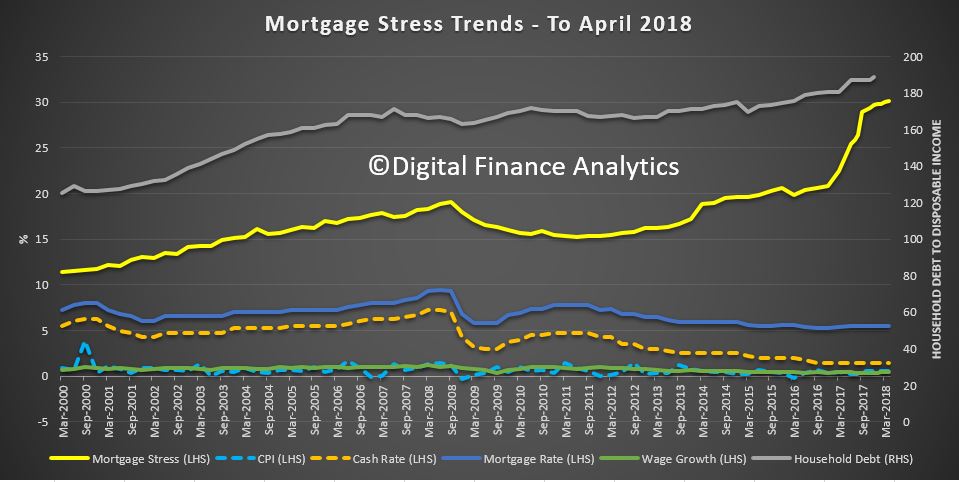
Martin North says: “We continue to see the number of households rising, and the quantum is now economically significant. Things will get more severe, especially as household debt continues to climb to new record levels. Mortgage lending is still growing at two to three times income. This is not sustainable and we are expecting lending growth to continue to moderate in the months ahead as underwriting standards are tightened and home prices fall further”. The latest household debt to income ratio is now at a record 188.6.[1]
Our analysis uses the DFA core market model which combines information from our 52,000 household surveys, public data from the RBA, ABS and APRA; and private data from lenders and aggregators. The data is current to end April 2018. We analyse household cash flow based on real incomes, outgoings and mortgage repayments, rather than using an arbitrary 30% of income.

Households are defined as “stressed” when net income (or cash flow) does not cover ongoing costs. They may or may not have access to other available assets, and some have paid ahead, but households in mild stress have little leeway in their cash flows, whereas those in severe stress are unable to meet repayments from current income. In both cases, households manage this deficit by cutting back on spending, putting more on credit cards and seeking to refinance, restructure or sell their home. Those in severe stress are more likely to be seeking hardship assistance and are often forced to sell.
The forces which are lifting mortgage stress levels remain largely the same. In cash flow terms, we see households having to cope with rising living costs – notably child care, school fees and fuel – whilst real incomes continue to fall and underemployment remains high. Households have larger mortgages, thanks to the strong rise in home prices, especially in the main eastern state centres, and now prices are slipping. While mortgage interest rates remain quite low for owner occupied borrowers, those with interest only loans or investment loans have seen significant rises. We expect some upward pressure on real mortgage rates in coming months as international funding pressures mount, a potential for local rate rises and margin pressure on the banks thanks to a higher Bank Bill Swap Rate (BBSW).
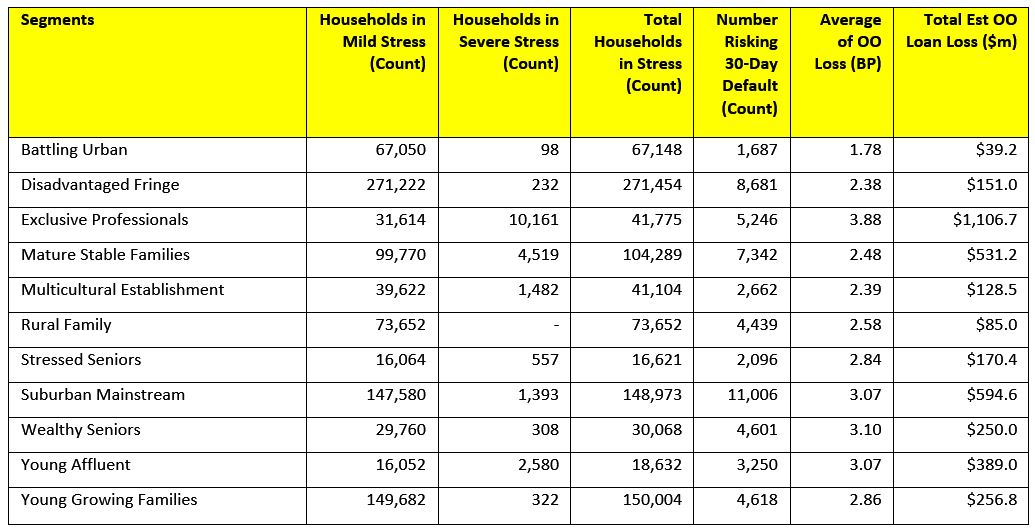
Probability of default extends our mortgage stress analysis by overlaying economic indicators such as employment, future wage growth and cpi changes. Our Core Market Model also examines the potential of portfolio risk of loss in basis point and value terms. Losses are likely to be higher among more affluent households, contrary to the popular belief that affluent households are well protected.
 Stress by The Numbers.
Regional analysis shows that NSW has 262,577 households in stress (261,159 last month), VIC 256,353 (258,303 last month), QLD 175,960 (176,154 last month) and WA has 128,600 (126,606 last month). The probability of default over the next 12 months rose, with around 10,513 in WA, around 10,316 in QLD, 13,830 in VIC and 14,798 in NSW.
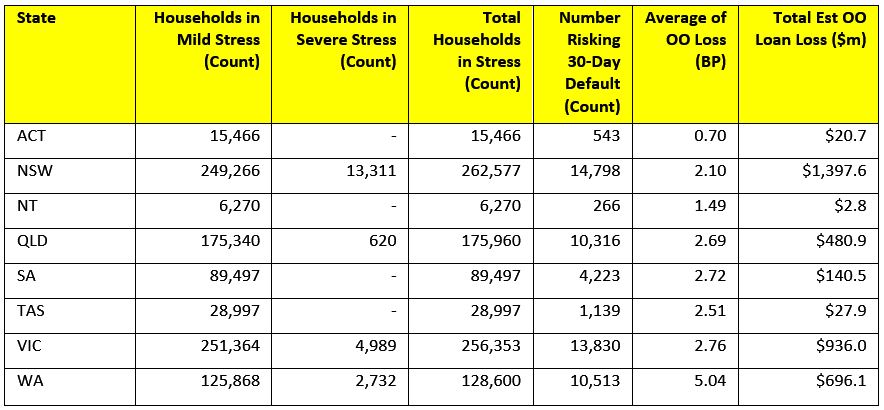 The largest financial losses relating to bank write-offs reside in NSW ($1.4 billion) from Owner Occupied borrowers) and VIC ($936 million) from Owner Occupied Borrowers, which equates to 2.10 and 2.76 basis points respectively. Losses are likely to be highest in WA at 5 basis points, which equates to $696 million from Owner Occupied borrowers. A fuller regional breakdown is set out below.
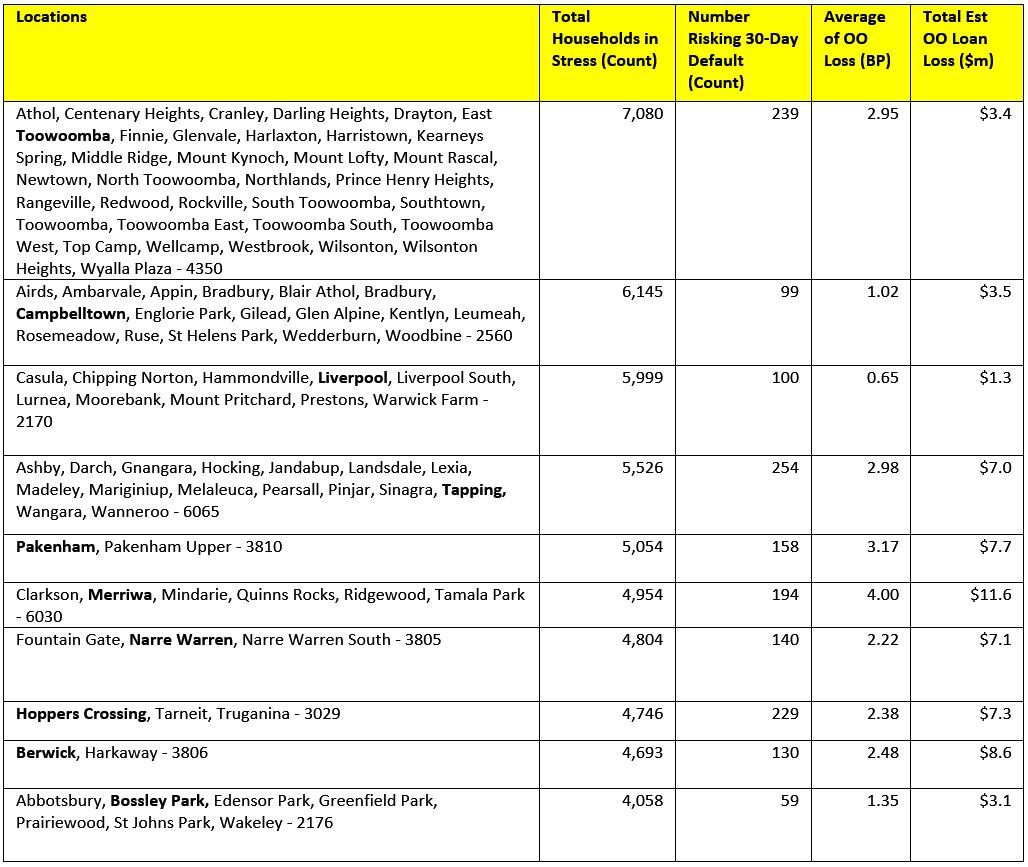
 Here are the top post codes sorted by the highest number of households in mortgage stress.
 [1] RBA E2 Household Finances – Selected Ratios December 2017 (Revised 3rd April 2018).
You can request our media release. Note this will NOT automatically send you our research updates, for that register here.
[contact-form to=’mnorth@digitalfinanceanalytics.com’ subject=’Request The April 2018 Stress Release’][contact-field label=’Name’ type=’name’ required=’1’/][contact-field label=’Email’ type=’email’ required=’1’/][contact-field label=’Email Me The April 2018 Media Release’ type=’radio’ required=’1′ options=’Yes Please’/][contact-field label=”Comment If You Like” type=”textarea”/][/contact-form]
Note that the detailed results from our surveys and analysis are made available to our paying clients.