
The 15th edition of the annual Demographia Internal Housing Affordability Survey has been released. Once again it shows that Australia and New Zealand property is unaffordable. Globally there were 26 severely unaffordable major housing markets in 2018. As normal they argue for planning reforms to release land, but do not consider credit availability, the strongest lever to affordability!
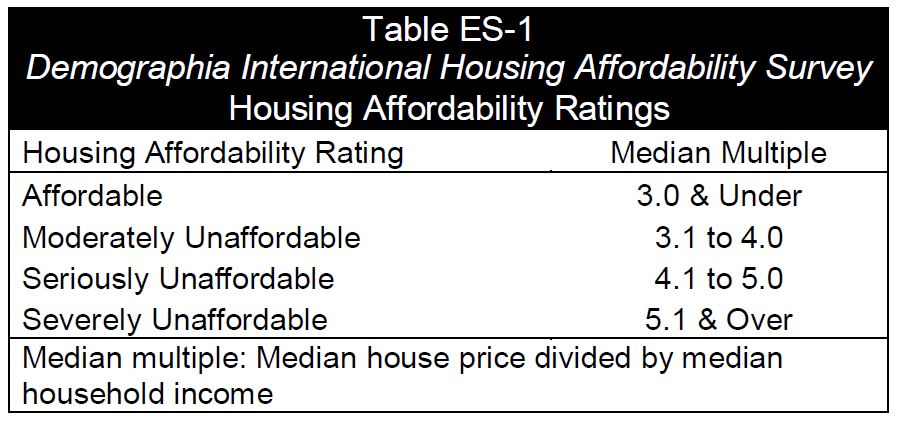
The Demographia International Housing Affordability Survey rates housing affordability using the “Median Multiple”, average house price divided by average household income or Price- Income Ratio (PIR). In the 2019 Affordability Survey covering 90 cities of more than one million people, PIR values range from 2.6 in Pittsburgh, PA and Rochester, NY to 20.9 in Hong Kong!
Available data shows that house costs have generally risen at a rate similar to that of household incomes until comparatively recently. This is consistent with cost trends among other basic necessities, such as personal transport, food and clothing. In some metropolitan markets house prices have doubled, tripled or even quadrupled relative to household incomes.
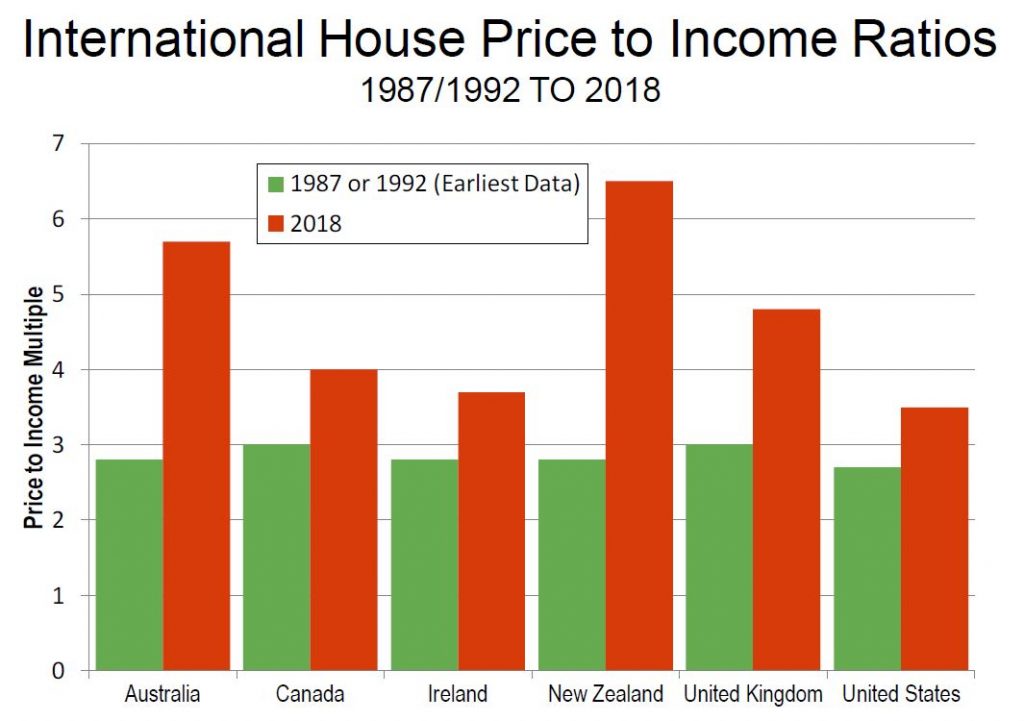
Historically, the Median Multiple has been remarkably similar among six surveyed nations, with median house prices from 2.0 to 3.0 times median household incomes (Australia, Canada, Ireland, New Zealand, the United
Kingdom and the United States). Housing affordability remained generally within this range until the late 1980s or late 1990s in each of these nations.
In recent decades, house prices have escalated far above household incomes in many parts of the world. [This coincides with the deregulation of the financial markets, and more recently QE and ultra low interest rates]
The report says that many prosperous cities consider ever increasing housing prices as an unavoidable side-effect of their economic success. But the Survey conducted by Wendell Cox and Hugh Pavletich demonstrates that some cities can be economically successful and avoid over-charging households for their housing consumption. Australia is not among them, so
why do some cities manage to conciliate economic growth and housing affordability while others see their PIR number increases years after years?
The severely unaffordable major markets include all in Australia (5), New Zealand (1) and China (1). Two of Canada’s six markets are severely unaffordable. Seven of the 21 major markets in the United Kingdom, and 13
of the 55 major markets in the United States are severely unaffordable.
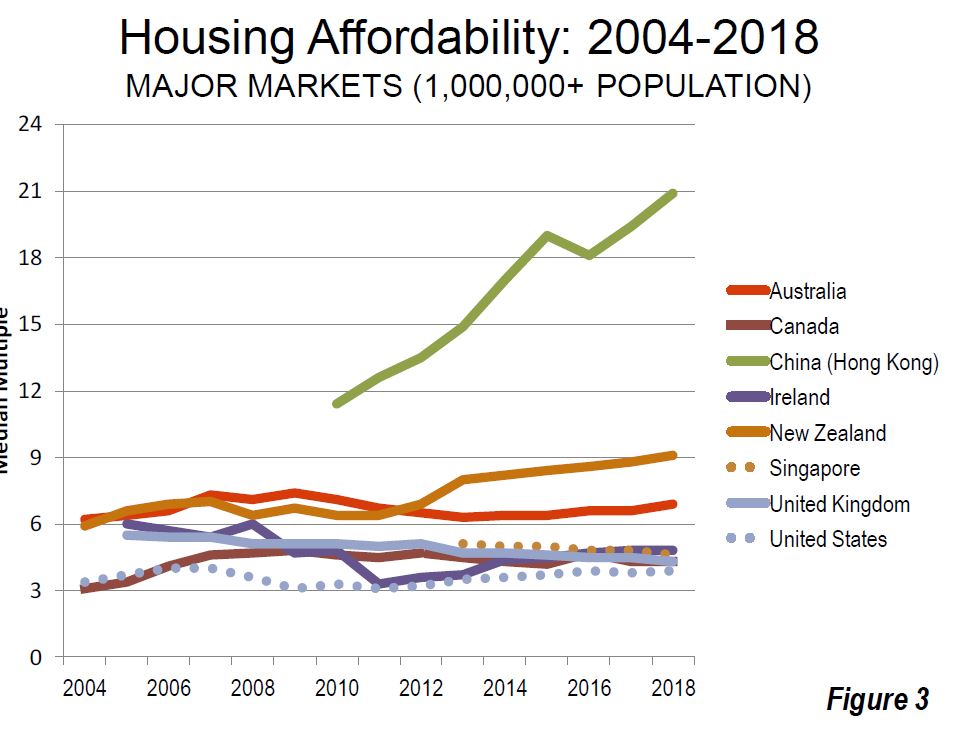
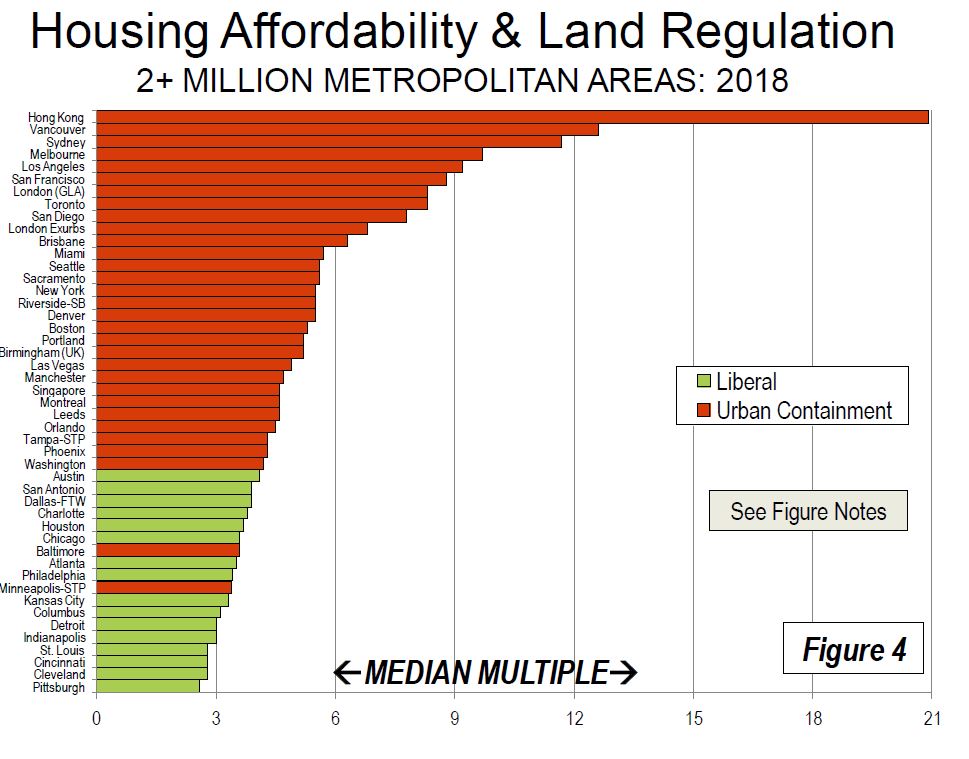
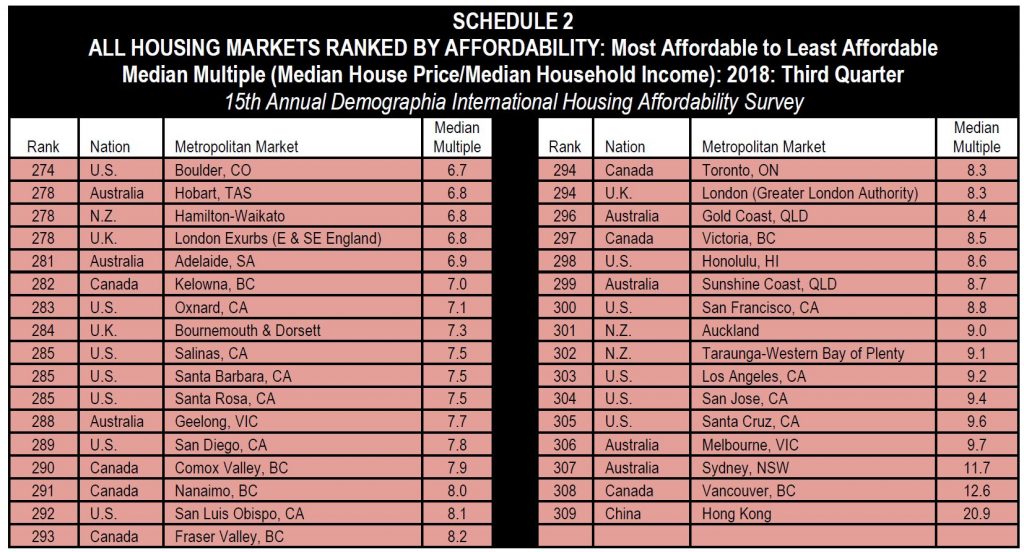
There are 26 severely unaffordable major housing markets in 2018. Again, Hong Kong is the least affordable, with a Median Multiple of 20.9 up from 19.4 last year. Vancouver has replaced Sydney as the second least affordable, with a Median Multiple of 12.6. With slightly declining house prices, Sydney’s Median Multiple dropped to 11.7. Melbourne (9.7), San Jose (9.4), Los Angeles (9.2) and Auckland (9.0) were also among the least affordable. San Francisco (8.8), Honolulu (8.6), as well as London (Greater London Authority) and Toronto (both 8.3) were also among the 10 least affordable major markets.
An already high or increasing Price-Income Ratio (PIR) should immediately signal to urban managers that they should take urgent correcting action after conducting a detailed diagnosis that would explain the high PIR figure. The Affordability Survey should be similar to the periodic health check-up taken by an individual: an abnormally high blood pressure indicates that urgent correcting steps should be taken.
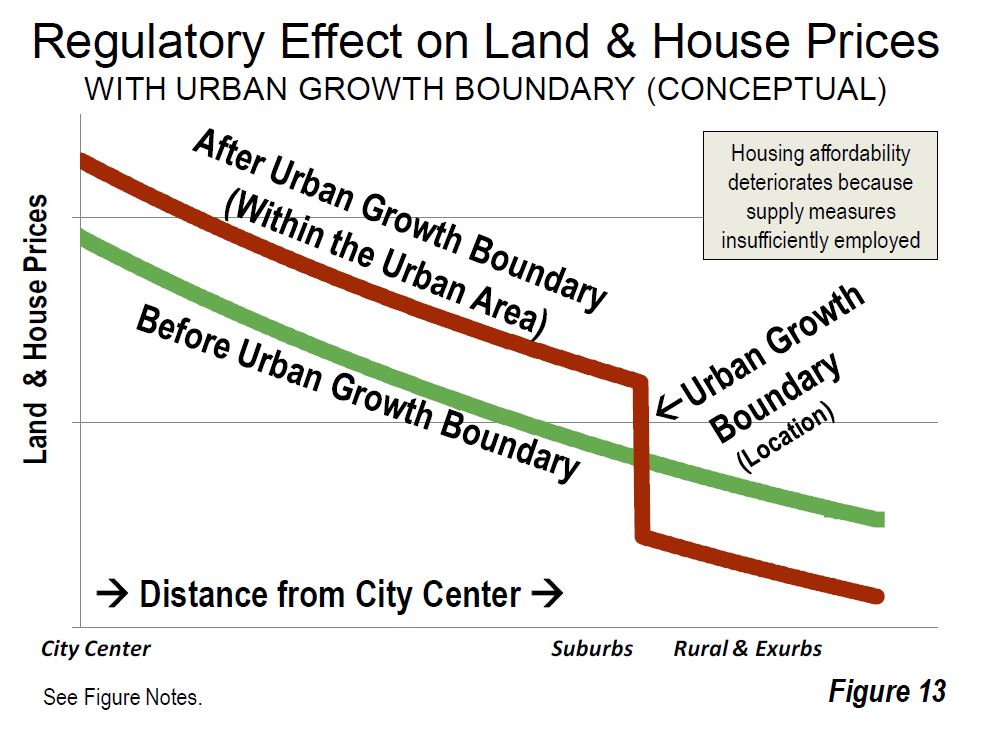
Virtually all of the severely unaffordable major markets have urban containment.
Among the 79 severely unaffordable markets, 28 are in the United States, 17 in Canada, 16 in Australia, 11, six in New Zealand and one in China. Among the 10 least affordable housing markets, seven are major housing markets. s
least affordable 10 also includes California’s Santa Cruz, at 9.6 and Tauranga-Western Bay of Plenty in New Zealand, at 9.1. All of the other least affordable metropolitan areas were major markets.
In Australia, housing affordability remains severely unaffordable in all of the major markets, and by a substantial margin in Sydney and Melbourne. Despite what has been called the largest Sydney price reduction in 35 years, house prices relative to incomes are more than double the rate of the early
1980s. In Sydney and Melbourne, median income households need at least three years’ more income to pay for the median priced house than in 2004, when the first Survey was published.
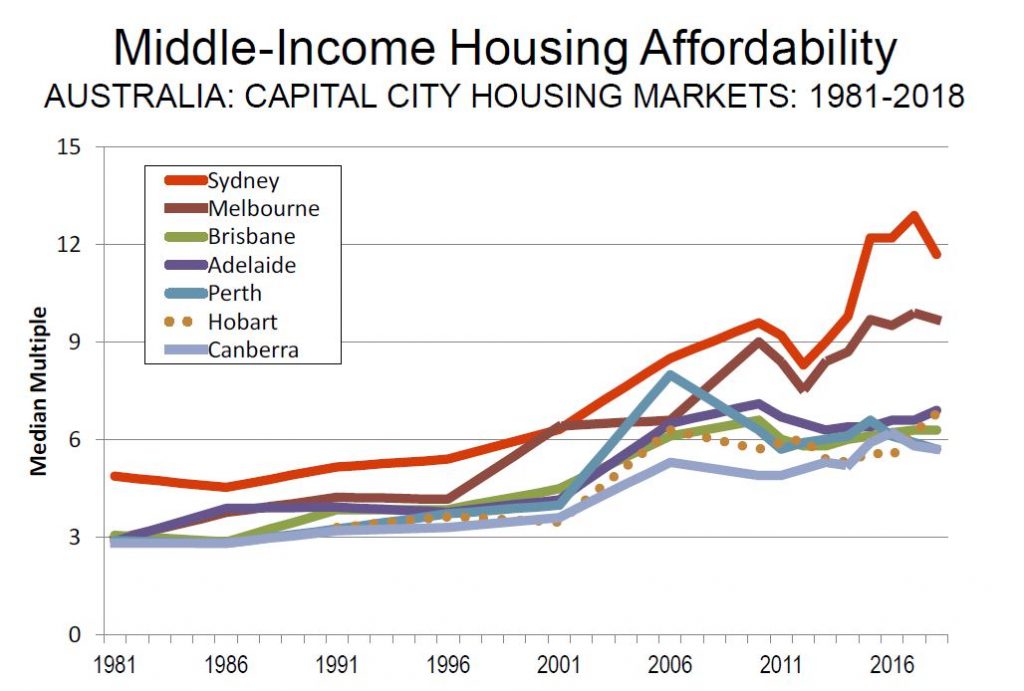
Major Markets: Sydney is again Australia’s least affordable market, with a Median Multiple of 11.7, and ranks third worst overall, trailing Hong Kong.
Melbourne has a Median Multiple of 9.7 and is the fourth least affordable major housing market internationally. Only Hong Kong, Vancouver, and Sydney are less affordable than Melbourne. Adelaide has a severely unaffordable 6.9 Median Multiple and is the 16th least affordable of the 91
major markets. Brisbane has a Median Multiple is 6.3 and is ranked 18th least affordable, while Perth, with a Median Multiple of 5.7 is the 24th least affordable major housing market in this year’s Survey.
Other Housing Markets: Overall, Australia’s housing markets have a severely unaffordable Median Multiple of 5.9. The most affordable markets are moderately affordable, Gladstone, Queensland at 3.2 and Rockhampton, Queensland at 3.9. There are no affordable or moderately affordable markets in Australia. Overall 16 markets in Australia are rated severely unaffordable. The least affordable are the Sunshine Coast, Queensland (8.7) and the Gold Coast, Queensland (8.4).
Historical Context: Australia’s generally unfavorable housing affordability is in significant contrast to the broad affordability that existed before implementation of urban containment (called “urban consolidation” in Australia). The price-to-income ratio in Australia was below 3.0 in the late 1980s. All of Australia’s major markets have urban containment policy and all have severely unaffordable housing.
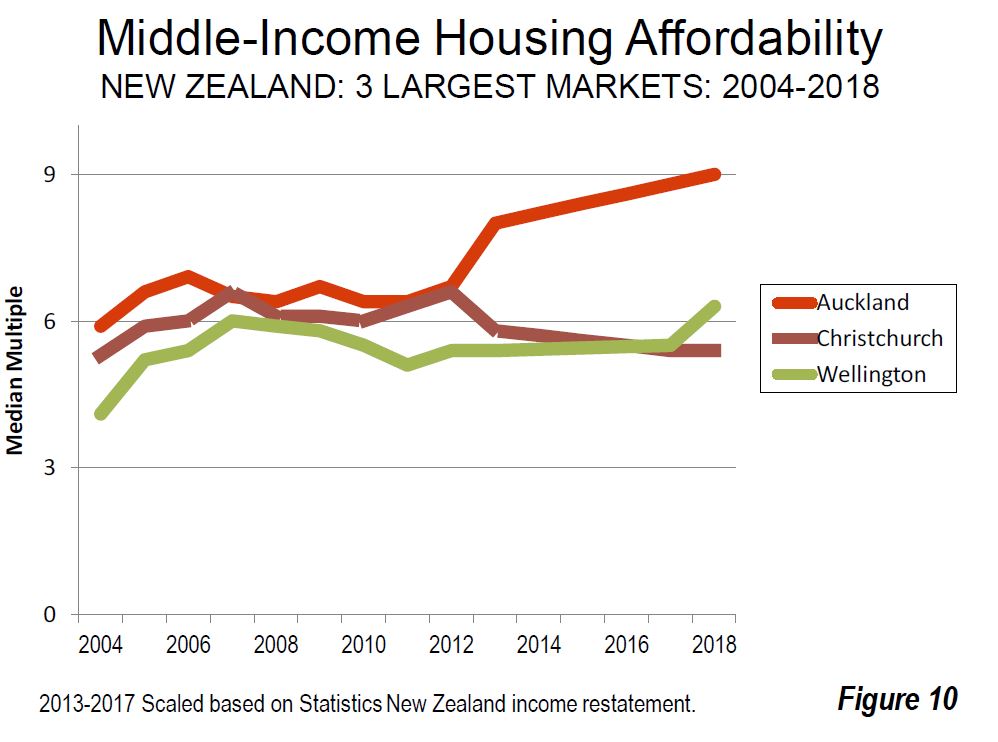
New Zealand’s housing affordability has a severely unaffordable Median Multiple of 6.5. Recent Median Multiple trends have been influenced by government restatement of median income data.
Major Housing Market: Auckland, New Zealand’s only major housing market has a severely unaffordable 9.0 Median Multiple. Housing affordability has deteriorated from a Median Multiple of 5.9 in the first Survey (2004), thus adding the equivalent of three years in pre-tax median household income to the house prices. Over the past year, Auckland’s house prices have been stable, with the Median Multiple increase resulting from the household income restatement described above. Auckland is the seventh least affordable among the 91 major housing markets, and has been severely unaffordable in all 15 Demographia International Housing Affordability Surveys.
Other Housing Markets: There is severely unaffordable housing in the two largest markets outside Auckland. Christchurch has a Median Multiple of 5.4, while Wellington is at 6.3.
Housing Affordability and Public Policy: Outside Singapore, New Zealand is the only nation in the Survey that emphasizing public policy priority to restore and maintain middle-income housing affordability. In New Zealand, as in Australia, housing had been affordable until approximately a quarter century ago. However, urban containment policies were adopted across the country, and consistent with the international experience, housing became severely unaffordable in all three of New Zealand’s largest
housing markets, Auckland, Christchurch and Wellington.
Meanwhile, public opinion placed the issue of housing affordability to the top of the policy agenda in the last three national elections. That concern continues to be dominant according to the latest IPSOS New Zealand Issues Monitor (October 2018), with 45 percent saying that “Housing/Price of
Housing” is the issue of greatest concern. Poll respondents were asked to identify the three most important issues, and the cost of living rated third, which is to be expected given the enormous influence of housing costs on the financial health of households. The new Labour Party led coalition government unveiled a focused housing affordability program, intending to increase the housing supply throughout Auckland, including both urban fringe and infill development. The Labour Party’s Urban Growth agenda calls for intensified residential development, both greenfield and infill. The Auckland urban containment boundary is to be abolished. Recently, the
government and the city of Auckland agreed to establish a non-government debt financing mechanism to facilitate development of a 9,000 home greenfield development. The government intends to establish an Urban Development Authority, which would provide means for communities and developers to finance infrastructure for new housing development.
In his Introduction: Avoiding Dubious Urban Policies to this Survey, former World Bank principal urban planner Alain Bertaud says that “After the
government has successfully passed these reforms, the international community will watch with great interest the impact it will have on Auckland’s PIR (Median multiple) in the next few years. It is hoped that the example of Auckland will create a blueprint that could be used in other high PIR cities.”
These developments build on other recent developments, especially a Productivity Commission of New Zealand report, which found that land use authorities have a responsibility to provide “capacity to house a growing
population while delivering a choice of quality, affordable dwellings of the type demanded ….” Consistent with that finding, the Productivity Commission proposed a measure that would automatically expand the supply of greenfield land when housing affordability targets are not met. The Commission said, “Where large discontinuities emerge between the price of land that can be developed for housing and land that cannot be
developed, this is indicative of the inadequacy of development capacity being supplied within the city.” The Productivity Commission expansion of greenfield land for development where the difference between land prices on either side of an urban containment boundary become too great.
Here are the top housing markets listed by their unaffordability.
The report highlights three myths which tend to limit policy responses, namely:
Myth #1: planners know how to allocate land equitably through the design of increasingly complex zoning regulations while ignoring price signals.
Myth #2: Regulators can mandate the creations of new affordable housing units by obliging private developers to provide a share (usually 20%) of the housing units they build at prices fixed by the government below market; regulators call these “affordable housing units.”
Myth #3: The compact city fallacy. A city can accommodate increasing income and population through densification of the existing built-up area; expansion into greenfield would result in “sprawl.”
The report says that by severely restricting or even prohibiting expansion to
accommodate larger population, urban containment has virtually destroyed the competitive market for land in many urban areas, driving house prices up relative to incomes.
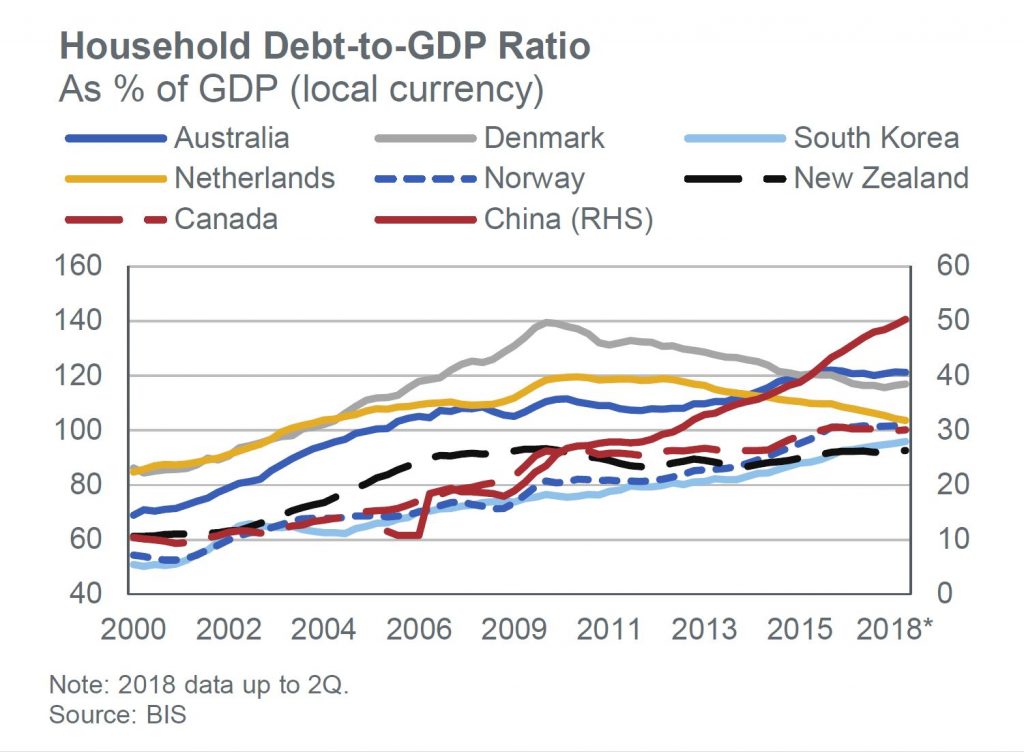
We agree that land supply is one important issue but the report is silent on the most powerful lever of home prices, credit availability. Our own research suggests that more credit leads to higher prices, and the reverse is also true. There are correlations with the household debt to GDP ratios.
In addition there is an “undersupply myth”. According to the latest census in Australia, from 2016, 11.2% of residential properties are unoccupied, which equates to 1,039,874 residences. We also saw in Joe Wilkes’ recent reports from Auckland, that supply is not an issue at this time in New Zealand.
Finally, some will criticise the index method they use in their surveys, but we think the consistently applied approach shows real trends and real issues.
In fact, the truth is housing affordability is a result of the complex interplay between supply and demand, planning and credit, and to that end the Demographia survey is a helpful tool to diagnose the issues we face. But planning changes alone will not solve the issue. The greatest of these is credit.
Well worth a read because in my view this article reflects what is beginning to happen here.
There have been “yellow vest” protests here, ignored by the MSM, but then again who watches MSM?
Out of a population of 24m only 200,ooo watch the 7 & 9 breakfast shows.
https://www.zerohedge.com/news/2019-01-21/gilets-jaunes-are-unstoppable-now-elites-are-afraid
Back in 2014, geographer Christopher Guilluy’s study of la France périphérique (peripheral France) caused a media sensation. It drew attention to the economic, cultural and political exclusion of the working classes, most of whom now live outside the major cities. It highlighted the conditions that would later give rise to the yellow-vest phenomenon.