
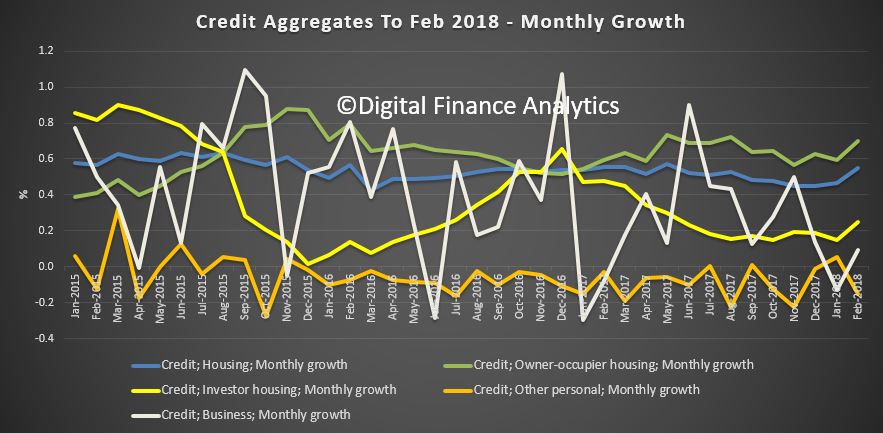
The latest Credit Aggregates from the RBA for February 2018 shows continued growth in mortgage lending, and only small rises in business credit and other consume credit. The monthly growth stats are noisy, but owner occupied lending growth is higher, and this continues to drive overall credit growth higher than business lending.
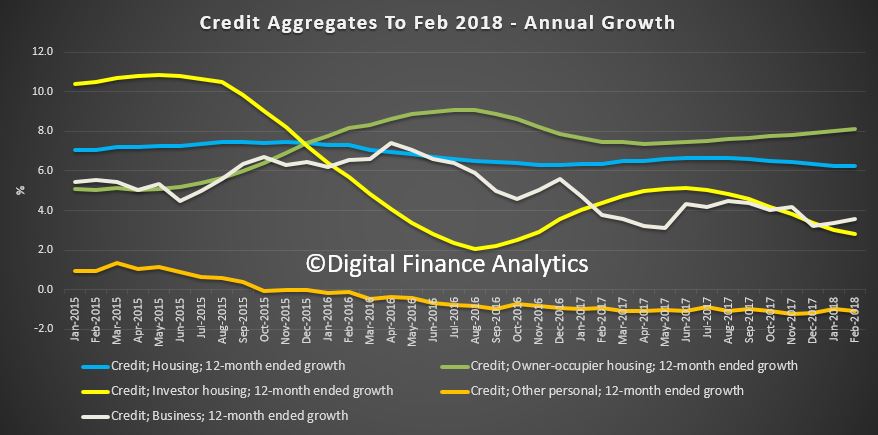
The smoothed 12 month view shows the trends more clearly, with annualised owner occupied growth registering 8.1%, up from last month, investor lending falling again down to 2.8% annualised, and business credit at 3.6%
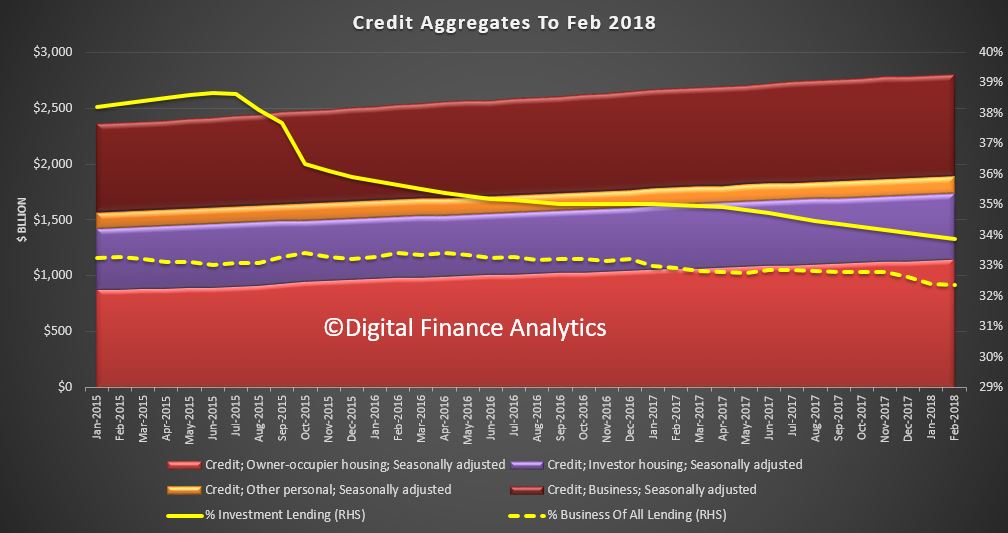
 Looking at the relative value of lending, in seasonally adjusted terms, owner occupied credit rose 0.71% to $1.15 trillion, up $8.08 billion, while investment lending rose 0.12% to $588.3 billion, up just 0.69 billion. Business lending rose 0.17% to $905 billion, up 1.55 billion and personal credit fell 0.15%, down 0.22 billion to $152.2 billion.
Note that the proportion of investment loans fell again down to 33.9%, and the proportion of business lending to all lending remained at 32.4%, and continues to fall from last year. In other words, it is owner occupied housing which is driving credit growth higher – if this reverses, there is a real risk total credit grow will run into reverse. Again, we see the regulators wishing to continue to drive credit higher, to support growth and GDP, yet also piling on more risks, when households are already terribly exposed. They keep hoping business investment and growth will kick in, but their forward projections look “courageous”. Remember it was housing consumption and Government spending on infrastructure which supported the last GDP numbers, not business investment.
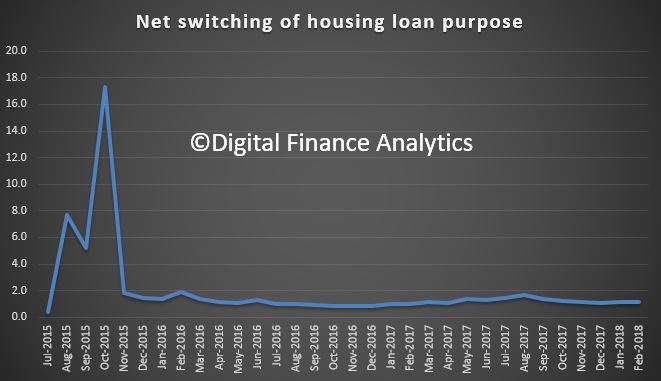
One final note, the loan switching between investor and owner occupied loans are around $1 billion each month. This of course has now been backed out of the RBA numbers.
 Now, lets compare the total housing lending from the RBA of $1.740 trillion, which includes the non-banks (though delayed, and partial data), with the APRA $1.61 trillion. The gap, ¬$130 billion shows the non bank sector is growing, as historically, the gap has been closer to $110 billion. This confirms the non-bank sector is active, filling the gap left by banks tightening. Non-banks have weaker controls on their lending, despite the new APRA supervision responsibilities. This is an emerging area of additional risk, as some non-banks are ready and willing to write interest only and non-conforming loans, supported by both new patterns of securitisation (up 13% in recent times) and substantial investment funds from a range of local and international investors and hedge funds.
Once again, we see the regulators late to the party. This continues the US 2005-6 playbook where non-conforming loans also rose prior to the crash. We are no different.