The ATM at 50: how a hole in the wall changed the world

From The Conversation.

Next time you withdraw money from a hole in the wall, consider singing a rendition of happy birthday. For on June 27, the Automated Teller Machine (or ATM) celebrates its half century. Fifty years ago, the first cash machine was put to work at the Enfield branch of Barclays Bank in London. Two days later, a Swedish device known as the Bankomat was in operation in Uppsala. And a couple of weeks after that, another one built by Chubb and Smith Industries was inaugurated in London by Westminster Bank (today part of RBS Group).

These events fired the starting gun for today’s self-service banking culture – long before the widespread acceptance of debit and credit cards. The success of the cash machine enabled people to make impromptu purchases, spend more money on weekend and evening leisure, and demand banking services when and where they wanted them. The infrastructure, systems and knowledge they spawned also enabled bankers to offer their customers point of sale terminals, and telephone and internet banking.

There was substantial media attention when these “robot cashiers” were launched. Banks promised their customers that the cash machine would liberate them from the shackles of business hours and banking at a single branch. But customers had to learn how to use – and remember – a PIN, perform a self-service transaction and trust a machine with their money.

People take these things for granted today, but when cash machines first appeared many had never before been in contact with advanced electronics.

And the system was far from perfect. Despite widespread demand, only bank customers considered to have “better credit” were offered the service. The early machines were also clunky, heavy (and dangerous) to move, insecure, unreliable, and seldom conveniently located.

Indeed, unlike today’s machines, the first ATMs could do only one thing: dispense a fixed amount of cash when activated by a paper token or bespoke plastic card issued to customers at retail branches during business hours. Once used, tokens would be stored by the machine so that branch staff could retrieve them and debit the appropriate accounts. The plastic cards, meanwhile, would have to be sent back to the customer by post. Needless to say, it took banks and technology companies years to agree common standards and finally deliver on their promise of 24/7 access to cash.

The globalisation effect

Estimates by RBR London concur with my research, suggesting that by 1970, there were still fewer than 1,500 of the machines around the world, concentrated in Europe, North America and Japan. But there were 40,000 by 1980 and a million by 2000.

A number of factors made this ATM explosion possible. First, sharing locations created more transaction volume at individual ATMs. This gave incentives for small and medium-sized financial institutions to invest in this technology. At one point, for instance, there were some 200 shared ATM networks in the US and 80 shared networks in Japan.

They also became more popular once banks digitised their records, allowing the machines to perform a host of other tasks, such as bank transfers, balance requests and bill payments. Over the last five decades, a huge number of people have made the shift away from the cash economy and into the banking system. Consequently, ATMs became a key way of avoiding congestion at branches.

ATM design began to accommodate people with visual and mobility disabilities, too. And in recent decades, many countries have allowed non-bank companies, known as Independent ATM Deployers (IAD) to operate machines. The IAD were key to populating non-bank locations such as corner shops, petrol stations and casinos.

Indeed, while a large bank in the UK might own 4,000 devices and one in the US as many as 12,000, Cardtronics, the largest IAD, manages a fleet of 230,000 ATMs in 11 countries.

Bank to the future

The ATM has remained a relevant and convenient self-service channel for the last half century – and its history is one of invention and re-invention, evolution rather than revolution.

Self-service banking and ATMs continue to evolve. Instead of PIN authentication, some ATMS now use “tap and go” contactless payment technology using bank cards and mobile phones. Meanwhile, ATMs in Poland and Japan have used biometric recognition, which can identify a customer’s iris, fingerprint or voice, for some time, while banks in other countries are considering them.

So it’s a good time to consider what the history of cash dispensers can teach us. The ATM was not the result of a eureka moment of a single middle-aged man in a bath or garage, but from active collaboration between various groups of bankers and engineers to solve the significant challenges of a changing world. It took two decades for the ATM to mature and gain widespread, worldwide acceptance, but today there are 3.5m ATMs with another 500,000 expected by 2020.

Research I am currently undertaking suggests that ATMs may have reached saturation point in some Western countries. However, research by the ATM Industry Association suggests there is strong demand for them in China, India and the Middle East. In fact, while in the West people tend to use them for three self-service functions (cash withdrawal, balance enquiries, and purchasing mobile phone airtime), Chinese customers consumers regularly use them for as many as 100 different tasks.

Taken for granted?

Interestingly, people in most urban areas around the world tend to interact with the same five ATMs. But they shouldn’t be taken for granted. In many countries in Africa, Asia and South America, they offer services to millions of people otherwise excluded from the banking sector.

In most developed counties, meanwhile, the retail branch and the ATM are the only two channels over which financial institutions have 100% control. This is important when you need to verify the authenticity of your customer. Banks do not control the make and model of their customers’ smart phones, tablets or personal computers, which are vulnerable to hacking and fraud. While ATMs are targeted by thieves, mass cybernetic attacks on them have yet to materialise.

I am often asked whether the advent of a cashless, digital economy heralds the end of the ATM. My response is that while the world might do away with cash and call ATMs something else, the revolution of automated self-service banking that began 50 years ago is here to stay.

Author: Bernardo Batiz-Lazo, Professor of Business History and Bank Management, Bangor University

Brokers losing clients as channel conflict thrives

From The Adviser.

Mortgage brokers have grown increasingly concerned about channel conflict over the last 12 months and singled out which lenders are costing them business.

The Adviser surveyed 766 brokers over two days last week and found that 88 per cent were more concerned about channel conflict than they were 12 months ago.<

Over 93 per cent of brokers cited the major banks as their biggest concern.

More than half of brokers surveyed (55 per cent) said channel conflict had influenced which lenders they recommended to clients over the last 12 months. However, 74 per cent of brokers said channel conflict would influence which lenders they recommend to clients over the coming 12 months.

Over 78 per cent of brokers admitted they had lost a client as a result of a direct approach from a lender. Of those brokers who lost a client through channel conflict, 97 per cent said the major banks and their subsidiaries were responsible.

The survey results are part of a well-established trend taking place in the third-party channel. As fears mount over channel conflict and the majority of brokers admit to losing clients, sentiment towards the big four banks is clearly trending downward.

Aggregators have reported a notable shift in the flow of mortgages to the majors. The latest AFG Competition Index, released in March, found that the big four lost 6.55 per cent share of broker-originated loans over a 12-month period.

The major banks and their subsidiaries (ANZ, CBA, Bankwest, NAB, Westpac, Bank of Melbourne, Bank SA, and St.George Bank) saw 65.25 per cent of all mortgages written to them through the broker channel in the quarter to February 2017, according to the Index.

While this figure is up from the low of 64.09 per cent in the quarter to December 2016, it is markedly down from the comparative period last year, when the majors accounted for 71.8 per cent of all mortgages written by the third-party channel.

Meanwhile, information gathered by Momentum Intelligence for its Third-Party Lending Report: Major Banks 2017, suggests that the dominance of the big four banks is being undermined by a growing dissatisfaction among mortgage brokers.

Growth Slowed in the March Quarter to 0.3 per cent

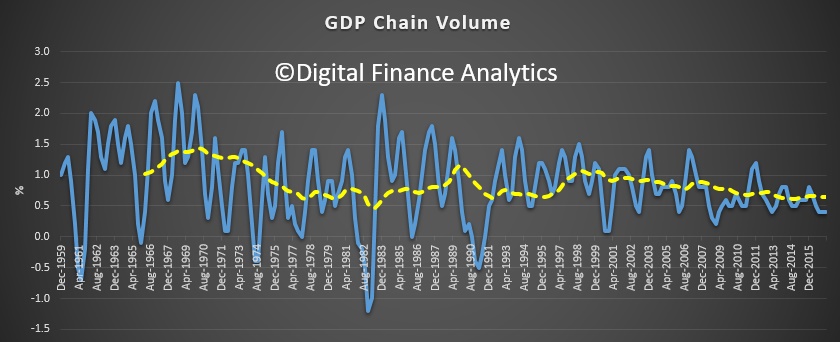
Data from the Australian Bureau of Statistics (ABS) shows the pace of growth of the Australian economy slowed in the March quarter to 0.3 per cent in seasonally adjusted chain volume terms. Through the year, GDP grew 1.7 per cent.

Investment in new housing fell by 4.4 per cent in the March Quarter 2017 which brings the sector down from record high investment in December 2016 and back to levels similar to those experienced at the start of 2016.

As Saul Estlake noted in The Conversation today:

It’s now been 103 quarters (25 years and 9 months) since Australia last had consecutive quarters of negative growth in real gross domestic product (GDP), in the March and June quarters of 1991.

Contrary to much-repeated claims, the Netherlands didn’t experience more than a quarter-century of economic growth without consecutive quarters of negative real GDP growth between the early 1980s and the global financial crisis.

The Netherlands’ real GDP declined by 0.3% in the June quarter of 2003, and by 0.01% in the September quarter of that year, according to data published by Statistics Netherlands and, separately, by the OECD. So, at best, the Netherlands went for only 22 years without experiencing a recession. Australia surpassed that benchmark in 2013.

Yes, that second quarterly decline in 2003 was almost imperceptible. But sporting records are delineated by margins as small as one one-hundredth of a second, so we can’t blithely discount a -0.01% fall in real GDP as “not relevant”.

Even if you blinked and missed that tiny second successive decline in real GDP in the September quarter of 2003, the Netherlands still wouldn’t hold the record for the longest run of continuous economic growth. That belongs to Japan – which, according to OECD data, went from the March quarter of 1960 to the March quarter of 1993 without ever registering two or more consecutive quarters of negative growth in real GDP. That’s 133 quarters, or more than 33 years.

Indeed, if Japanese GDP data were available on a quarterly basis earlier than 1960 it’s likely that this run of continuous economic growth would have been even longer, perhaps as long as 38 years, inferring from annual data available back to 1955. So Australia would need to avoid consecutive quarters of negative real GDP growth until at least 2024 if it is truly to be able to claim this “world record” as its own.

Even more importantly, the definition of a technical recession as (two or more consecutive quarters of negative growth in real GDP) is, as former RBA Governor Glenn Stevens said, “not very useful”. It was originally proposed in December 1974 by Julius Shishkin, who at that time was the head of the Economic Research and Analysis Division of the US Census Bureau (now the Bureau of Economic Analysis, which publishes the US national accounts).

It’s not used to identify recessions in the US. It takes no account of differences over time, or as between countries, in the rates of growth of either population or productivity – which are the key determinants of whether a given rate of economic growth is sufficient to prevent a sharp rise in unemployment. This is something which most people (other than economists) would use to delineate a recession.

While Australia has avoided consecutive quarterly contractions in real GDP since the first half of 1991, we’ve had two periods of consecutive quarterly declines in real per capita GDP (in 2000 and 2006). We’ve also had two periods of consecutive quarterly declines in real gross domestic income or GDI, which takes account of income gains or losses accruing from movements in Australia’s terms of trade (in 2008-09, and in 2014). Perhaps most meaningfully of all, Australia has had two episodes where the unemployment rate has risen by one percentage point or more in 12 months or less (in 2001 and 2009).

That’s still a better track record than almost any other advanced economy during the past quarter-century or so – and it reflects well on the quality of economic management (and the nature of our luck) over this period. Nonetheless, we shouldn’t be in the business of awarding ourselves prizes to which we’re not entitled.

And the long term trend also highlights a slowing, so we need new growth engines if we are to keep the growth ball in the air!

Growth was recorded across the economy with 17 out of 20 industries growing during the quarter. Strong growth was observed within the service industries including Finance and Insurance Services, Wholesale Trade, and Health Care and Social Assistance.

Agriculture, Forestry and Fishing decreased after strong growth in the previous two quarters, while Manufacturing decreased for the tenth time in eleven quarters.

Chief Economist for the ABS, Bruce Hockman said; “This broad-based growth was tempered by falls in exports and dwelling investment. Dwelling investment declined in all states, except Victoria, and overall is the largest decline for Australia since June 2009.”

Compensation of employees (COE) increased 1.0 per cent in the March quarter, a pick up from the negative growth recorded in the December quarter, and is consistent with other labour market data. COE is still only 1.5 per cent higher through the year, continuing to contribute to the reduction in the household saving rate. The household saving ratio fell to 4.7 in the March quarter, half the rate it was in March quarter 2013.

Mr Hockman said; “Even though there was a fall in dwelling investment this quarter, levels are still historically high. There was also positive growth in household consumption, albeit in non-discretionary items such as electricity and fuel purchases. The softer growth in household consumption is broadly in line with modest income growth.”

Bank App Power Users Are Still Active Branch Visitors

From S&P.

Despite the growing popularity of banking apps, the death knell for brick-and-mortar branches should not be sounded just yet.

In the 2017 Mobile Money survey from S&P Global Market Intelligence, 81% of the mobile bank app users polled said they had visited a branch of their primary bank sometime within the month prior to taking the survey.

What is more, the study showed a higher percentage for those that used their app at least once a day. That is, customers that used their mobile app more were more likely to have visited a branch than those that used their app less than once a day. Based on this, perhaps apps can be viewed as a barometer for the most engaged customers, both in the cyber world and the real world.

But while they may still be going to branches, frequent app users are not necessarily loyal to their banks. The survey showed that daily app users were three times as likely as non-daily users to have switched their checking account to a different bank in the year prior to the survey.  It might be that these frequent app users are hunting for the best possible terms and services, which could include the functionality of the bank’s app. Active users were much more willing to consider opening a checking or savings account with a “branchless bank” (i.e. one with no physical building/office locations).

Deposits and withdrawals were the most commonly cited activities that these so-called power users did inside their bank branch. The same was true for non-daily app users. One of the areas where the two groups notably diverged, however, was savings and investment services. Of daily app users that visited a bank branch in the prior month, roughly 17.7% made use of savings and investment services at the branch. For non-daily users, the percentage was only around 6.4%.

As one might expect, the people that used the app heavily were more open to the idea of a paid app. Daily users were nearly twice as willing as non-daily users to pay a fee of $3 per month to keep using their mobile bank app. The age breakdown of active versus non-active users was also as one might assume. About half of those aged 18 to 25 used their app at least daily, versus 17.6% of those aged 67 and over.In terms of the services they use on the app, daily and non-daily users do many of the same things, such as checking their balance and reviewing transactions. One of the areas where they seemed to differ, though, was transferring money to another person. About 25.7% of daily users said this was a feature they used most, versus around 12.2% for non-daily users.

As far as features they would like to see, daily users were much more likely to want a smartwatch app than non-daily users, which stands to reason. The daily users are likely more tech-savvy in general, and therefore probably want to use the latest technological gadgets.

The 2017 Mobile Money survey was fielded between January 26 and February 1 from a random sample of 4,000 U.S. mobile bank app users aged 18 and older. S&P Global Market Intelligence weighted the data to be nationally representative. Results from the survey, which was conducted online, have a margin of error of +/- 1.6% at the 95% confidence level based on the sample size of 4,000.

Branches still leading channel for major banks

From The Adviser.

Brokers are writing less than 50 per cent of mortgages for the big four banks but have become the dominant channel for Australia’s smaller lenders, according to fresh APRA figures.

APRA’s quarterly bank property exposure data for March found that brokers wrote $31.3 billion worth of home loans for the big four, up 8.7 per cent over last year.

While brokers currently account for 46.6 per cent of major bank mortgages, Australia’s non-major lenders are seeing 52.1 per cent of loans written through the third-party channel.

APRA figures found non-major broker originated loans increased by 19.7 per cent between the March 2016 and March 2017 quarters. Foreign bank subsidiaries saw a significant increase in broker loans, up 92.9 per cent over the year.

The data comes after a number of reports in recent weeks have flagged changes to the third-party distribution strategies of the major lenders.

A recent Morningstar research report into Mortgage Choice noted a number of “industry headwinds” for the broking industry, including a change of direction in the mortgage strategies of two major banks.

“Changes in mortgage distribution strategy by Australia’s two largest mortgage banks CBA and Westpac will over time likely slow the growth rate of home loans sourced through brokers,” the report said.

These changes have led one alternative lender to urge mortgage brokers to diversify their offering.

Pepper’s managing director of Australian mortgages and personal loans, Mario Rehayem, told The Adviser that brokers need to look beyond the big banks in today’s market.

“Your business model, and the whole value of your business as a broker, hinges on the diversity of your back book,” Mr Rehayem said. “If you want to build a business, an asset that you can one day sell as a going concern, the buyers will be looking at the diversity of your back book, the run-off rate and your arrears,” he said.

“Imagine if more than one major bank changed their distribution strategy overnight. What’s going to happen to the broker market? How will brokers react to that? If you’re going to be pigeonholed to one bank and tomorrow that bank decides that their belly is full of third-party business, what are you going to do?”

Mr Rehayem said that brokers shouldn’t be “cherry picking” clients but instead position themselves to satisfy every type of consumer. He added that brokers are being forced to radically change their business models as banks change their appetites.

Australia’s largest mortgage provider, CBA, has been clear about its plans to grow its proprietary channel, telling The Adviser in February that it was a “strategic priority” for the group.

Australians Choose Digital Payments

Australians are embracing digital payments according to the latest  Milestones Report released by the payments industry self-regulatory body Australian Payments Network (previously Australian Payments Clearing Association). As a result, cash and cheques are in decline. Australia’s digital economy underpins what can increasingly be characterised as a less-cash society.

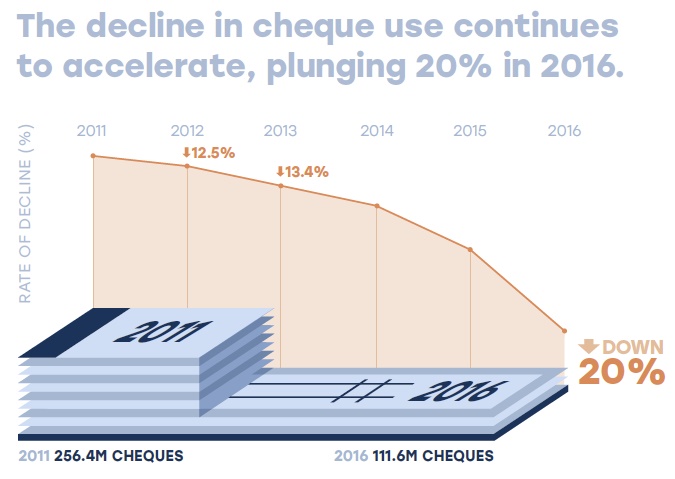
Cheque use plunged 20% to 111.6 million – the largest drop ever-recorded. The value of cheques dropped by 6% over the same period, after remaining flat in 2015 and dropping by less than 1% in 2014. Over the last five years, cheque use has dropped 56%.

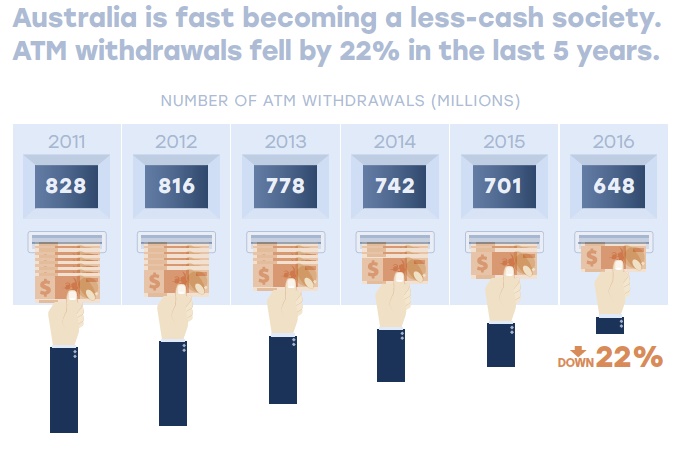
The number of ATM withdrawals dropped 7.5% to 648.5 million in 2016 following a 5.5% drop in 2015 and a 4.7% drop in 2014. Since 2011, ATM withdrawals have dropped by 22%.

CEO of the Australian Payments Network, Dr Leila Fourie said “Looking at the payment choices that Australians make, it’s clear that the vast majority of us are moving away from cash and cheques faster than ever before. This is happening because of widespread use of new technology combined with a strong preference for faster and more convenient payment options.”

Consumers’ preference for digital payments is reflected in the strong year-on-year growth in card and direct entry transactions:

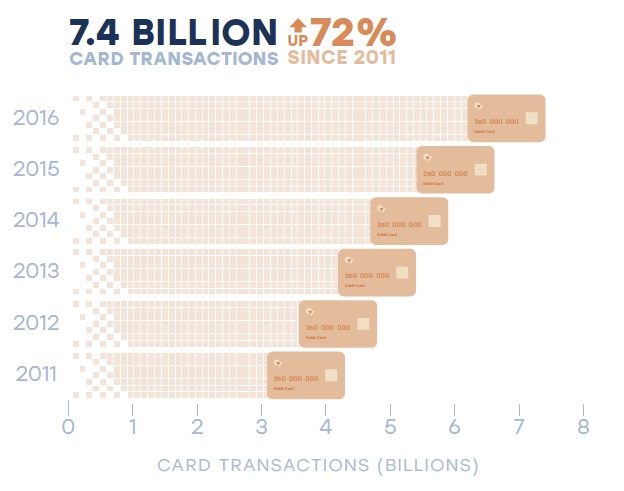
  • Australians used their cards 12.3% more in 2016, making 7.4 billion transactions.
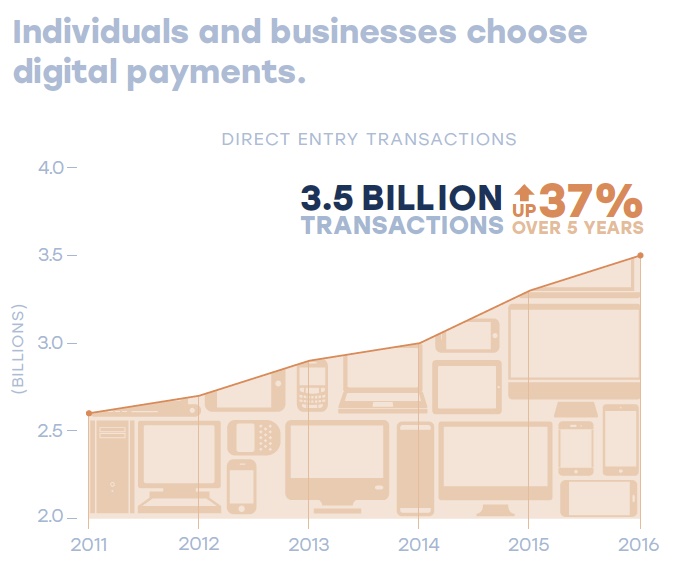
  • Direct entry transactions (direct debit and direct credit) increased by 8.6% to 3.5 billion.

Over the last five years, card transactions grew by 72% and direct entry by 36%.

Increased smartphone penetration, which reached 84% in 2016, up from 76% in 2014, is an important contributing factor.

Australia’s online retail spend was estimated at $21.6 billion in 2016 and encouragingly from a digital inclusion perspective, this spend is not restricted to digital natives. Older Australians are using online shopping platforms more, with domestic online spending growing by 8.7% for those in the 55-64 age group, and 7.5% for 65+.

The Report also tracks progress on initiatives supporting Australia’s transition to the digital economy including the industry’s New Payments Platform and Australian Payments Plan.

Suncorp Launches Another New Style Store

Suncorp has today unlocked the doors to a new financial services experience in Queensland, opening its second Concept Store in the Brisbane suburb of Carindale.

The Carindale Concept Store brings together solutions and services from across the company’s brands, including Suncorp, AAMI, Shannons and Apia, as well as solutions from other providers, to help customers with life’s key financial decisions, such as purchasing a home.

Suncorp’s CEO Customer Platforms Gary Dransfield said the Store leverages insights gained from the Parramatta Concept Store, Brisbane city Co-Creation Lab and understanding of the Queensland market to create an innovative store experience in a unique retail environment.

“We’ve reimagined the experiences customers expect to receive when they visit a traditional bank branch or insurance store to make it easier for them to make decisions around the moments which matter most,” Mr Dransfield said.

“The Store connects customers to new technologies and digital solutions to help customers buy and protect their home or car, start a family, or start and grow a business.”

Taking inspiration from international retailers, the Carindale Concept Store utilises innovation to make customer experiences interactive and tailored to support their individual needs.

Mr Dransfield said the company’s strong brand heritage in Queensland would help deliver the benefits of Suncorp’s marketplace strategy to local customers through connecting them to a wider range of products and services from across the company’s many brands.

“We’re creating unique experiences that help educate, inspire and delight our customers, with the express goal of helping them in those areas we know can be confusing, complex and intimidating,” Mr Dransfield said.

“The Store’s test and learn environment also enables us to trial new concepts with customers and make changes based on their feedback before introducing them in other locations.”

Key experiences and technologies include:

Design – Interactive format which allows customers to experience retail zones specific to their individual need. The modular design allows for the store to change its format to suit monthly themes and workshops. The modern appearance has a light space, with greenery to create a visually appealing store.

Key features – Simplified transactional space, Open 7 days, concierge greeting, designated self-service area, multi-brand offering, workshops and seminars, free wifi and refreshments.

Discovery Tool – Connects customers with Suncorp solutions, as well products and services from other companies, across an entire journey (example: Buying a Home. Starting a Business) Companies featured – Jim’s Building Inspections, Lawlab, Hipages, JB Hi-Fi

Industry heads speak out on channel conflict

From The Adviser.

The head of a major aggregator and the executive director of an industry association have hit out at reports of channel conflict between banks and brokers.

Following The Adviser’s article yesterday concerning reports of a CBA branch offering to refinance a customer’s home loan at a “lower rate than his broker” (to which CBA and Aussie have not yet responded), two heads of industry have spoken out on this type of behaviour.

Speaking to The Adviser, Peter White, executive director of the Finance Brokers Association of Australia (FBAA), said that “if this is true, then for a bank branch to be doing that, it is unequivocally and unquestionably disgraceful”.

Mr White said: “The bank already had the client, I don’t think the bank branch should have that sort of authority to be able to do that in the first instance because what they are doing is reducing the margins that the bank has already accepted on a transaction.

“So, this is just a deliberate undercutting means, not to gain a client, but specifically to target brokers… If the bank has the ability to reduce the interest rate, they should offer it to everyone in the marketplace.”

He continued: “I think that whatever branch has done this needs a serious reprimand from CBA. If other branches do this, it has a significant impact on the bank’s lending portfolio and the margins and actually hurts the bank’s bottom line profitability-wise – because it’s actually more cost effective to write a loan through the broker network than the branch network.”

Mr White added that it “added greater insult to injury” that the broker who had written the loans originally was an Aussie broker, given that CBA “has a huge financial interest” in them.

He said that channel conflict and clawbacks are forming part of the discussion that it is putting together for the ASIC remuneration review and Sedgwick review.

Raise it with your aggregator

Mark Haron, the director of aggregation group Connective also spoke to The Adviser following the release of the story, saying that he would be “having a chat” with CBA.

While he added that he had not yet received notification from Connective brokers of CBA acting in this way, he emphasised that it is “really important that when brokers find these channel conflict issues that they immediately raise it with their aggregator”.

He commented: “This type of thing does undermine the relationship between the bank and the broker. Whether it’s a one-off or whether it’s systemic, the aggregator should be talking to the bank about it and trying to do something about it either way.

“So, the best way to manage it is to raise it to the aggregator so that the aggregator, through the agreements with the banks, can have each one dealt with.”

Mr Haron said that in the past he had found the banks to be “very, very responsive to any individual or potentially systemic channel conflict issue” and would make adjustments, where necessary.

However, he said that if this “stops happening and the banks are unapologetic” and were treating the broker channel differently, then Connective would be “making sure that the brokers are made aware of that and the brokers can determine whether or not they want to continue their own business with those banks”.

Touching on comments made by Digital Finance Analytics’ principal Martin North earlier this week, which suggested that some big banks had changed their appetite for broker-originated loans, Mr Haron said that he did not believe banks were changing tack on how they deal with brokers “at this stage”.

He said: “We’re not seeing it at this stage, but that’s not to say that they won’t.

“There are some of the major banks, like Westpac and CBA, that are being more focused on the proprietary channel and how they can serve customers better through that, and that’s understandable, because that’s how banks will always want to operate. But, if they do that to the detriment or by neglecting a broker, then it will hurt the overall market share.”

He continued: “I think most banks are aware of that and they will certainly see that played out if they don’t look after brokers. Certainly, if they don’t support brokers or see more conflict issues arising where it is clearly systemic and not a one-off, it will be quite detrimental and problematic for any bank that decides to go down that path.”

Major bank branch undercutting broker rates

From The Adviser.

The Adviser has learned that CBA could be actively targeting home loan customers that were introduced by brokers with the promise of a better rate should they refinance via a branch.

Despite the bank telling The Adviser earlier this week that it is once again accepting new refinance applications for investment home loans with P&I repayments through broker channels (following a hiatus on new investor refinance applications in February), concerns that some of the major banks are favouring their branch networks over the broker channel are rising.

Adding to the speculation, a source speaking to The Adviser said that he was actively targeted to refinance his home loan during an application for a credit card at a North Sydney branch of the Commonwealth Bank of Australia (CBA).

During the assessment process the source was surprised to hear that the branch could give him a “lower rate than his broker” if he refinanced his home loan directly with CBA.

The loan was originally written by an Aussie broker.

When asked how the branch was able to do this, the representative at the bank told the CBA-customer that he had been told by his manager to refinance broker-originated loans where possible.

The Adviser can confirm that a representative at the Walker Street branch in North Sydney said that they could give a CBA customer a ‘better deal’ than a broker on a refinance loan.

When asked by The Adviser whether CBA is looking to reduce its mortgage flows through the broker channel, a Commonwealth Bank spokesperson said: “Commonwealth Bank is committed to consistently delivering the best customer outcomes for home buyers, and mortgage brokers are an important part of how we meet the home buying needs of customers.”

Proprietary channels a ‘strategic priority’ for CBA

However, the bank has been open in its preference to boost the proprietary channel, telling The Adviser in February that it was a “strategic priority”.

Following the 2017 half year results announcement in February (which showed a 4 per cent drop in broker market share over the six months to December 2016), The Adviser asked CEO Ian Narev whether the bank was moving away from the broker channel.

Mr Narev said that while the broker network “provides a really important proposition that customers like and want” and will be a “critical part of the group strategy”, the “preference” was for customers to go through the proprietary channel.

He said: “[O]ur preference is always going to be, as you can imagine — for all sorts of reasons — to service as many of our customers through our own channels as we possibly can. That’s a strategic priority for us.”

Mr Narev told The Adviser that the increase in loans being written directly through the bank was due to the fact that it had “upgraded and put more lenders in the branches — people who are able to have lending specific conversations with customers”.

He added: “We’ve been able to provide more analytics to support those lenders and others in the branch and we’ve really invested in the branch proposition and as a result of that we’ve seen our own share of the proprietary channel go up at the time when the markets have gone down — so for us that is a pretty good outcome.”

Lloyds Bank is shrinking hundreds of UK branches to be staffed by just 2 people

From Business Insider UK.

Lloyds Bank intends to shrink hundreds of its UK branches due to growing numbers of customers using online banking, according to a BBC report.

Its new “micro-branches” will have no counters and just two staff carrying mobile tablets, who will help customers use in-store machines, such as pay-in devices.


The new “micro” format will use much less space than existing branches, in some cases as little as 1,000 square feet.

The bank said the reason for the move was a “profound change in customer behaviour” which has seen growing numbers of transactions move online.

Some of the branches being converted will be Halifax and Bank of Scotland branches.

Jakob Pfaudler, Lloyds’ chief operating officer for retail, told the BBC: “We have a lot of branches that used to have a lot of footfall, and therefore feel quite empty and intimidating for customers. So when there’s too much space we may board up places in existing branches.”

In 2014, Lloyds announced a separate plan to close 400 branches over three years, with the loss of 9,000 jobs. It will have 1,950 left in the UK by the end of 2017.