ANZ IH, Profit Up, NIM Down

ANZ’s IH17 result, announced today shows the benefit of the consolidation of the business, with more focus on growth in Australia and New Zealand.  Profit is up, despite a drop in Group Net Interest Margin, with support from loan and deposit growth, and lower provisions. All well and good so long as the local economy performs!

ANZ today announced a Statutory Profit after tax for the Half Year ended 31 March 2017 of $2.9 billion up 6% and a Cash Profit1 of $3.4 billion up 23% on the prior comparable period (PCP). Cash profit was up 23%.

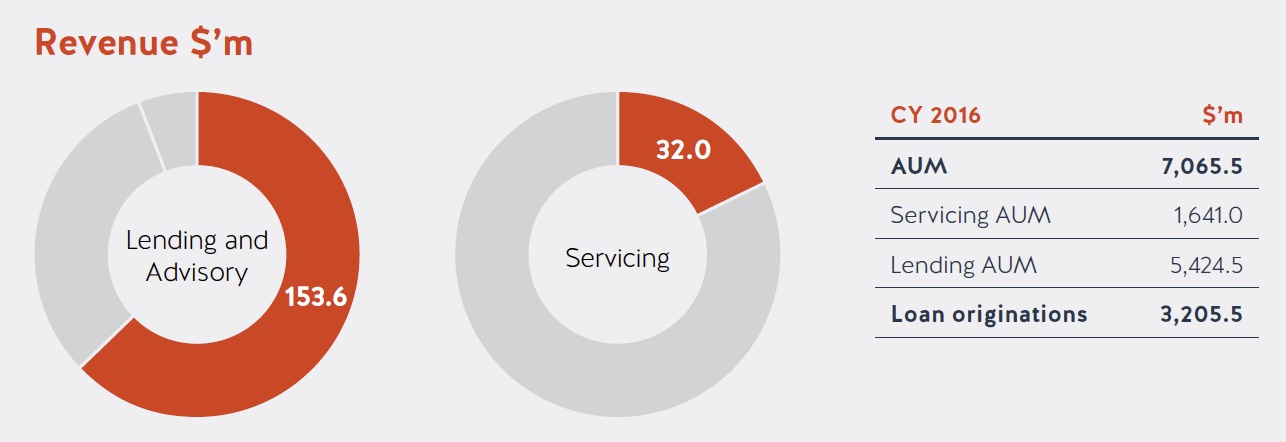
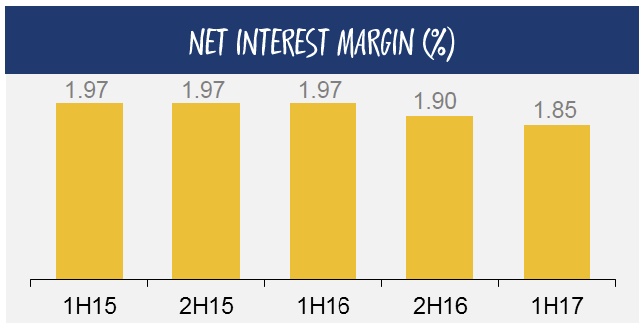
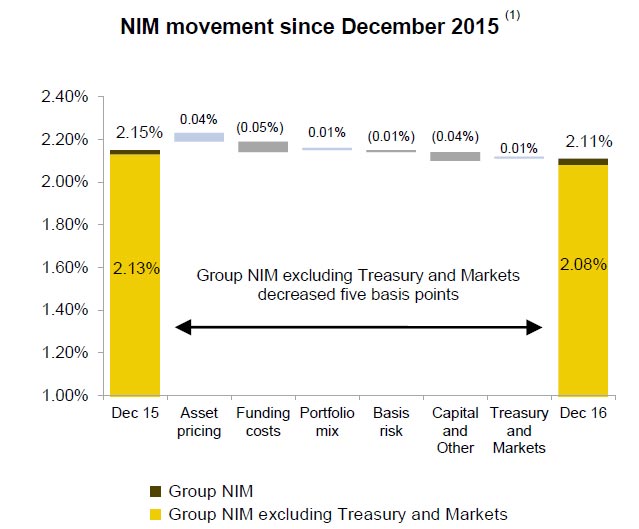
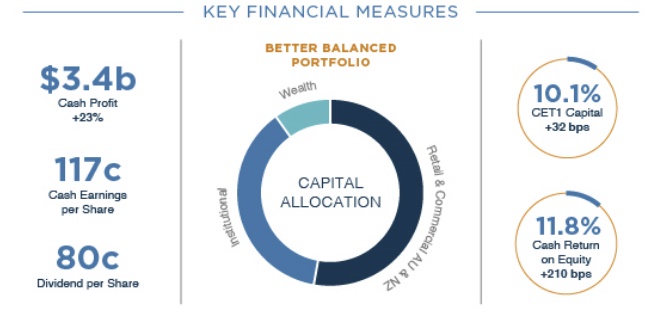
Group net interest margin fell 7 basis points from 1H16 to 2%.

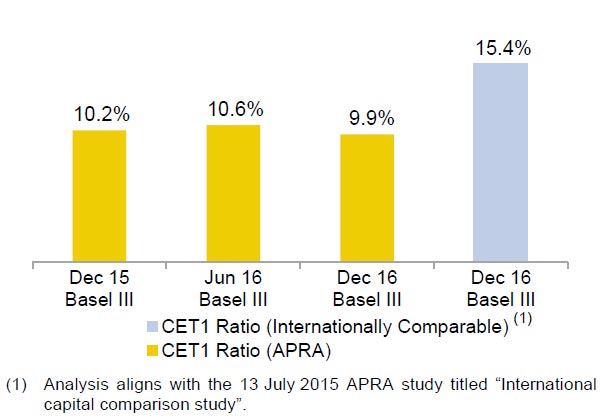
ANZ’s Common Equity Tier 1 Capital Ratio was 10.1% at 31 March 2017 up 52 basis points (bps) from 30 September 2016. (15.2% on an
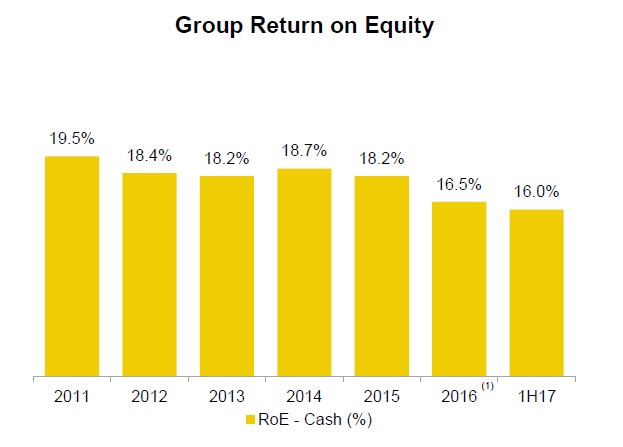
Internationally Comparable basis). Return on Equity increased
210 bps to 11.8%.

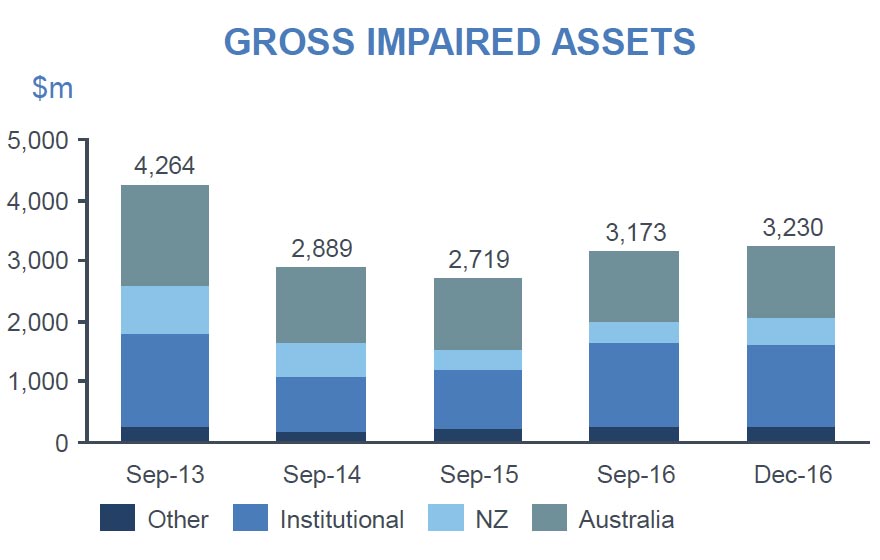
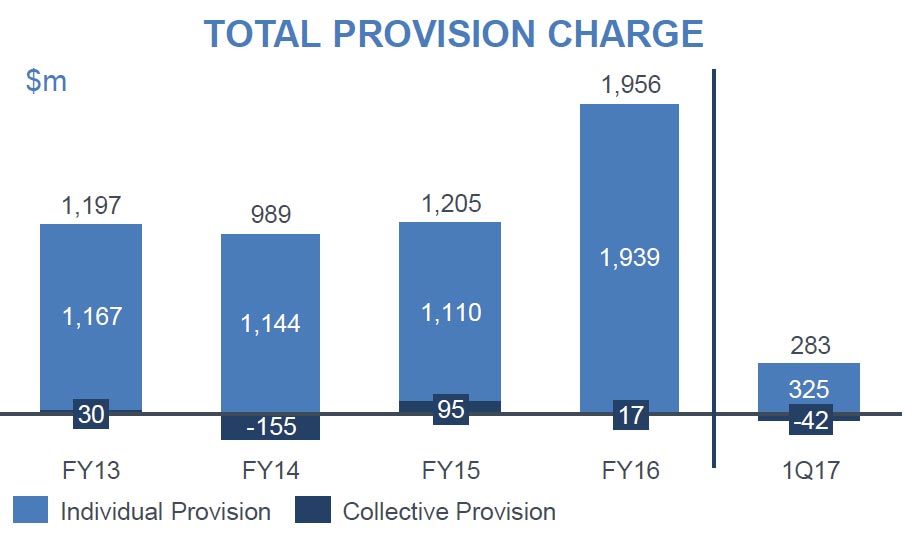
The total provision charge of $720 million ($787 million individual provision charge and a $67 million collective provision release) equates to
a loss rate of 25 bps, a decline of 11 bps from the end of 2H16. Gross
impaired assets over the same period decreased 7% to $2.94 billion with
new impaired assets down 3%.

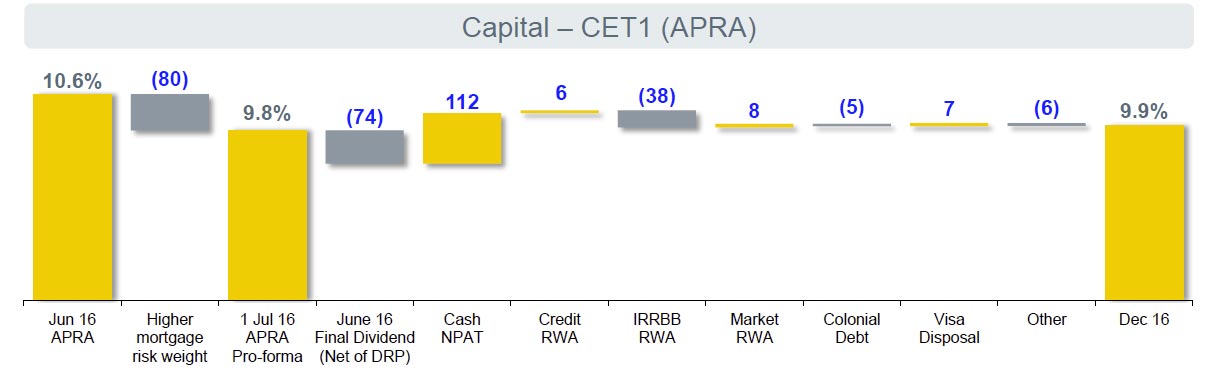
Strong organic capital generation performance saw Australian Prudential Regulation Authority (APRA) Common Equity Tier 1 capital ratio above 10% for the first time and Return on Equity increased materially for the
first time since 2010.

The Group has a strong funding and liquidity position with the Net Stable
Funding Ratio at 113% up 5% from 30 September 2016. The improvement
was largely attributable to strong Retail deposit growth in Australia.

The FY17 interim result reflects further benefits from a significant reshaping of the business driven by ANZ’s strategic focus to create a simpler, better capitalised and more balanced bank producing better outcomes for customers and shareholders.

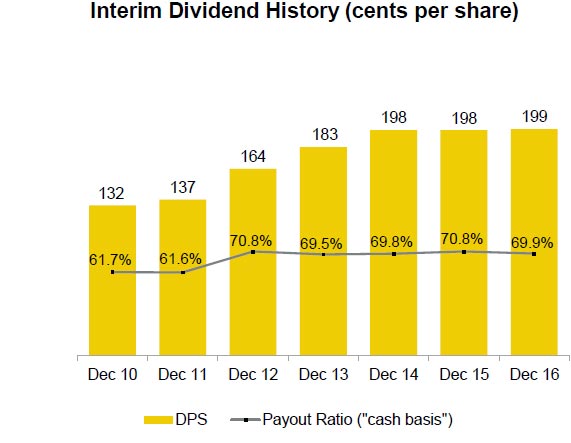
The Interim Dividend of 80 cents per share fully franked, is the same as the Interim Dividend in FY16, reflecting a payout ratio of 69% (Pro Forma 65%).

Highlights include:

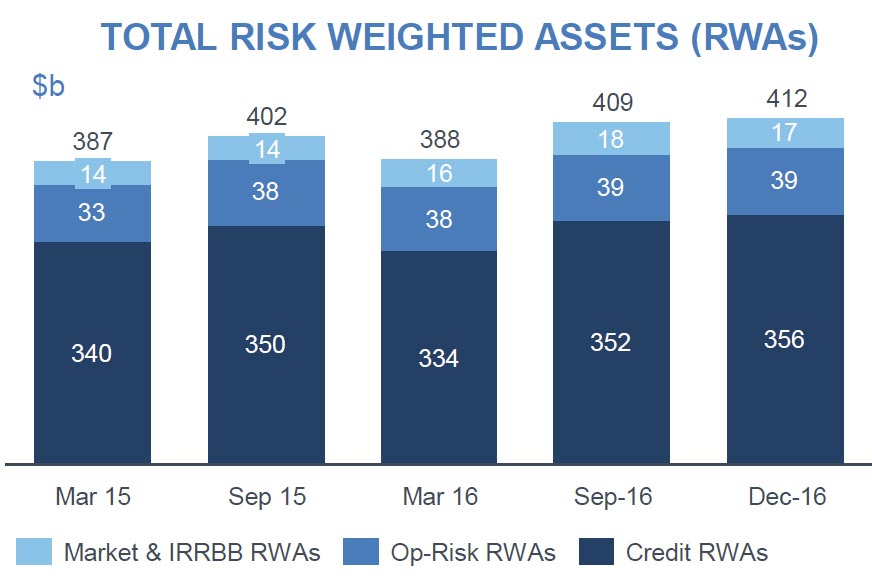
  • Over 50% of Group Capital is now allocated to the Retail and
    Commercial businesses in Australia and New Zealand up from 44%.
  • Capital reallocation is evidenced in a $7b net decrease in Credit
    Risk Weighted Assets (CRWA) from the end of FY16 on a constant
    currency basis. This includes a $2b increase in Retail and
    Commercial offsetting a reduction in Institutional CRWAs of $8b.
  • The Group CET1 ratio was 10.1% at 31 March; net organic capital
    generation of 119 bps in the half was primarily driven by earnings
    growth along with RWA reduction.
  • Announced the sale of the Retail/Wealth businesses in six Asian
    countries, UDC Finance in New Zealand and ANZ’s 20% holding in
    Shanghai Rural Commercial Bank. Disposal of non-core assets will
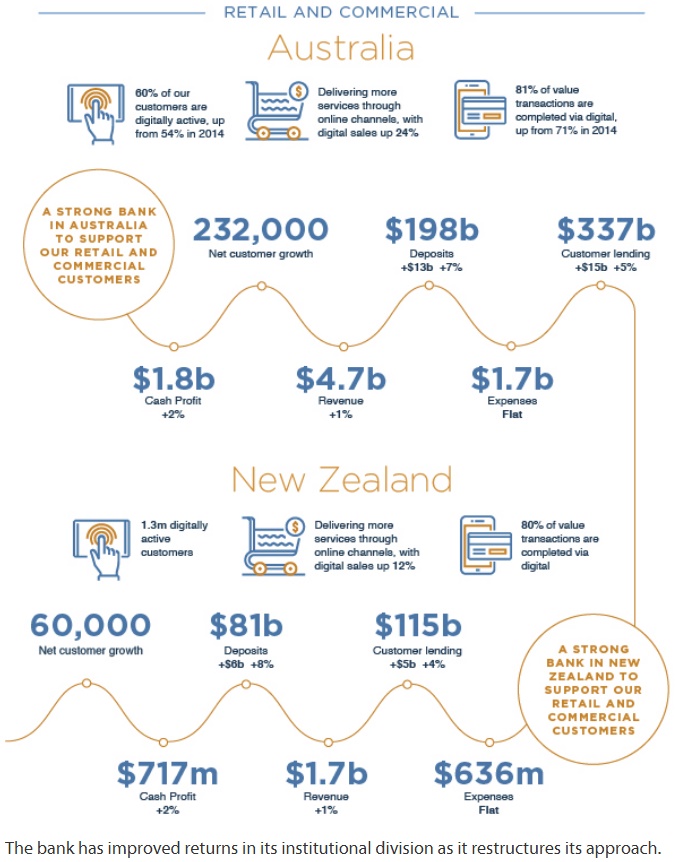
    deliver an additional 65 – 70 bps of capital by the end of FY17.
  • Strong customer deposit growth in Australia (up 7%) and New
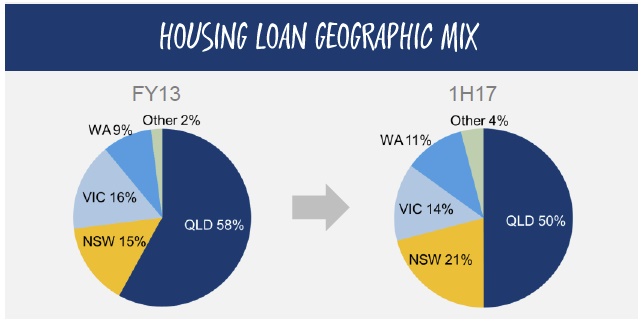
    Zealand Retail and Commercial (up 8%).
  • Australia home lending up 5%, maintained #3 market share while
    improving the portfolio mix, #1 market share in New Zealand.
    Small business lending in Australia up 4%, New Zealand up 8%.
  • The Institutional Payments and Cash Management business
    increased revenue 3%.
  • ANZ has a clear leadership position in Australia and New Zealand
    Lead Institutional Bank Penetration and was a Top 4 Corporate Bank
    in Asia for the fifth successive year.
  • New balanced scorecard remuneration structure introduced for
    Australian front line Retail Banking staff, focussed largely on
    customer service outcomes.
  • Improving the customer experience – introduced card replacement
    for lost or stolen cards within 15 minutes via the digital wallet.
    60% of customers in Australia and 64% in New Zealand are now
    digitally active.
  • Australia Retail and Commercial customer numbers up 4%; 60% of
    Retail customers holding multiple products. Service improvements
    along with products like ApplePay have driven net customer growth.
    Launch of Home Loan Online Application in Australia driving easier
    loan approvals. Expanded support to Small Business customers in
    Australia; new banker tools accelerate origination and assessment.

The adoption of Agile at scale continues, with planning is already underway to broaden its roll out in early 2018.

Pepper Originated $2.6bn in Australian Mortgages

Pepper Group released their 2016 annual report which shows double digit profit growth in 2016 to $61.0m, up 26% from $48.6m in 2015. The global consumer lending and mortgage servicing approach reach $52.4bn, comprising $7.0 bn in lending assets (up 14% from 2015)  and $45.4bn in funds serviced for other institutions (up 25% from 2015).

In 2017 they are forecasting adjusted NPAT to be at least $67.5m (excluding performance fees).

Following a spate of acquisitions, they say the consumer lending businesses in UK, Ireland, Spain and Asia are building scale.  They say the profitability of the Australian and Asian businesses are “lending-led”, whilst those in Europe are “Servicing-led”.

They say” we often lend when banks won’t, and we can do this because we have developed proprietary credit processes and have adopted a risk based pricing methodology though getting to know customers’ individual circumstances intimately”.

In Australia, total mortgage originations were up 36% to $2.5bn, and asset finance originations  up 69% to $673m. Brokers using Pepper have grown from 600 in 2012 to over 2,630 in 2016. 72% of the portfolio is owner occupied with an average LVR of 71%. 90% of the portfolio is residential housing.

They completed 2 non-conforming RMBS transactions totalling $1.5bn in addition to $1.0 billion in whole loan sales

Bank of Queensland Takes A Hit

The Bank of Queensland released their 1H17 results today. Interim cash earnings after tax were $175 million for the six months to 28 February 2017, down 2 per cent on the prior corresponding period. Statutory net profit after tax was down 6 per cent to $161 million.

It is not pretty, though there may be some upside in the the second half, depending on potential out of cycle uplifts to support net interest margin. Competition has been tough, and intense pressure on mortgage pricing plus higher deposit costs were not fully offset by out of cycle uplifts. In addition, as a regional player, they have to hold more capital than the majors, which costs. Whether moving towards advance capital metrics will help is a moot point. Nevertheless, the BOQ Board  maintained a fully franked interim dividend of 38 cents per share in line with the prior half.

Net Interest Margin was down 5 basis points on the prior half to 1.85%, they are looking to get back to 1.89% in second half.

BOQ Managing Director and Chief Executive Officer Jon Sutton said “We have prioritised margin and credit quality over growth in this half, in what has been an intensely competitive period not just in lending but also in retail deposits.”

The cost to income ratio was up 100 basis points to 47.4%. Underlying expenses fell, and there will be an ongoing focus on efficiency.

BOQ’s asset quality was again a highlight with Loan Impairment Expense down 25 per cent to $27 million, or 13 basis points of gross loans.

BOQ’s strong capital position improved, with the Common Equity Tier One ratio up 29 basis points over the half to 9.29 per cent. They are pushing towards advanced accreditation.

A quick look at their home lending shows settlements were down, but they said recent application volume were up, not investment lending, and they have the latest APRA guidance on expense and and income criteria in place. As competitors gear up to follow the revised guidelines, the bank expects stronger volume flows.

The geographic mix changed somewhat, with a focus on NSW, and growth in the “wobbly” WA market.

30 Day Past Due are 0.98%.

The LVR splits reflect industry trends, but the share of loans via brokers is still lower than it might be.

They appear to have low exposures to apartment construction, and regional housing.


Genworth Seeks Possible On-Market Share Buy-Back

Genworth released their notice of the 2017 Annual General Meeting today, to be held on 11 May 2017.  They are reacting to the changing market conditions, with lower LMI volumes at lower LVR’s.

Of note is Resolution 4 which asks shareholders to approve an on-market share buy-back of up to 125 million of the Company’s issued ordinary shares, over a period of up to 12 months form the data of the 2017 AGM.

We were previously advised that the Genworth was evaluating the potential to deploy and excess capital towards profitable opportunities that would enhance the return profile of the business and in the absence of those, capital was to be returned to shareholders.

Given that the Companies regulatory solvency ratio continues to be above the board’s target capital range of 1.32 to 1,44 times the PCA, and is expected to remain so, buy-back is an option.

Shareholders are required to approve the buy-back thanks to the 10/12 rule limit. They will also have to comply with ASX listing rules and approval of APRA.

There is no guarantee the Company will buy back the full number of shares. Currently there are 509,365,050 shares.

They say excess capital may also be deployed to:
• enhance the return profile of the business;
• pay dividends in excess of profits earned;
• undertake a capital reduction;
• reduce Tier 2 capital; or
•reduce reinsurance.
These alternatives will continue to be evaluated.

ME Bank profit up 34 per cent

Industry super fund-owned bank ME today reported an after-tax underlying net profit of $40.4 million for the six months to 31 December 2016, a rise of 34% on the previous corresponding period.

ME CEO, Jamie McPhee, said it was a strong result in the face of margin pressures that are expected to continue throughout the year.

Home loan settlements hit $3.2 billion for the six months, up 54% compared to the previous corresponding period, while ME’s home loan portfolio grew 9% to $20.6 billion. Total assets grew 6% to $24.6 billion.

ME’s statutory profit after tax, which includes the amortisation of realised losses on hedging instruments, a loss on the sale of the business banking portfolio and transition costs associated with a significant new technology partnership with Capgemini, was $29.3 million (HY16: $34.5 million).

Net interest margin declined 3 basis points to 1.46% relative to the previous corresponding period due to competition for new customers and higher funding costs; however, the impact on earnings was offset by increased home loan sales.

ME’s digital strategy incorporates increasing levels of process automation, including credit assessments and valuations, leading to further improvements in the cost to income ratio.

Customer numbers grew 8% to 393,416 and the bank passed the 400,000-mark in in early March 2017.

Net interest income increased 9% to $162.4 million with total income up by 3% to $187.1 million. Total operating expenses decreased from $118.9 million to $117.2 million.

ME remains very well capitalised at 31 December 2016, with a Common Equity Tier 1 ratio of 10.40% and a Total capital ratio of 14.84%.

McPhee said several strategic initiatives with its industry super fund partners were progressing well including providing customers with a single view of their banking and super accounts through a partnership with Link Group, which is scheduled to be launched with a major industry super fund in the second half of FY17.

As reported in Australian Broker,

Over half of the bank’s home loan settlements came through the broker channel, Lino Pelaccia, ME’s general manager of broker, told Australian Broker.

“The contribution from brokers is slightly up on the same time as last year due mainly to our continued expansion into the broker market,” he said.

“Increasing numbers of brokers are considering ME home loans, we continue to improve our broker services and service levels have remained very consistent over the last 12 months with new technology, and we continue to offer very competitive prices compared to other banks.”

Looking at the breakdown of settlements between owner-occupier buyers and investors, Pelaccia said the ratio will not change much given APRA’s current cap on growth in investment lending.

“We also note ME is well below that cap at the moment and so have some room to win more investor business before the end of the financial year,” he said.


Brokers write $339m in loans for CUA

From Australian Broker.

Credit Union Australia (CUA) has issued $1.06bn in mortgage lending for owner occupiers and investors in the six months prior to 31 December 2016.

Talking about the firm’s half yearly financial results released yesterday (8 March), Natasha Kelso, CUA national manager for broker, said that 32% of all mortgage lending during this period – around $339m – was via the broker channel.

This was down slightly from the share of broker-originated lending in the previous half yearly period which equated to around 40%, she said.

“It’s important to CUA that we provide new and existing members with a choice of channels in which to obtain a home loan. Brokers are an important part of that mix and CUA is exploring opportunities to increase our third-party relationships in 2017.”

The credit union’s focus on improving relationships with brokers throughout the latter half of 2016 included a national roadshow to educate brokers about CUA and its recent lending policy changes, she told Australian Broker.

“Following this roadshow, we’ve seen an increase in applications through the broker channel since November. This is now flowing through to higher volumes of new loans being settled in the first few months of 2017.”

CUA has also trialled a program to speed up the ‘time to yes’ for applications submitted through the broker channel, she said.

Furthermore, the credit union has also been progressively rolling out its new home loan origination platform to all CUE lenders and branches nationally since July.

“[This platform] is yet to be made available to the broker channel – this phase of the rollout is scheduled for early 2018, which will deliver a more streamlined, digital process for borrowers.”

Yellow Brick Road Turns A Profit

Yellow Brick Road says their H1 FY2017 result has delivered a maiden profit as a result of a focused and disciplined business approach and back to basics cost control.

Net profit after tax is $0.4m, a $4.5m improvement on H1 FY2016 (loss of $4.1m). The Company’s Underlying EBITDA (which excludes non-operating costs) was $3.1m, a $5.1m improvement on H1 FY2016 (loss of $2.0m).

The Wealth business gained strong momentum with revenue growth of 25%, including a 29% improvement in recurring revenues. Recurring revenue growth was derived from a 28% increase in underlying Funds Under Management (FUM) and a 20% increase in Premiums Under Management (PUM) since 30 June 2016.

The Lending business continues to perform strongly. Apart from an anticipated drop in settlement volumes from Vow Flat Fee lending (which is low margin and had minimal impact on the bottom line), all lending distribution channels – including other Vow lending – exceeded market growth.

A highlight was the YBR network’s 20% settlement growth. The drawn value of the Company’s underlying loan book grew 11% to $41b (30 June 2016: $37b) and the embedded value of the underlying loan book, capitalized on the Company’s balance sheet, grew 6% to $46.1m (30 June 2016: $43.3m). This strong performance has been achieved despite a tightening regulatory framework and with restrictions on offshore borrowers constraining market growth.

Central to this outcome has been a focus on delivering results that are sustainable so that the momentum and business efficiencies achieved benefit our shareholders’ long-term value. H1 2017 has also been a period of transition for the Company, with three new General Managers responsible for Yellow Brick Road Lending, Yellow Brick Road Wealth Management and Vow Financial appointed.

We have undertaken a managed reduction in operating overheads. The business is now operating with a sustainable, scalable cost base. The current level of overheads support an infrastructure that provides scalability to meet future business growth under a more efficient operating cost framework.

In H1 FY2017, high margin, scale income declined slightly. Scale income includes high margin revenue from white label (Vow or YBR branded) loans. White label settlement penetration of the Vow and YBR networks was less than anticipated. In response, to gain greater control and flexibility of our white label value proposition, and increase penetration, we have created a centralised group lending function to consolidate the capabilities and offerings of recent business acquisitions, Resi (August 2014) and Loan Avenue (May 2016) under common management. Importantly this provides us with:

  • The capability to source white label loans from a variety of funders on high margin and high profit share terms
  • Added flexibility to funnel business between funders to enhance the attractiveness of the Company’s branded products
  • An experienced channel team to match the right loan applications with the right lenders, which will increase conversion rates

ANZ Trading Update – NIM Under Pressure

ANZ released their trading update for 3 months to 31 December 2016. Whilst the information is selective, and unaudited, we see growth in home lending supporting retail banking, along with deposit growth, but group net interest margin “declined several basis points” (not specified) and capital ratios down a little.  Cost management was a highlight. Disposal of “non-core” assets will help the result.  The credit environment is marginally better than expected, they say.

The unaudited results show a statutory net profit of $1.6 billion up 8% compared to the quarterly average of the second half of FY16. Cash Profit was $2.0 billion up 31% (Adjusted Proforma up 20%) benefited from a good performance in Australia and New Zealand Retail and in Institutional along with a lower provision charge and the sale of 100 Queen Street.

Profit before Provisions was up 17% (Adjusted Proforma up 9%). Revenue was up 7% (Adjusted Proforma up 4%), expenses down 4% (Adjusted Proforma down 1%) driven by current and prior period productivity initiatives and tight cost management. Total risk weighted assets (RWAs) rose from $409 bn in Sept 16 to $412 bn in Dec 16.

However Group Net Interest Margin (NIM) declined several basis points (bps) reflecting lower earnings on capital and higher funding costs driven by improving liability mix from strong deposit growth.

In Australia, home lending volumes grew, whilst commercial lending volumes were more subdued. Deposit growth was strong.

Institutional banking benefited from favourable trading conditions on the back of movements in the USD and yield curve.

Gross Impaired Assets increased 1.8%.

The Total Provision charge was $283 million with the Individual Provision (IP) charge $325 million. A Collective Provision release of $42 million was assisted by portfolio composition improvement and exposures transferring to IP. There were no changes to management overlays.

APRA Common Equity Tier 1 (CET1) ratio was 9.5% at 31 December, compared with 9.7% in June 16. Excluding the payment of the 2016 Final Dividend (net of the Dividend Reinvestment Plan), CET1 increased 40 bps in the first quarter, primarily driven by organic capital generation of 48 bps which is substantially stronger than the Post Basel III 1Q average of 21 bps.

There was no capital benefit from asset disposals in the quarter.

Strong deposit growth and solid progress with the Group’s term wholesale funding plan has contributed to a further improvement in the Group’s liquidity and funding position. The Group’s average Liquidity Coverage Ratio (LCR) for the quarter was 137% (proforma 132% if adjusted for the $6.5 billion reduction in the Committed Liquidity Facility effective January 2017). ANZ’s Net Stable Funding Ratio (NSFR) is estimated to be in excess of 108%.

The Basel III leverage ratio is 5.1%.

Since the start of FY2017, ANZ has signed agreements to sell its 20% stake in Shanghai Rural Commercial Bank (SRCB), the UDC Finance business in New Zealand and ANZ’s Retail and Wealth businesses in five Asian countries. The transactions are expected to complete in the second half of FY2017 and 1H2018 subject to regulatory approvals. For the purposes of comparison, if the earnings from the businesses being sold were to be excluded from Cash Profit performance for 1Q17 it would show an increase of 33% (+31% including).

In FY2016 a number of actions were classified as Specified Items which formed part of the Group’s Cash Profit. This classification assisted investors and analysts to look through the impact of strategic initiatives to determine underlying business performance trends and included the disposal of Esanda, restructuring charges, a write down of the valuation for the investment in AmBank, and accounting methodology changes. In 2017 the classification of Specified Items will be limited to the impact of disposals.

These transactions outlined above will boost ANZ’s APRA CET1 position by ~$2.7 billion or ~70bps upon completion further improving ANZ’s capital flexibility.

Here is ANZ CEO Shayne Elliott speaking to BlueNotes on video after the announcement.


CBA 1H Results Strong … But

Commonwealth Bank of Australia announced its results for the half year ended 31 December 2016 today. CBA is well run, so they are a bellwether of the broader financial sector.  It was a solid result with asset growth, 3% lift in underlying income and good cost management, but shows the pressure created by regulatory capital uplifts, competition in home lending and consumer deposits, and arrears in mining exposed areas. They continue to make strong progress in digital banking, where they are a leader.  They do not believe there is evidence for a housing bubble. Wealth and Insurance in under some pressure, so retail banking is taking the load, thus system credit growth is critical.

They also announced further interest only investment mortgage rate price hikes which will lift NIM.

CBA reported a statutory net profit after tax (NPAT) of $4,895 million, which represents a 6 per cent increase on 1H16 period. This includes a $397 million gain on sale of the Group’s remaining investment in Visa Inc. and a $393 million one-off expense for acceleration of amortisation on certain software assets.

Cash NPAT was $4,907 million, an increase of 2 per cent on the prior comparative period.

Return on equity (cash basis) was 16 per cent.

Strikingly though the net interest margin was down 4 basis points to 2.11%, or 2.08% excluding treasury, down 5 basis points. This was expected.

The key drivers were:

  • Asset pricing: Increased margin of three basis points, reflecting the impact of home loan repricing, partly offset by the impact of competition on home and business lending.
  • Funding costs: Decreased margin of five basis points, reflecting an increase in deposit costs of three basis points due to the lower cash rate and increased competition, and an increase in wholesale funding costs.
  • Portfolio mix: Decreased margin of one basis point reflecting an unfavourable change in lending mix from proportionally higher levels of home lending.
  • Capital and Other: Decreased margin of two basis points driven by the impact of the falling cash rate environment on free equity funding, and a lower contribution from New Zealand.
  • Treasury and Markets: Increased margin of two basis points driven by a higher contribution from Treasury.

Average interest earning assets increased $23 billion on the prior half to $823 billion, driven by:

  • Home loan average balances increased $16 billion or 4% on the prior half, primarily driven by growth in the domestic banking business;
  • Average balances for business and corporate lending increased $5 billion or 3% on the prior half, driven by growth in business banking lending balances; and
  • Average non-lending interest earning assets increased $2 billion or 1% on the prior half.

Customer deposits accounted for 66% of total funding at 31 December 2016. Of the remaining, Short-term wholesale funding accounted for 42% of total wholesale funding at 31 December 2016. During the half, the Group raised $22 billion of long-term wholesale funding. The cost of new long-term funding improved marginally on the prior half as markets shrugged off any potential negative sentiment associated with the US
Presidential election result, a 25 basis points Federal Reserve rate rise, higher global bond yields, and Brexit.

Loan impairment expense increased 6% on the prior comparative period to $599 million. The increase was driven by:

  • An increase in Retail Banking Services as a result of higher home loan and personal loan losses, predominantly in Western Australia;
  • Lower home loan provision releases and higher growth in New Zealand lending portfolios;
  • An increase in Bankwest due to slower run-off of the troublesome book, reduced write-backs and higher home loan losses, predominantly in Western Australia; and
  • An increase in IFS as a result of losses in the PT Bank Commonwealth (PTBC) commercial lending portfolio; partly offset by
  • Lower individual provisions in Business and Private
    Banking; and
  • A reduction in Institutional Banking and Markets due to lower collective provisions and a higher level of writebacks.

Provisioning levels remain prudent and there has been no change to the economic overlay. Retail arrears across all products reduced during the current half reflecting seasonal trends.

Home loan arrears reduced over the prior half, with 30+ days arrears decreasing from 1.21% to 1.12%, and 90+ days arrears reducing from 0.54% to 0.53%. Unsecured retail arrears improved over the half with credit card 30+ days arrears falling from 2.41% to 2.28%, and 90+ days arrears reducing from 0.99% to 0.88%. Personal loan arrears also improved with 30+ days arrears falling from 3.46% to 3.14% and 90+ days arrears falling from 1.46% to 1.28%. However personal loan arrears continue to be elevated driven primarily by Western Australia and
Queensland.

As at 31 December 2016, the Basel III Common Equity Tier 1 (CET1) ratio was 15.4% on an internationally comparable basis and 9.9% on an APRA basis.

The Group’s CET1 (APRA) ratio decreased 70 basis points for the half year ended 31 December 2016. After allowing for the implementation of the APRA requirement to hold additional capital of 80 basis points with respect to Australian residential mortgages, effective from 1 July 2016, the
underlying increase in the Group’s CET1 (APRA) ratio was 10 basis points on the prior half.

The Group’s leverage ratio, defined as Tier 1 Capital as a percentage of total exposures, was 4.9% at 31 December 2016 on an APRA basis and 5.5% on an internationally comparable basis.

There was a small decline in the ratio across the December 2016 half year with growth in exposures partly offset by an increase in capital levels.

The BCBS has advised that the leverage ratio will migrate to a Pillar 1 minimum capital requirement of 3% from 1 January 2018. The BCBS will confirm the final calibration in 2017. LCR was 135% at 31 Dec 2016.

The Board determined an interim dividend of $1.99 per share, a 1 cent increase on the 2016 interim dividend.

Looking in more detail at the Australian home loan portfolio, the total book was worth $423 billion in December 16. They added $53 billion of loans in the past 6 months, with an value of $311,000 and at a serviceability buffer of 2.25%. 89% were variable rate loans. 37% were investor loans (up from 33% in the prior 6 months) and 43% originated via brokers, down from 46% in June 16, reflecting a 13% rise in branch application. 40% were interest only loans, up from 38% in the previous period.

They said 77% of customers are paying in advance by 35 months on average, but this includes offset facilities. Mortgage offset balances were up 19% in 1H17 to $36 billion.

In terms of underwriting criteria they use the following parameters:

  • Higher of customer rate plus 2.25% or minimum floor rate (RBS: 7.25% pa, Bankwest: 7.35% pa)
  • 80% cap on less certain income sources (e.g. rent, bonuses etc.)
  • Maximum LVR of 95% for all loans (For Bankwest, maximum LVR excludes any capitalised mortgage insurance.)
  • Lenders’ Mortgage Insurance (LMI) for higher risk loans, including high LVR loans
  • Limits on investor income allowances e.g. RBS restrict the use of negative gearing where LVR>90%
  • Buffer applied to existing mortgage repayments
  • Interest only loans assessed on principal and interest basis

Mortgage arrears (90 day+) are highest in WA, at 1% thanks to the mining downturn. WA mining towns are 1% of portfolio.  Portfolio is running at 0.53%.

Investment mortgage arrears are running at a lower default rate, despite differential pricing, with a skew towards higher income households.

CBA says housing fundamentals suggest slower growth ahead:

  • Population growth has slowed as net migration eased. The slowing is concentrated in WA and Qld. Growth in NSW and Vic remains robust
  • Housing supply is now running ahead of housing demand, any backlog has now been met.
  • The record residential construction boom has lifted employment and related parts of retail like hardware, furnishings and white goods. But leading indicators have peaked.

They say they are serious on the 10% benchmark for investor loans and  have not exceeded the APRA speed limit.

They say households would be vulnerable to a fall in asset values and/or a rise in interest rates and unemployment though low interest rates have allowed some pre-payments and net worth has improved thanks to household asset growth.

They says the typical housing bubble factors not evident in Australia:


CBA Lifts Investor Interest Only Mortgage Rates

Today the CBA has announced changes to some mortgage rates: interest only home loan rates for investors will rise by 12 basis points and Viridian Line of Credit (VLOC) products will increase by 4 basis points. The new interest only standard variable rate for investors will be 5.68% per annum, VLOC will move to 5.82% per annum.

These changes will be effective from 3 April. For customers who may want to switch to principal and interest repayments to avoid this increase, they can do so easily – online, over the phone or in branch – at no cost.

CBA supported 140,000 new home loans in the six months ended December 2016 and our standard variable rate (SVR) for owner occupiers of 5.22% per annum remains the lowest among the major banks.

They just released their 1H17 results, which show a statutory net profit after tax (NPAT) of $4,895 million, which represents a 6 per cent increase on 1H16 period. Cash NPAT was $4,907 million, an increase of 2 per cent on the prior comparative period. Return on equity (cash basis) was 16 per cent.

Strikingly though the net interest margin was down 4 basis points to 2.11%, or 2.08% excluding treasury, down 5 basis points.

We will provide more detailed commentary later.