Mortgage Stress Top Postcode Countdown

Today we walk through the worst postcodes for mortgage stress and add movement and colour with supporting demographic and financial data.

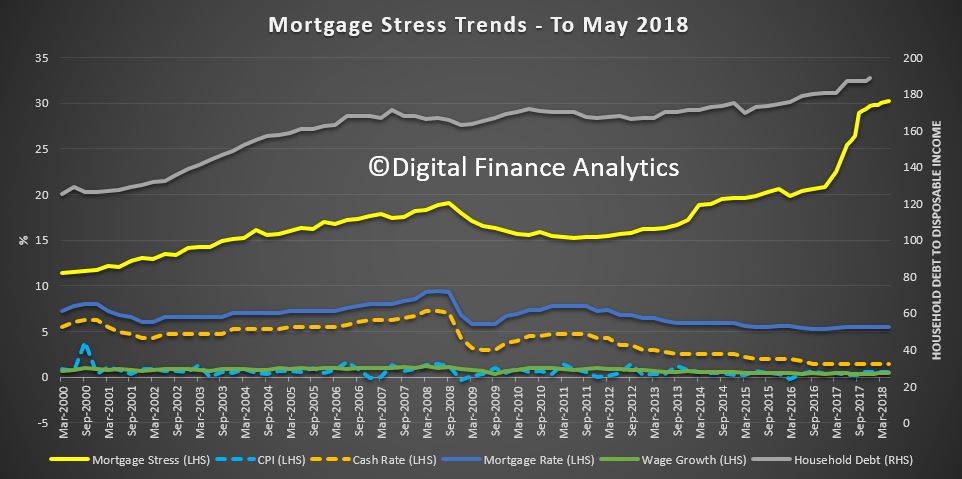
Yesterday we released the May 2018 mortgage stress and default analysis update. Across Australia, more than 966,000 households are estimated to be now in mortgage stress (last month 963,000). This equates to 30.2% of owner occupied borrowing households.

Our analysis uses the DFA core market model which combines information from our 52,000 household surveys, public data from the RBA, ABS and APRA; and private data from lenders and aggregators. Households are defined as “stressed” when net income (or cash flow) does not cover ongoing costs. Probability of default extends our mortgage stress analysis by overlaying economic indicators such as employment, future wage growth and cpi changes.  Our Core Market Model also examines the potential of portfolio risk of loss in basis point and value terms.

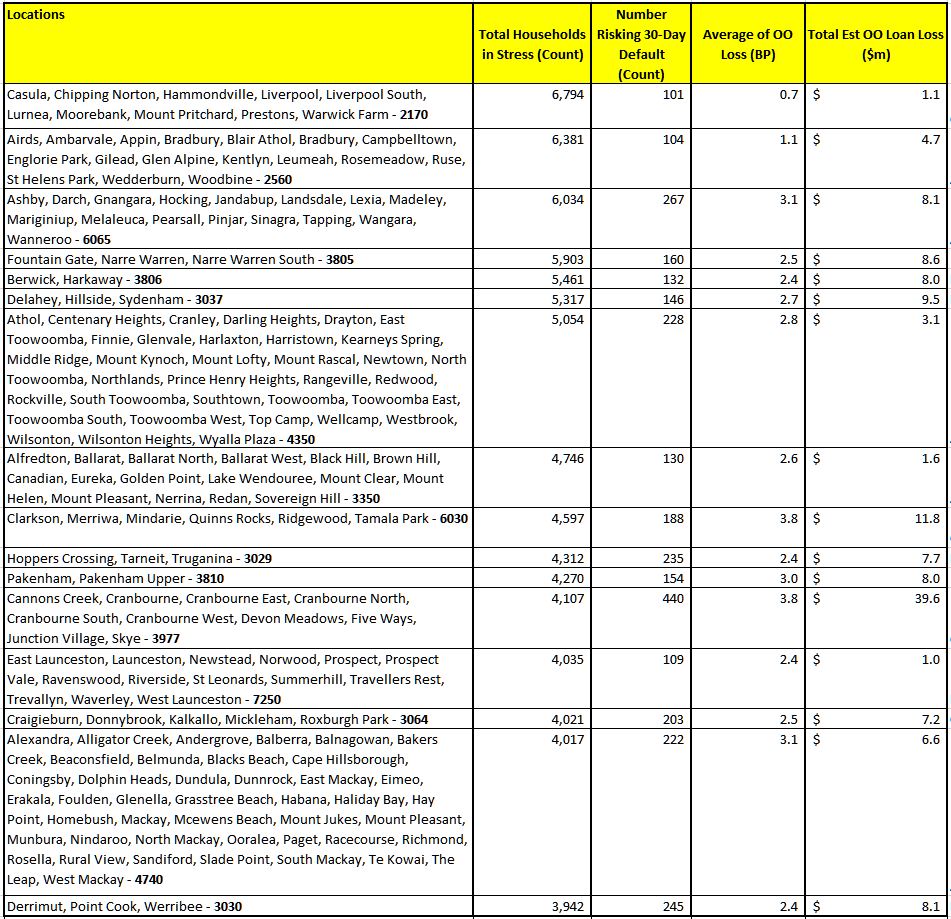
So now we are going to look in more detail, at the most stressed post codes across the country, by counting down to the most stressed area in the country. In each case we will dive into the vital statistics for each location, including population, income mortgage and loan to income ratios, as well as the number of households in stress.

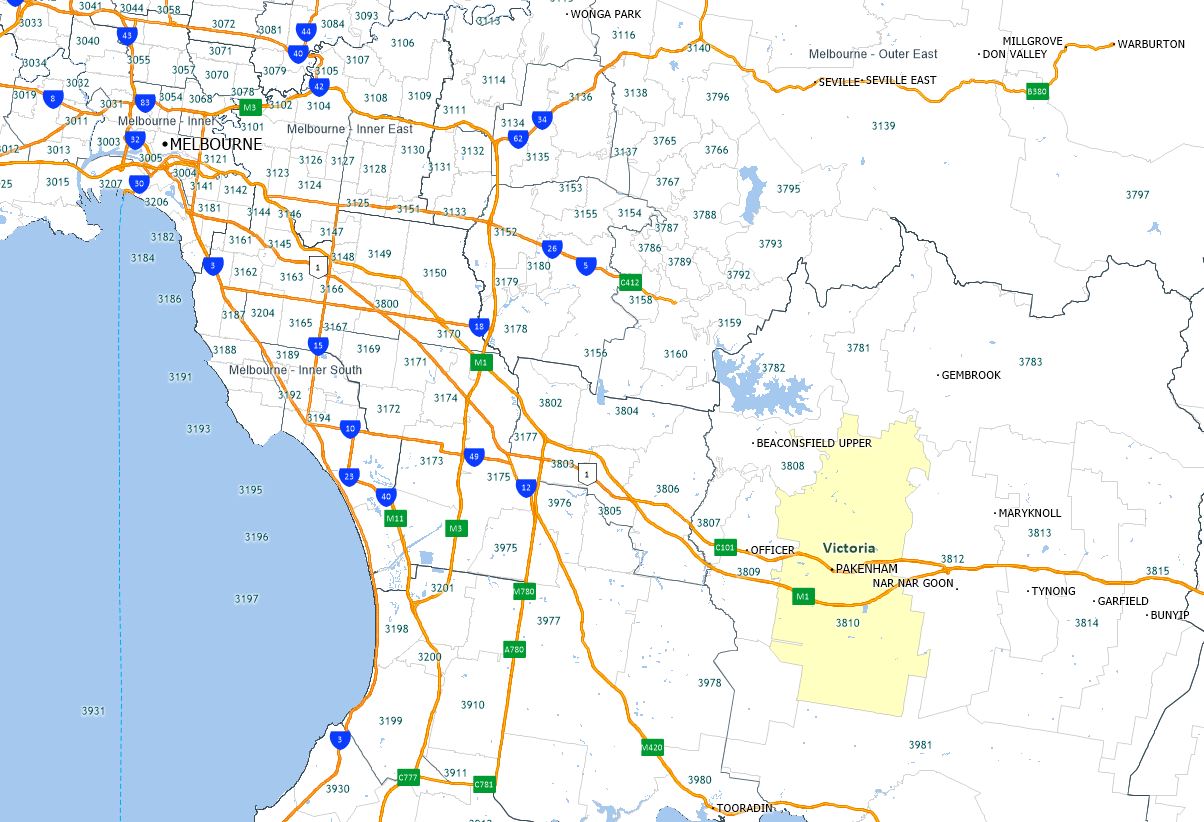
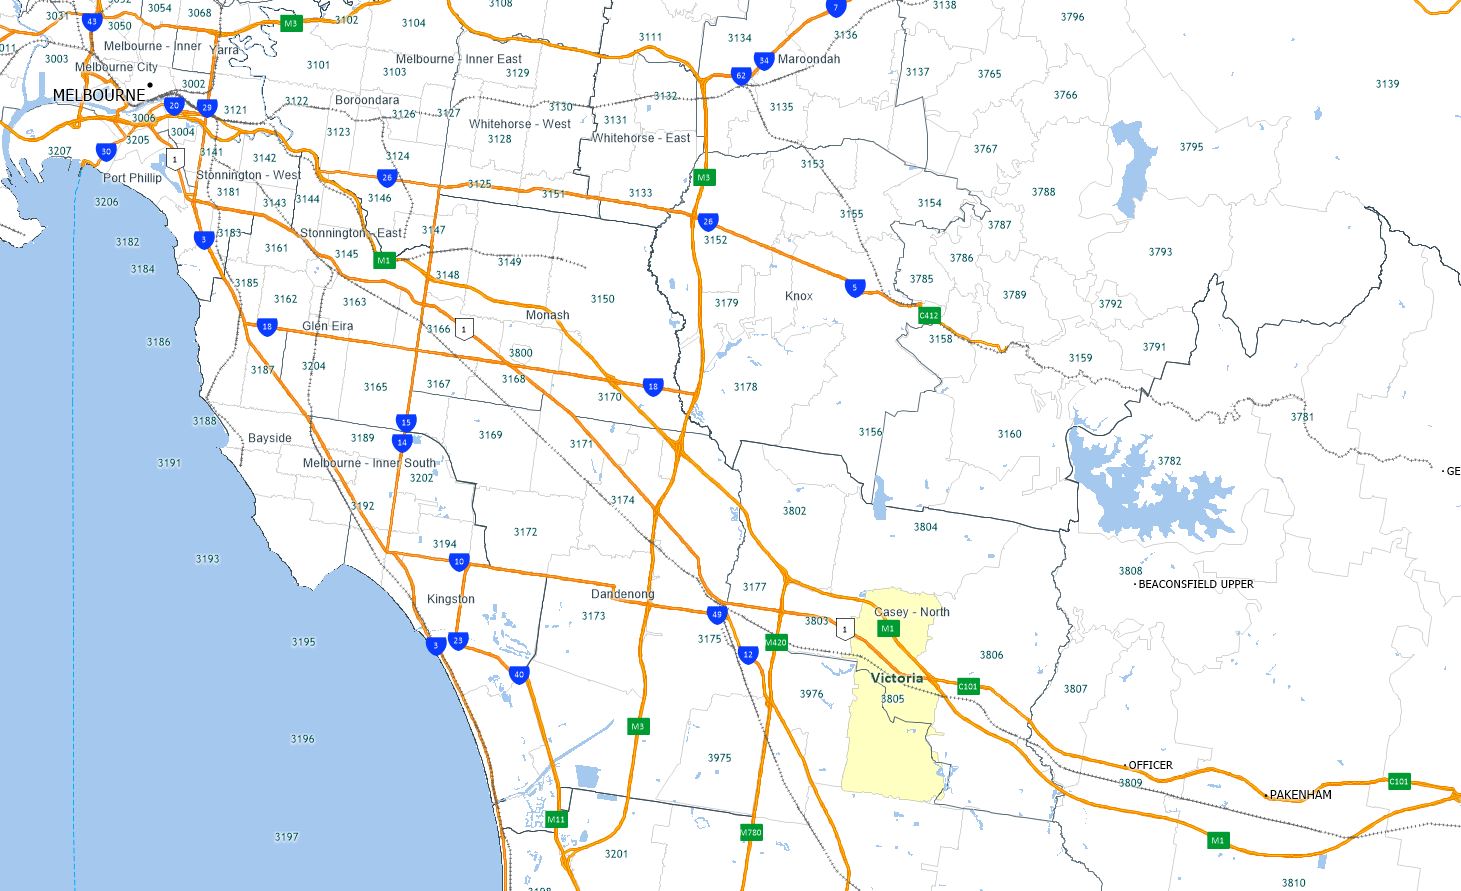
Just outside the top 10 is Victorian post code, 3810, Packenham, with around 4,310 households now in mortgage stress. It is some 54 kms south east of Melbourne. The average home price is around $502,000 compared with $290,000 in 2010. According to the latest census the average age is 32 years and there are more than 12,600 families in the district. The average monthly household income is $5,900, which is below the average in the state as well as nationally. 46% of homes have a mortgage, compared with the Victorian average of 35%. The average monthly mortgage repayment is $1,700, or more than 28% of their average incomes.  But 11% are paying more than 30% of their income each month to service their mortgages.

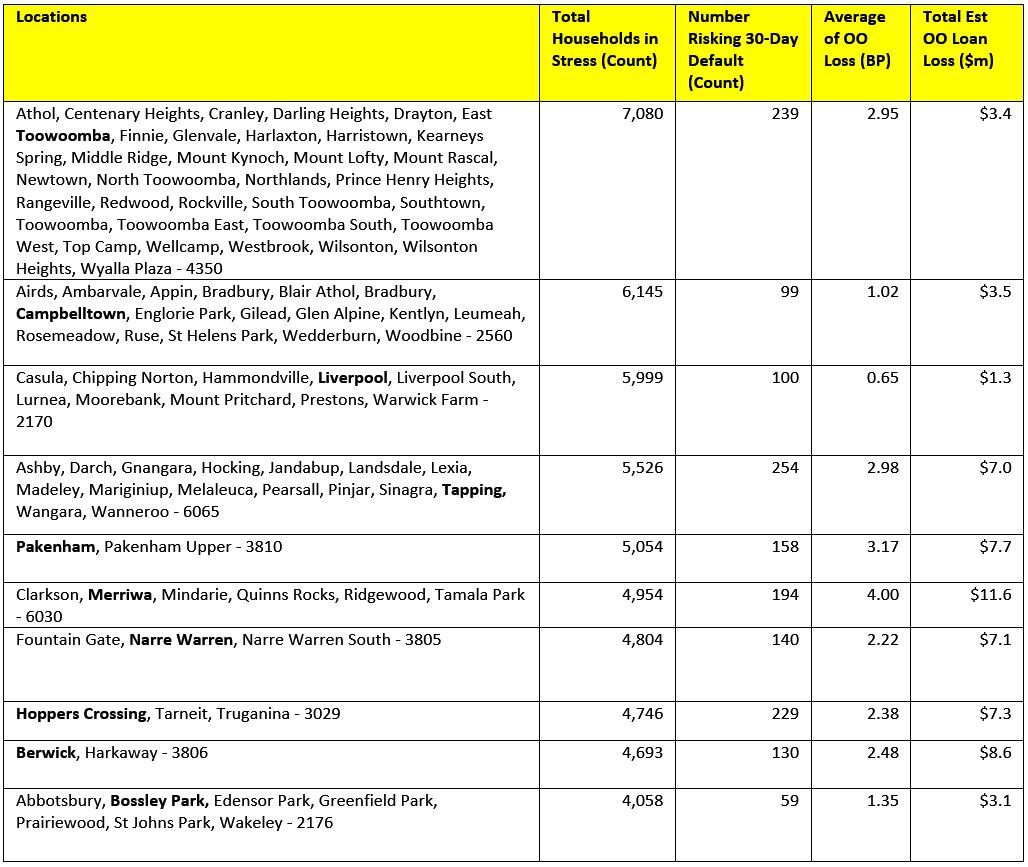
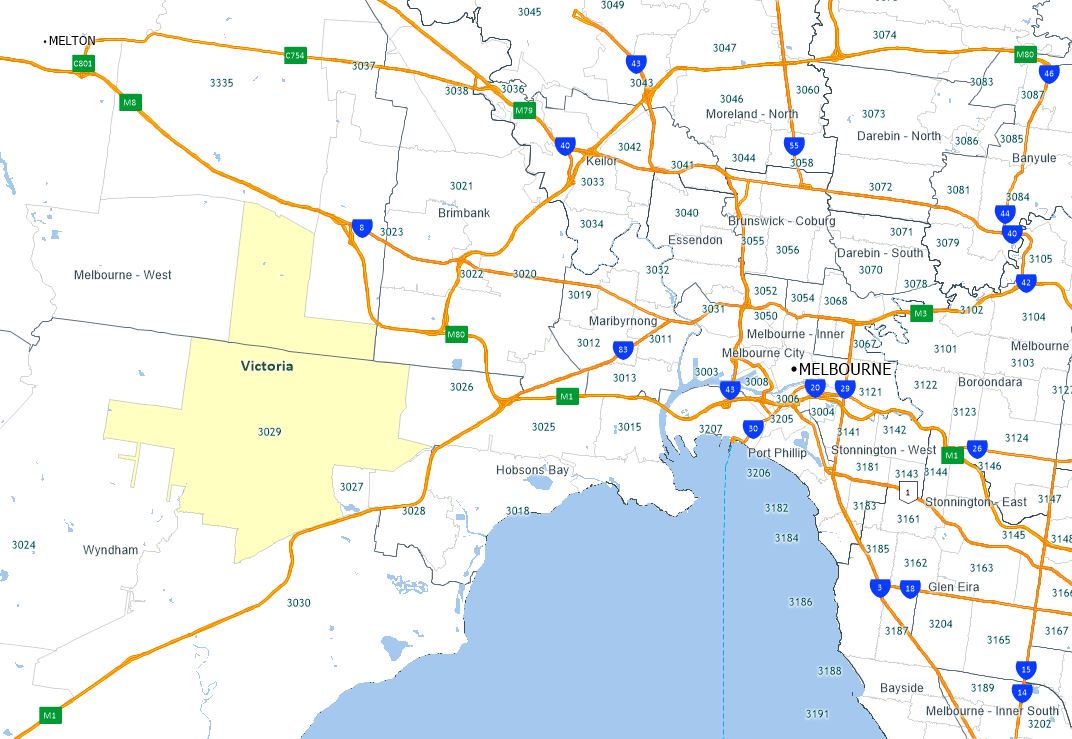
In tenth place is 3029, another Victorian postcode which includes Hoopers Crossing and Tarneit, around 25 kms from Melbourne CBD. There are about 24,600 households in the district, and the average household income is $6,840 a month. The average mortgage repayment is $1,730 or around 26% of the monthly budget although 12.5% are paying more than 30% of their income on repayments.  More than 80% of the dwellings are separate houses and a further 15% are townhouses. Nearly 51% of all properties in the area are mortgaged compared with the VIC average of 35%. The average home price is currently around $545,000 for a house and $378,500 for a unit, compared with $462,000 and $330,000 a year ago.

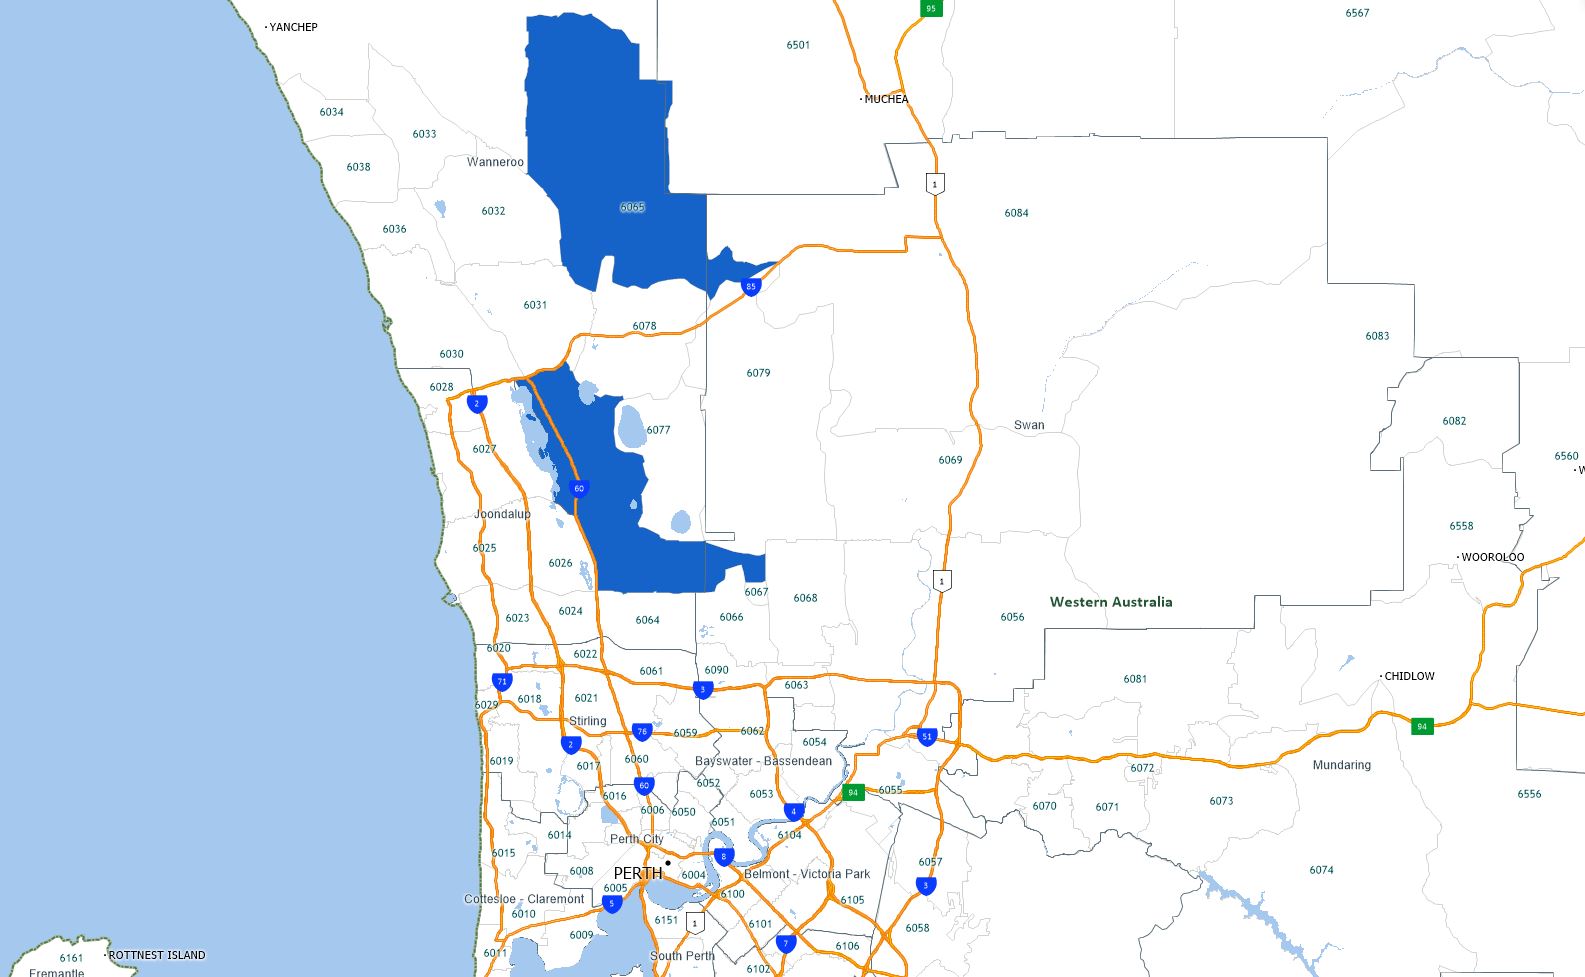
Next we go to WA, 6030 which includes Clarkson, Merriawa and Tamala Park, 34 kms north of Perth. There are 4,597 households in mortgage stress in the area, which is home for around 11,000 households.  The average age is 34 years. 86% of the properties here are separate houses, and 14% town houses. 51% of the properties are mortgaged, well above the WA average of 40%. The average income each month is   and the average mortgage repayment is 2,000.  The average proportion of income going on the mortgage is more than 28% but more than 12% have repayments requiring more than 30% of income.

Next in eighth place is yet another Victorian post code 3350, which includes Ballarat and the surrounding area, It’s about 100 kilometres from Melbourne. In this region there are 4,746 households in mortgage stress. The average property value is $315,000, compared with $281,000 in 2010. There are more than 14,500 families in the area and the average age is 37, line ball with the average across the state. The average monthly income is $5,300, well below the national and state averages. Around 33% of households have a mortgage and the average repayment is $1,408 a month, with an average loan to income ratio of 26.5%, though 5% are above 30%.

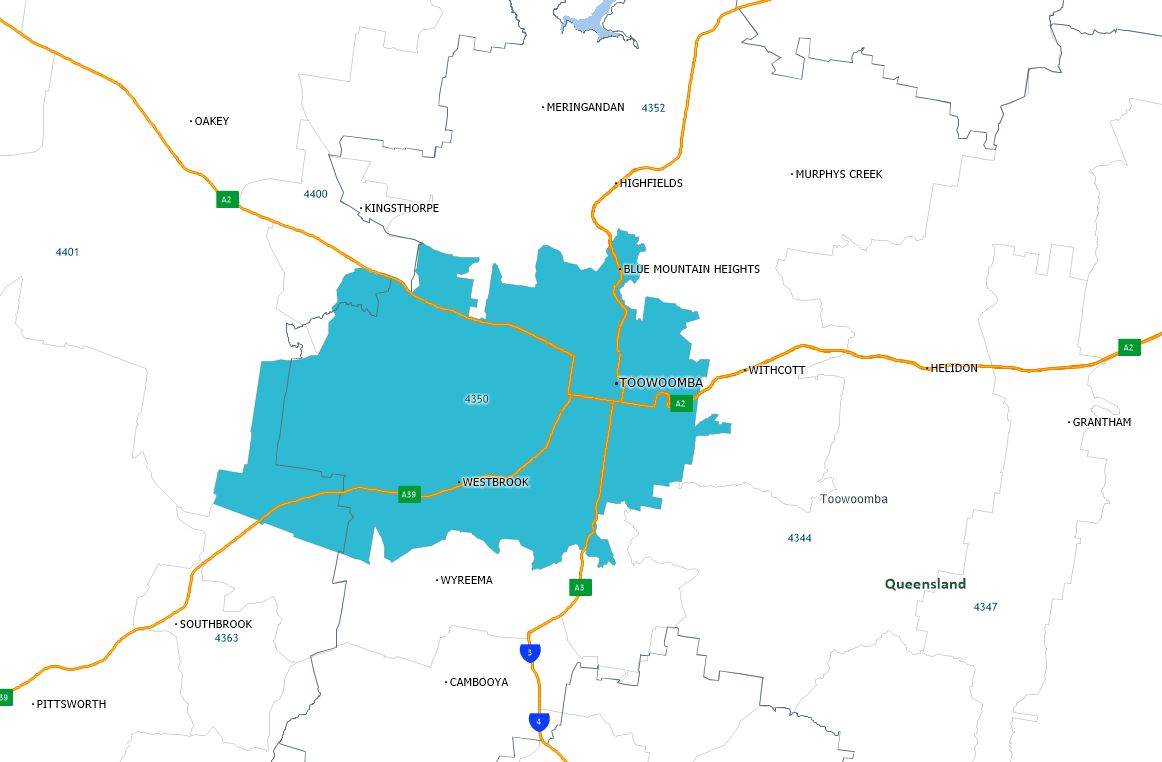
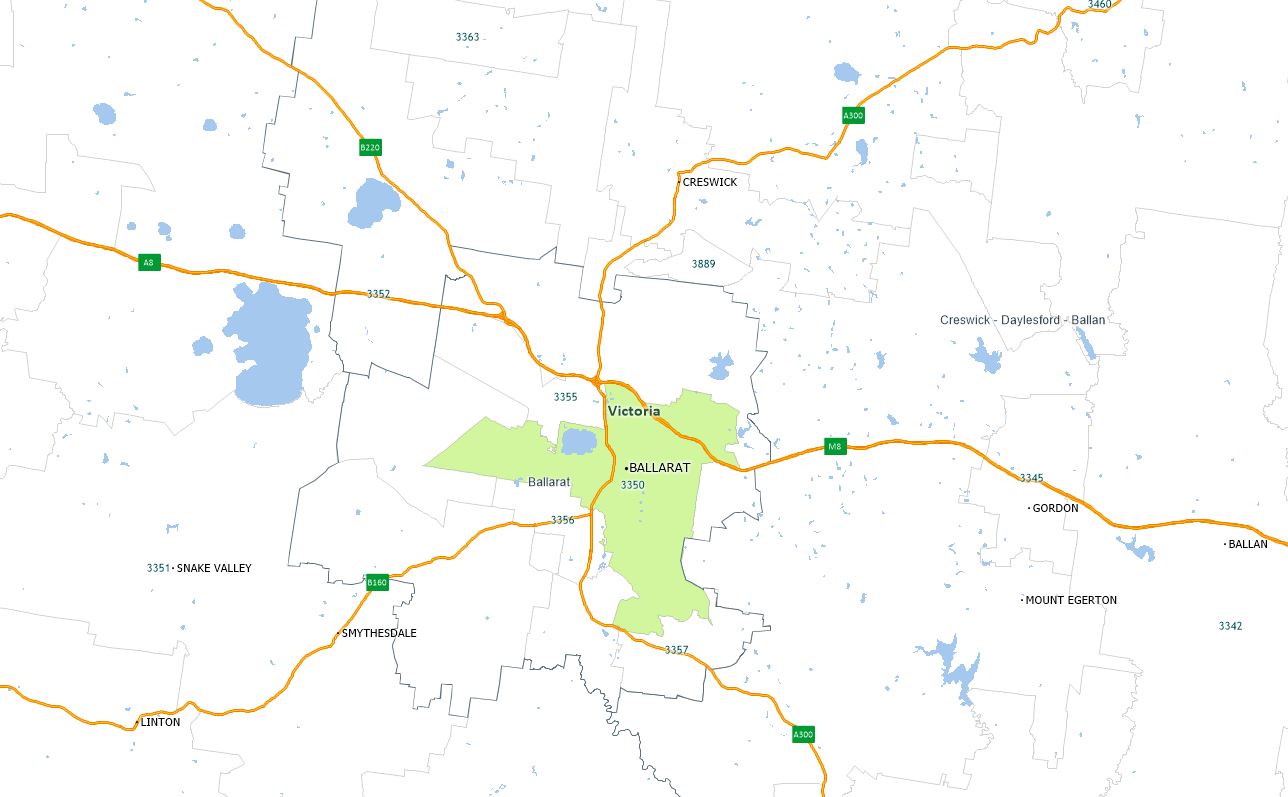
In Seventh place we go to Queensland 4350, around Drayton and Toowoomba, about 100 kilometres from Brisbane. There are about 27,000 households in the region and the average age is 37. 77% of the properties here are standalone houses, and a further 15% are townhouses. We estimate 5,054 households are in mortgage stress. The average home price is $470,000, compared with $382,000 in 2010. The average income is $5,300 a month. Around 30% have a mortgage and the average mortgage repayment is $1,510 giving an average loan to income of 25%. Just 4% have mortgage commitment above 30% of income.

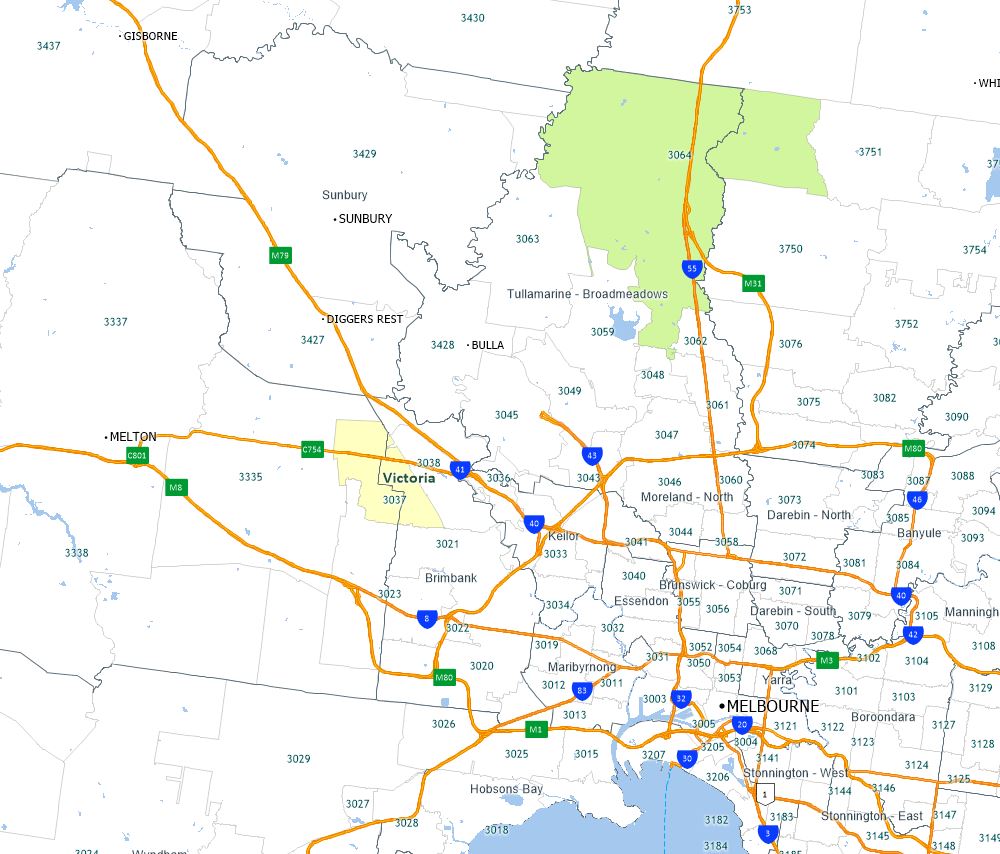
 Next, sixth is 3037, which includes areas around Delahey, Hillside and Sydenham; around 20 kms north west of Melbourne.  Here around 5,317 households are in mortgage stress. Of the 13,000 households in the district, more than half have a mortgage and the average age is 33. The average home price is around $570,000, up from $365,000 in 2010. 80% of properties are standalone houses and a further 18% are townhouses. The average monthly income is around $7,200 and the average mortgage repayment is $1,730, with an average loan to income of 24%. But 13% require more than 30% of their income to service their mortgage.

In fifth place is another Victorian suburb, 3806, Berwick and Harkaway which is around 40 kilometres south east of Melbourne, with 5,461 households in mortgage stress. The average home price is $700,000 compared with $451,000 in 2010. There are around 13,000 families in the area, with an average age of 36. 88% of the properties in the area are standalone houses. More than 47% of households here have a mortgage and the average repayment is $1,850 compared with the average income of $7,600 making the average loan to income about 24%. However, more than 9% are committed to pay more than 30% of their income each month.

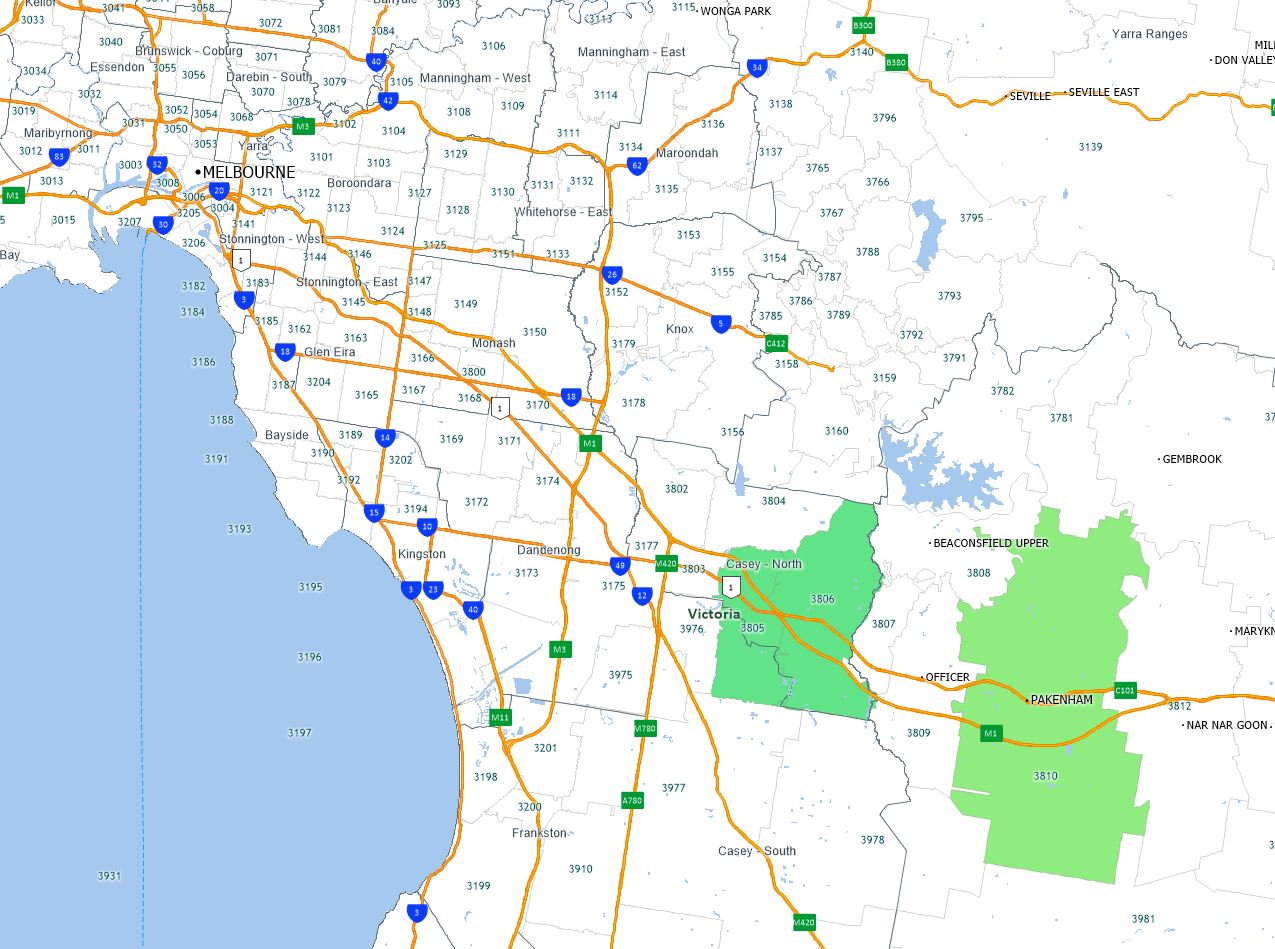
In fourth place we go back to VIC again, to 3805, which includes Narre Warren and Fountain Gate, This area is around 38 kilometres south east of Melbourne. Here 5,900 households are in mortgage stress. The average home price is $620,000 compared with $366,000 in 2010.  There are more than 15,000 families in the area, and the average age is 34 years. The average household income is just over $7,000 a month, which is higher than the national average. 54% of homes are mortgaged and the average monthly repayment is $1,700 slightly below the national average of $1,755. The average loan to income ratio is around 25%, but 12% are paying more than 30% of their income on the mortgage each month.

Coming third we cross the Nullarbor to WA to 6065. This is the area around Wanneroo, including Tapping, Hocking and Landsdale and is located about 25 kilometres north of Perth. It is an area of high population growth and residential construction mainly on smallish lots.  There are more than 6,340 households in mortgage stress in the region. The average home price is $420,000 compared with $529,000 in 2010, and down from a peak of $813,000 in 2014. There are about 17,000 households in the district, with an average age of 33. The average income is $8,300 a month, and 58% have a mortgage with average repayments of $2,170, well above the WA and national averages. The average loan to income ratio is around 26%, but more than 13% are paying over 30% of their incomes on the mortgage each month.

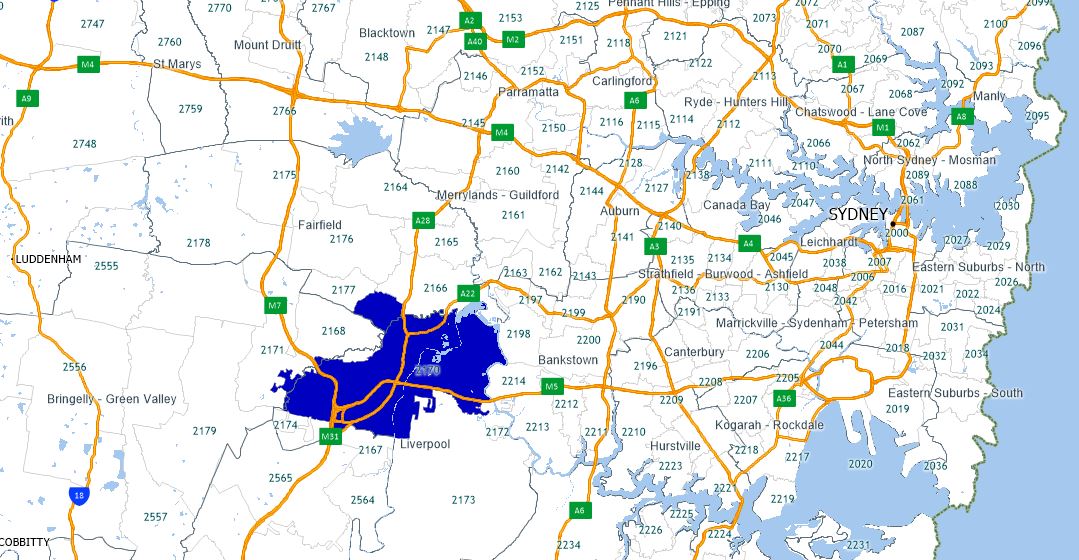
In second spot is the area around Campbelltown in NSW, 2560, which is around 43 kilometres inland from Sydney. Here 6,381 households are in mortgage stress. The average home price is $640,000, up from $320,000 in 2010. Around 20,000 households live in the area with an average age of 34 years. 80% of properties are standalone houses. The average income is $6,100 a month. 37% have a mortgage and the average repayment is higher than the national average at $1,800, or 29% of income. But 13% are paying more than 30% of their income on the mortgage.

So to the post code with the highest count of stressed households, is NSW post code 2170, the area around Liverpool, Warwick Farm and Chipping Norton, which is around 27 kilometres west of Sydney. There are around 27,000 families in the area, with an average age of 34. There are 6,974 households in mortgage stress here. The average home price is $805,000 compared with $385,000 in 2010. 64% of properties are standalone houses, while 22% are flats or apartments. The average income here is $5,950. 36% have a mortgage, which is above the NSW average of 32% and the average repayment is about $2,000 each month, so the average proportion of income paid on the mortgage is more than 33%.

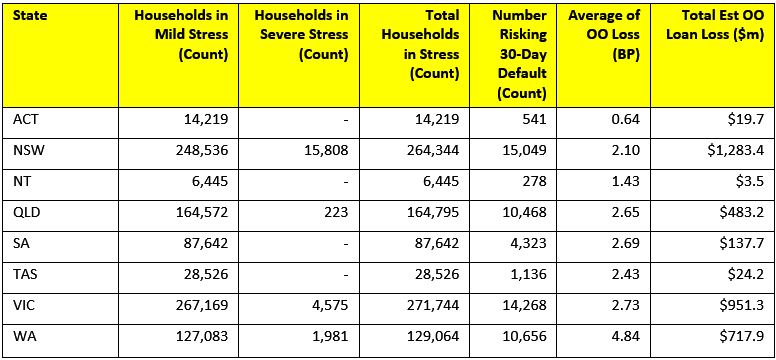
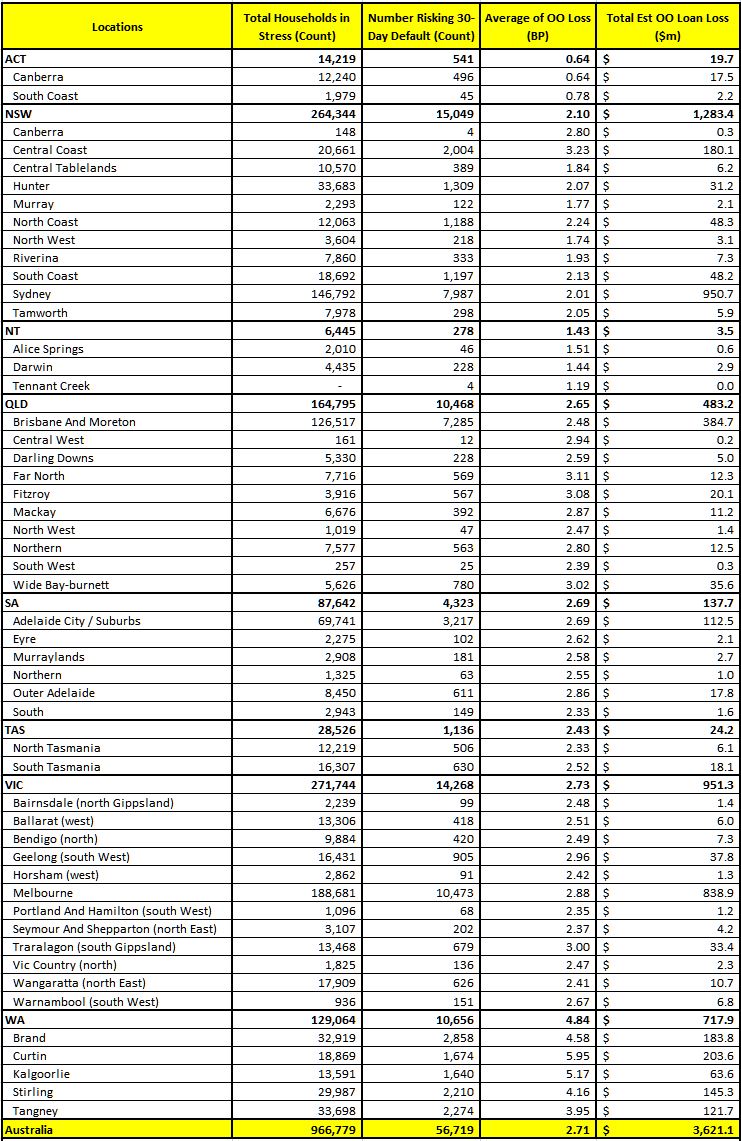
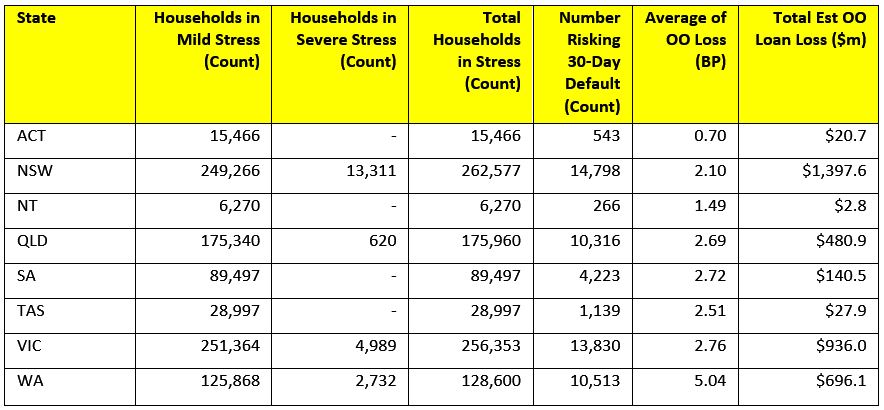
So it’s clear from this analysis that stress is residing among households who are relatively affluent, but highly leveraged, and include a number of newly built high-growth suburbs on the edges of our larger cities. Many are typified by high density standalone houses, or townhouses crammed into small plots. We are seeing a rotation of stress towards some of the Victorian post codes in recent months, but there are concerning rises in both NSW and VIC. However, WA remains the more immediate trouble spot, as can be demonstrated by the higher levels of default there – perhaps close to double the national average.

We will continue to monitor mortgage stress, and will update our core market model next at the end of the year.

As before, I think it is worth repeating that many households in stress do not have a robust household budget, and creating this is an important first step to getting to grips with stress. Whilst putting more on credit cards and refinancing may seem superficially attractive mitigation steps, our analysis shows that these are often only temporary fixes. Getting to grips with where the money is going is an important first step to tackling the problem. Remember too that banks have an obligation to assist in cases of hardship, so if households are in difficulty, they should talk to their lenders, rather than hoping things will work out. Given flat incomes and rising prices, this is unlikely.

Mortgage Stress Notched Up Again in May 2018

Digital Finance Analytics (DFA) has released the May 2018 mortgage stress and default analysis update. Across Australia, more than 966,000 households are estimated to be now in mortgage stress (last month 963,000). This equates to 30.2% of owner occupied borrowing households. In addition, more than 22,600 of these are in severe stress, up 1,000 from last month. We estimate that more than 56,700 households risk 30-day default in the next 12 months. We expect bank portfolio losses to be around 2.7 basis points, though losses in WA are higher at 5 basis points.  We continue to see the impact of flat wages growth, rising living costs and higher real mortgage rates.

Martin North, Principal of Digital Finance Analytics says “the pressure on households in a low income growth, high cost, highly leveraged environment means that overall, risks in the system continue to rise, and while recent strengthening of lending standards will help protect new borrowers, there are many households currently holding loans which would not now be approved. The recent Royal Commission laid bare some of the industry practices which help to explain why stress is so high. This is a significant sleeping problem and the risks in the system remain higher than many recognise”.

“We continue to see the number of households rising, and the quantum is now economically significant. Even now, household debt continues to climb to new record levels. Mortgage lending is still growing at two to three times income. This is not sustainable and we are expecting lending growth to continue to moderate in the months ahead as underwriting standards are tightened and home prices fall further”. The latest household debt to income ratio is now at a record 188.6.[1]

The forces which are lifting mortgage stress levels remain largely the same. In cash flow terms, we see households having to cope with rising living costs – notably child care, school fees and fuel – whilst real incomes continue to fall and underemployment remains high. Households have larger mortgages, thanks to the strong rise in home prices, especially in the main eastern state centres, and now prices are slipping. While mortgage interest rates remain quite low for owner occupied borrowers, those with interest only loans or investment loans have seen significant rises.  We expect some upward pressure on real mortgage rates in coming months as international funding pressures mount, a potential for local rate rises and margin pressure on the banks thanks to a higher Bank Bill Swap Rate (BBSW).  The potential for a 20-25 basis point hike by the banks is increasing, and this would lift the number of households in mortgage stress higher again.

Our analysis uses the DFA core market model which combines information from our 52,000 household surveys, public data from the RBA, ABS and APRA; and private data from lenders and aggregators. The data is current to end May 2018. We analyse household cash flow based on real incomes, outgoings and mortgage repayments, rather than using an arbitrary 30% of income.

Households are defined as “stressed” when net income (or cash flow) does not cover ongoing costs. They may or may not have access to other available assets, and some have paid ahead, but households in mild stress have little leeway in their cash flows, whereas those in severe stress are unable to meet repayments from current income. In both cases, households manage this deficit by cutting back on spending, putting more on credit cards and seeking to refinance, restructure or sell their home.  Those in severe stress are more likely to be seeking hardship assistance and are often forced to sell.

Probability of default extends our mortgage stress analysis by overlaying economic indicators such as employment, future wage growth and cpi changes.  Our Core Market Model also examines the potential of portfolio risk of loss in basis point and value terms. Losses are likely to be higher among more affluent households, contrary to the popular belief that affluent households are well protected.

Stress by The Numbers.

Regional analysis shows that NSW has 264,344 households in stress (262,577 last month), VIC 271,744 (256,353 last month), QLD 164,795 (175,960 last month) and WA has 129,064. The probability of default over the next 12 months rose, with around 10,656 in WA, around 10,468 in QLD, 14,268 in VIC and 15,049 in NSW.

The largest financial losses relating to bank write-offs reside in NSW ($1.3 billion) from Owner Occupied borrowers) and VIC ($951 million) from Owner Occupied Borrowers, which equates to 2.10 and 2.73 basis points respectively. Losses are likely to be highest in WA at 5 basis points, which equates to $718 million from Owner Occupied borrowers.

A fuller regional breakdown is set out below.

 Here are the top 20 postcodes sorted by number of households in mortgage stress.

 [1] RBA E2 Household Finances – Selected Ratios December 2017 (Revised 3rd April 2018).

You can request our media release. Note this will NOT automatically send you our research updates, for that register here.

[contact-form to=’mnorth@digitalfinanceanalytics.com’ subject=’Request The May 2018 Stress Release’][contact-field label=’Name’ type=’name’ required=’1’/][contact-field label=’Email’ type=’email’ required=’1’/][contact-field label=’Email Me The May 2018 Media Release’ type=’radio’ required=’1′ options=’Yes Please’/][contact-field label=”Comment If You Like” type=”textarea”/][/contact-form]

Note that the detailed results from our surveys and analysis are made available to our paying clients.

Families in Financial Distress Are More Likely to Stay in Distress

According to the  latest from The St.Louis Fed On The Economy Blog, individuals who were in financial distress five years ago were about twice as likely to be in financial distress today when compared with an average individual.

Many households have experienced financial distress at least one time in their life. In these situations, households miss payments for different reasons (unemployment, sickness, etc.) and eventually file bankruptcy to discharge those obligations.

In a recent working paper, I (Juan) and my co-authors Kartik Athreya and José Mustre-del-Río argued that financial distress is not only quite widespread but is also very persistent. Using Federal Reserve Bank of New York Consumer Credit Panel/Equifax data, we reported that individuals who were in financial distress five years ago were about twice as likely to be in financial distress today when compared with an average individual.1

Consumer Bankruptcy

In this post, we focus our attention on a very extreme form of financial distress: consumer bankruptcy. We obtained financial distress data from the Survey of Consumer Finances (SCF), conducted by the Board of Governors. The data span from 1998 to 2016 with triennial frequency, and the respondents who are younger than 25 or older than 65 have been trimmed.2

We first measured the share of households that had previously experienced an episode of financial distress by looking at people who filed for bankruptcy five or more years ago.3 The figure below shows that the share of households with past financial distress increased from approximately 6.6 percent in 1998 to 12.2 percent in 2016.


past distress


We then measured current financial distress by computing the share of households that delayed their loan payment on the year the survey was conducted.4 (We recognize that this measure is less extreme, as only a share of households that are late making payments will end up in bankruptcy.)5

The figure below shows that while there are minor fluctuations in the share of households with late payments throughout the sample period, the numbers remained around 8 percent.

current distress


Finally, we created a ratio to measure the persistence of financial distress. It compares the share of households with late payments among households that declared bankruptcy five or more years ago to the share of households with late payments the year the SCF was conducted.

If financial distress was not persistent at all, both shares would be equal, and the ratio would be one. Thus, a value greater than one indicates the persistence of financial distress. The figure below shows the evolution of the persistence of financial distress over the years.

distress persistance

The ratio fluctuates around 1.5, implying that the households that have encountered an episode of financial distress in the past are 1.5 times more likely to delay payment today, compared to average households.

2 in 5 Aussies do not understand LMI

More than two in five prospective home buyers have admitted to not understanding Lenders Mortgage Insurance (LMI), according to new data.

This chimes with our research on the topic of LMI from our own surveys. In fact the confusion varies by type of buyer, and who is protected.  First Time Buyers are a particular concern. See our previous post “Is Lenders Mortgage Insurance a Good Thing“.

Mortgage Choice and CoreData’s new Evolving Great Australian Dream 2018 whitepaper found 42.1% of respondents said they were not sure what LMI was, yet a third (32%) said they would need to pay it in order to get into the property market.

“Our data found that a majority of home buyers are in the dark when it comes to Lenders Mortgage Insurance and what it entails,” Mortgage Choice Chief Executive Officer Susan Mitchell said.

“According to our survey, only 32.1% of prospective buyers accurately stated that LMI is designed to protect the lender if a borrower can’t repay their mortgage.

“Another 8.2% of respondents thought LMI protected the borrower, while 17.6% believed it protected both the borrower and the lender,” said Ms Mitchell.

The research found that 44.8% of women did not to understand what LMI was, compared to 37.35% of men.

Buyers aged 29 and under (47.3%) were the most likely not to know what LMI was, while the 50 to 59 age group (40.75) had the highest proportion of buyers who knew what LMI was.

On a state by state comparison, Victoria (46%) had the highest proportion of buyers who did not know what LMI was, followed by Queensland (40%) and Western Australia (39.6%). NSW buyers topped the states when it came to correctly defining LMI at 34.6%.

Ms Mitchell said it was concerning that such a large proportion of Australians had either a limited or no understanding of LMI and that mortgage brokers can play an educational role for borrowers.

“For many first home buyers, LMI is likely to be a cost they have to pay to get into the property market, particularly if they do not have a deposit that is at least 20% of the purchase price,” she said.

“The reality is that saving for a home deposit is a major challenge for first home buyers and this has been the result of strong price growth over the last few years.

“According to CoreLogic, the median dwelling value in Australia is $554,605, and for a first home buyer to avoid LMI, they would need to save $110,921 for a 20% deposit and they would still need to have additional funds to cover costs such as legal fees and stamp duty.

“That is quite large sum to save and it only increases if a buyer is looking in cities such as Sydney and Melbourne.

“While LMI on the surface seems like a fee to be avoided, it does have the benefit of helping a buyer purchase a home with a smaller deposit, thereby allowing them to get onto the property ladder sooner rather than later.

“A buyer can choose to delay their property purchase to save a sufficient deposit, but the reality is property prices have risen consistently and the longer they delay, the more likely they are to miss an opportunity.

“Ultimately, in the long run, LMI is a fairly small expense in the overall cost of purchasing a home.”

Ms Mitchell said first home buyers could avoid LMI altogether if they were able to receive some sort of financial boost or a have a guarantor on their loan.

“First home buyers can avoid LMI by having a parent or family member go guarantor on their home loan, which then allows them to purchase without a 20% deposit” she said.

“In the case of the latter, it is important to note that lenders may require that any monetary gift must be held in an account for at least three months before home loan approval. Also, a lender may still require a borrower to demonstrate that they have 5% genuine savings.”

Ms Mitchell said it was important for first home buyers to have a good understanding of the purchase process.

“If you’re a first home buyer, you should speak to a mortgage broker who can guide you through the process of purchasing a property, from getting the best rate as part of the home loan application, through to settlement.

“They can explain the various options and costs involved, including LMI, thereby ensuring that you can confidently achieve your goal of home ownership,” concluded Ms Mitchell.

“As property prices continue to relax there has never been a better time for first home buyers to purchase. Therefore, it’s essential they have a clear understanding of LMI so that they know how it affects their ability to get into the market.”

Household Finance Confidence Slides Further In April

The latest edition of our Household Finance Confidence Index, to the end of April 2018, released today, shows that households remain concerned about their financial situation. This is consistent with rising levels of mortgage stress, as we reported recently.

The index fell to 91.7, down from 92.3 in March. This remains below the neutral 100 setting, and continues the decline since October 2016.

The largest falls were in the east coast states of NSW, VIC and QLD. There were small rises in SA and TAS, and WA continued to maintain its lower score.

Analysis by property segment showed that whilst property inactive households continue to languish, there were small falls among owner occupied property active households, who remain just above the neutral setting, while property investors tracked lower again, thanks to tighter lending conditions, the upcoming interest only repayment switch, and the drift down of property values, especially in Sydney.  Property owners still remain more confident relative to those renting.

Looking across the age bands, we see a consistent pattern of falling confidence, with younger households the least confident, driven by job availability, underemployment and flat wages, plus the fact that many do not believe they will ever be able to buy into the property market. Older households, who are more likely to be holding property, remain more confident, relatively speaking.

The index driver scorecard enables us to examine root causes of these shifts in confidence.  First for many households job security remains about the same at 61%, but there was a 1% fall in those who felt more confident, and a 1% rise in those feeling less confident. These movements are linked to job availability, and some seasonal factors as the tourist season winds down.

Turning to household incomes, more than half said their incomes had fallen in real terms, which was 1.4% higher than last month. Only a small number of households reported a real rise in incomes, whilst 44% reported no change. The long term trend of flat incomes is one of the key issues households are facing.

This is in stark contrast to the rising costs of living. 79% of households reported their costs had risen, up 1.4% compared with last month, 16% reported no change in costs, down 2.5%, and just 1.7% said their costs of living had fallen. Looking across categories, the costs of electricity, school fees, health care Costs and fuel all registered.

Turning to debt, we see a continued rise in those households concerned about their levels of debt. Just 3% are more comfortable than a year ago, 50% about the same, and 44% less comfortable.  Households referred to the changes in mortgage rates – with some higher costs still working though, and the problem some had in finding a  better loan to switch to as part of a refinancing transaction.  Interest only property investors were significantly more concerned than a month ago. In addition more households are putting costs on credit cards to manage their finances or accessed other forms of personal credit.

Looking at savings, 47% of households were less comfortable with the savings they hold – up 1% and many are raiding these savings to maintain their cash flows. The number who were more comfortable fell 1%, thanks to lower rates on many bank deposits. Those who were about the same – 50% – benefitted mainly from recent positive stock market movements.

So, finally, the proportion of households who see their net worth higher at 50% is down 2.5%, reflecting falls in Sydney  property prices, while 20% reported higher net worth, mainly thanks to property rises in SA and TAS, and positive stock market movements.

So to  conclude, we continue to see little on the horizon to suggest that household financial confidence will improve. Currently, wages growth will  remain contained, and home prices are likely to slide further, while costs of living pressures continue to grow.

Whilst banks have reduced their investor mortgage interest rates to attract new borrowers, we believe there will also be more pressure on mortgage interest rates as funding costs rise, and lower rates on deposits as banks trim these rates to protect their net margins. In the last reporting round, the banks were highlighting pressure on their margins as the back-book pricing benefit from last year ebbs away.

By way of background, these results are derived from our household surveys, averaged across Australia. We have 52,000 households in our sample at any one time. We include detailed questions covering various aspects of a household’s financial footprint. The index measures how households are feeling about their financial health. To calculate the index we ask questions which cover a number of different dimensions. We start by asking households how confident they are feeling about their job security, whether their real income has risen or fallen in the past year, their view on their costs of living over the same period, whether they have increased their loans and other outstanding debts including credit cards and whether they are saving more than last year. Finally we ask about their overall change in net worth over the past 12 months – by net worth we mean net assets less outstanding debts.

We will update the index next month.

Fixing The Banking System – The Property Imperative Weekly 5th May 2018

Welcome to our latest digest of finance and property news to 5th May 2018.

Read the transcript, or watch the video.

We continue to be bombarded with news of more issues in the banking sector. CBA admitted that they have “lost” customer data contained on two tapes relating to almost 20 million accounts. The event happened in 2016, and they decided not to inform customers, as the data “most likely” had been destroyed. This is likely the largest data breach for a bank in Australia and goes again to the question of trust. So much customer data in a single tape drive, and passed to a third party for destruction. But there was no record of the tape arriving, and the data has not been recovered. Angus Sullivan Head of Retail at CBA said, an investigation suggests the tape were destroyed, and they chose not to inform customers at the time, despite discussing with the regulators.

We think they had a duty of care to disclose this to customers at this time, but they chose not to, because they did not put customers first. Such rich transaction data would be very valuable to criminals. I have a CBA account, and I feel uncomfortable. Why should I trust them with my data?

And of course CBA featured in the report which was published this week following a review into their culture. We discussed this in detail in a separate video “CBA’s World of Pain and The Regulators’ Wet Lettuce response”. The report says CBA’s continued financial success dulled the institution’s senses to signals that might have otherwise alerted the Board and senior executives to a deterioration in CBA’s risk profile. APRA has applied a $1 billion add-in to CBA’s minimum capital requirement.

Over the past six months, the Panel examined the underlying reasons behind a series of incidents at CBA that have significantly damaged its reputation and public standing. It found there was a complex interplay of organisational and cultural factors at work, but that a common theme from the Panel’s analysis and review was that CBA’s continued financial success dulled the institution’s senses to signals that might have otherwise alerted the Board and senior executives to a deterioration in CBA’s risk profile. This dulling was particularly apparent in CBA’s management of non-financial risks, i.e. its operational, compliance and conduct risks. These risks were neither clearly understood nor owned, the frameworks for managing them were cumbersome and incomplete, and senior leadership was slow to recognise, and address, emerging threats to CBA’s reputation. The consequences of this slowness were not grasped. So CBA agreed to put a plan in place to address the issues raised, and circulated the report to their top 500 executives, and other banks and corporates should also read the report in detail. The core message is simple, a fixation on superior financial performance at all costs, can destroy the business and customer confidence. Oh, and APRA’s $1bn capital add-in is little more than a light slap to the face.

We got results this week from Macquarie Bank who managed to lift their profitability yet again, mainly thanks to significant growth in their Capital Markets Business, plus ANZ and NAB who both revealed pressures on margin and higher mortgage loan delinquencies. They are literally banking on home loans and warned that if funding costs continue to rise they will need to lift rates. NAB’s profit was down 16% on the prior comparable period. We discussed their mortgage delinquency trends as part of our video on Mortgage Stress “More On Mortgage Stress and Defaults”.  Both banks are seeking to reduce their exposure to the wealth management sector, and focus more on selling more mortgages. Interesting timing, given the Royal Commission, and tighter lending standards.

And Genworth, the Lenders Mortgage Insurer, who underwrites loans about 80% (or 70%) in some cases also reported higher losses again. The delinquency rate increased slightly from 0.48% in 1Q17 to 0.49% in 1Q18, driven mainly by Western Australia and New South Wales (NSW). Delinquencies in mining areas are showing signs of improving. In non-mining regions there are indications of a softening in cure rates, in particular in NSW and Western Australia.

Our own latest research showed that across Australia, more than 963,000 households are estimated to be now in mortgage stress (last month 956,000). This equates to 30.1% of owner occupied borrowing households. In addition, more than 21,600 of these are in severe stress, up 500 from last month. We estimate that more than 55,600 households risk 30-day default in the next 12 months. We expect bank portfolio losses to be around 2.8 basis points, though losses in WA are higher at 5 basis points.  We continue to see the impact of flat wages growth, rising living costs and higher real mortgage rates.

But there was one item in the NAB results which peaked my interest. They included this slide on the gross income distribution of households in their mortgage portfolio. Gross income is defined as total pre-tax unshaded income for the application. This can include business income, income of multiple applicants and other income sources, such as family trust income.  And it relates to draw-downs from Oct 17 – Mar 18. ~35% of transactions have income over 200K for owner occupied loans, and ~47% for investment loans. Now, I recognise that NAB has a skewed demographic in their customers, but, the proportion of high income households looked odd to me. So I pulled the household income data from our surveys, including only mortgaged households. We also ask for income on a similar basis, gross from all sources. And we plotted the results. The blue bars are the household gross income across the country for mortgaged households. The next two are a replication of the NAB data sets above. Either they are very, very good at targetting high income customers, or incomes in their system are being overstated. We discussed this in a separate video “Mortgage Distribution By Income Bands”.

AMP published a 28 page response to the issues raised by the Royal Commission.   They made the point that the fees for no service issue is old news. In addition, they down played the preparation of a Clayton Utz report into the issue and the firms misleading representations to ASIC. They did unreservedly apologise for their financial advice failings relating to service delivery to customers and spoke about extensive action aims to ensure these issues “never happen again.” But I am not sure they have really understood the implications for their business of the findings, despite the Chairman Catherine Brenner, following the CEO out of the door.  And I am not sure they have clarity around their strategy.

But they also announced that David Murray, a well-respected financial services insider to take over the Chairman’s role. He of course was the CEO at CBA during its massive expansion into Wealth Management, and significant vertical integration – the very issues which are at the heart of the Royal Commission Inquiry. And He led the Financial Systems Inquiry, which forced capital ratios higher, but which was also very light on customer centricity. So he will be a safe pair of hands, but we wonder if he can truly transform AMP to a customer focussed business.  They have a massive amount to do to deal with potential fines, repair the damaged brand and chart a path ahead. But there are in my mind some critical questions about the role and shape of the board, and how they truly inject a customer first focus. This question should be occupying the minds of all CEO’s and Boards in the sector, not just AMP.

And I have a suggestion. I think the financial services companies should have a customer board – a group of customers of the bank, who would be engaged and involved in the operations and strategic direction of the business. A strong customer Board would be able to ensure the voice of the customer is heard and the priority of customer centricity placed firmly on the agenda. And remember, there is strong evidence that companies who truly put their customers first can create superior and sustainable value for shareholders too.

Of course there are structural options too. I think is likely that the financial services sector will see a bevy of break-ups and sell-offs. NAB, for example will be selling off their MLC wealth management business, marking the end of their mass-market wealth experiment. They will retain their upper end JBWere business as part of their Private Bank, for the most affluent customers.  Other players are also divesting wealth businesses, partly because they never really generated the value expected, (and frittered away shareholder funds in the process) and because of the higher risks thanks to the FOFA “Best Interests” requirement.  So it raises the question of whether financial advice will be available to the masses, even via robots, and indeed whether they really need it anyway. For most people generally the approach would be pretty simple (but your mileage may vary, so this is not Financial Advice). Pay down the mortgage as fast as you can. Make sure you have adequate insurance. Don’t use consumer credit and save via an appropriate industry fund. Hardly need to pay fees to an adviser for that guidance I would have thought. Financial Advice has been over-hyped, which is why the fees grabbed by the sector are so high. Mostly it’s an unnecessary expense, in my view.

Another option to fix the Banking System would be to bring in a Glass-Steagall type regime. Glass-Steagall emerged in the USA in 1993, after a banking crisis, where banks lent loans for a long period, but funded them from short term, money market instruments. Things went pear shaped when short and long term rates got out of kilter. So The Glass-Steagall Act was brought in to separate the “speculative” aspects of banking from the core business of taking deposits and making loans. Down the track in 1999, the Act was revoked, and many say this was one of the elements which created the last crisis in the USA in 2007.

Now the Citizens Electoral Council of Australia CEC (an Australian Political Party) has drafted an Australian version of the Glass-Steagall act, and Bob Katter has announced that he will try to bring the legislation as a Private Member’s Bill called The Banking System Reform (Separation of Banks) Bill 2018. And Bob Katter has form here, in taking the lead in Parliament on Glass-Steagall, as he did on the need for a Royal Commission into the banks in 2017.

The 21st Century Glass-Steagall Act has been updated to prohibit commercial banks from speculating in the specific financial products that caused the 2008 global financial crisis, which didn’t exist in 1933, such as financial derivatives. These updates are reflected in the Australian bill. Aside from specific practices, the overriding lesson of the 2008 crash is that commercial banks should not mix with other financial activities such as speculative investment banking, hedge funds and private equity funds, insurance, stock broking, financial advice and funds management. The banks have gone far beyond traditional banking, into other financial services and speculating in derivatives and mortgage-backed securities. Consequently, they have built up a housing bubble, which is heading towards a crash and an Australian financial crisis.

The bill also addresses the question of the role and function of APRA, the financial regulator, which we believe has a myopic fixation on financial stability at all costs, never might the impact on customers, as the recent Productivity Commission review called out.

Two points. First there is merit in the Glass Steagall reforms, and I recommend getting behind the initiative, despite the fact that it will not fix the current problem of the massive debt households have. Banks were able to create loans thanks to funding being available from the capital markets, and so bid prices up. Turn that off, and their ability to lend will be curtailed ahead, which is a good thing, but the existing debts will remain. Second, some are concerned about the CEC, and its motives. The CEC, is an Australian federally registered political party which was established in 1988. From 1992 onward the CEC joined with Lyndon H. LaRouche and you can read about his policies and philosophy here. But my point is, if you need a horse, and a horse appears, ride the horse and worry less about which stable it came from. I applaud the CEC for driving the Glass Stegall agenda.

But to deal with the debt burden we have, there are some other things to consider. For example, at the moment the standard mortgage contract gives banks full recourse — if you default the bank can not only sell the property, but also get a court judgment to go after your other assets and even send you bankrupt. In the USA some states have non-recourse loans, and recent research showed that borrowers in these non-recourse states are 32 per cent more likely to default than borrowers in recourse states. This is because if the outcome of missing your mortgage payments is losing pretty much everything you own and being declared bankrupt, you will do just about anything possible to keep paying your home loan.  And banks will be more likely to make riskier loans when they have full recourse. So I wonder if we should consider changes to the recourse settings in Australia, which appear to me to favour the banks over customers, and encourage more sporty lending.

Then finally, there is the idea of changing the fundamental basis of bank funding, using the Chicago Plan. You can watch our video “Popping The Housing Affordability Myth” where we discuss this in more detail and “It’s Time for An Alternative Finance Narrative” where we go into more details. Essentially, the idea is to limit bank lending to deposits they hold, and it offers a workout strategy to deal with the high debt in the system and remove the boom and bust cycles. This is not a mainstream idea at the moment, but I think the ideas are worthy of further exploration. This is something I plan to do in a later video and look at how a transition would work.

But my broader point is that we need some fresh thinking to break out of our current dysfunctional banking models. Today, they may support GDP results as they inflate home prices more, but we are at the point where households a “full of debt”. So we see higher risks in the system as the latest RBA Statement On Monetary Policy, which we discussed in our video “The RBA Sees Cake – Tomorrow”. They called out risks relating to the amount of debt in the household sector, and the prospect of higher funding costs, a credit crunch, and lower consumption should home prices fall. And the latest data shows that prices are falling in the major centres now, and auction results continue lower. I believe that the RBA’s business as usual approach will lead us further up the debt blind alley. Which is why we need more radical reform in the banking system and the regulators if we are to chart a path ahead.

Mortgage Distribution By Income Bands

In NAB’ results today they included this slide on the gross income distribution of households in their mortgage portfolio. Gross income is defined as total pre-tax unshaded income for the application. This can include business income, income of multiple applicants and other income sources, such as family trust income.  And it relates to draw-downs from Oct 17 – Mar 18. ~35% of transactions have income over 200K for owner occupied loans, and ~47% for investment loans.

Now, I recognise that NAB has a skewed demographic in their customers, but, the proportion of high income households looked odd to me.

So I pulled the household income data from our surveys, including only mortgaged households. We also ask for income on a similar basis, gross from all sources. And we plotted the results:

The blue bars are the household gross income across the country for mortgaged households. The next two are a replication of the NAB data sets above.

Either they are very, very good at targetting high income customers, or incomes in their system are being overstated. I will let others decide which is the correct answer. What do you think?


April Mortgage Stress Trends Higher … Again…

Digital Finance Analytics (DFA) has released the April 2018 mortgage stress and default analysis update.

Across Australia, more than 963,000 households are estimated to be now in mortgage stress (last month 956,000). This equates to 30.1% of owner occupied borrowing households. In addition, more than 21,600 of these are in severe stress, up 500 from last month. We estimate that more than 55,600 households risk 30-day default in the next 12 months. We expect bank portfolio losses to be around 2.8 basis points, though losses in WA are higher at 5 basis points.  We continue to see the impact of flat wages growth, rising living costs and higher real mortgage rates.

Martin North, Principal of Digital Finance Analytics says “overall, risks in the system continue to rise, and while recent strengthening of lending standards will help protect new borrowers, there are many households currently holding loans which would not now be approved. The recent Royal Commission laid bare some of the industry practices which help to explain why stress is so high. This is a significant sleeping problem and the risks in the system remain higher than many recognise”.

News On the Finance Sector Is Set to Get Worse.

Australia is horrified by what they are learning from the Royal Commission; yet this is only the beginning. News on the finance sector is set to get much worse.

Gill North, a Professor of law at Deakin University and Principal at DFA, suggests “the issues highlighted by the RC represent only the tip of the iceberg and Australia is in for a bumpy and uncomfortable ride”. The systemic risks across the financial sector and economy are now much higher than most participants realise, and these risks are exacerbated by the concentration of the finance sector and its many interconnections, the laxity of the lending standards over the last decade, the high levels of household debt (and the distribution of this debt), and the heavy reliance of the Australian economy on the health of the residential property market.

At some point down the road, the true resilience of the financial institutions, their consumers, and the broader economy will be tested and put under extreme pressure. And when this occurs, the high levels of household debt and financial stress, and the large disparities between the population segments that have considerable income, savings and wealth buffers, and those who have no such buffers, will become starker. “When the next housing or financial crisis hits (and the question is when and not if), the ensuing impact on the finance sector, many Australian households, and the broader economy will be severe. Yet most, if not all, of the financial institutions, the regulators, policy makers, and consumers still remain largely oblivious to what lies ahead.”

Martin North says: “We continue to see the number of households rising, and the quantum is now economically significant. Things will get more severe, especially as household debt continues to climb to new record levels. Mortgage lending is still growing at two to three times income. This is not sustainable and we are expecting lending growth to continue to moderate in the months ahead as underwriting standards are tightened and home prices fall further”. The latest household debt to income ratio is now at a record 188.6.[1]

Our analysis uses the DFA core market model which combines information from our 52,000 household surveys, public data from the RBA, ABS and APRA; and private data from lenders and aggregators. The data is current to end April 2018. We analyse household cash flow based on real incomes, outgoings and mortgage repayments, rather than using an arbitrary 30% of income.

Households are defined as “stressed” when net income (or cash flow) does not cover ongoing costs. They may or may not have access to other available assets, and some have paid ahead, but households in mild stress have little leeway in their cash flows, whereas those in severe stress are unable to meet repayments from current income. In both cases, households manage this deficit by cutting back on spending, putting more on credit cards and seeking to refinance, restructure or sell their home.  Those in severe stress are more likely to be seeking hardship assistance and are often forced to sell.

The forces which are lifting mortgage stress levels remain largely the same. In cash flow terms, we see households having to cope with rising living costs – notably child care, school fees and fuel – whilst real incomes continue to fall and underemployment remains high. Households have larger mortgages, thanks to the strong rise in home prices, especially in the main eastern state centres, and now prices are slipping. While mortgage interest rates remain quite low for owner occupied borrowers, those with interest only loans or investment loans have seen significant rises.  We expect some upward pressure on real mortgage rates in coming months as international funding pressures mount, a potential for local rate rises and margin pressure on the banks thanks to a higher Bank Bill Swap Rate (BBSW).

Probability of default extends our mortgage stress analysis by overlaying economic indicators such as employment, future wage growth and cpi changes.  Our Core Market Model also examines the potential of portfolio risk of loss in basis point and value terms. Losses are likely to be higher among more affluent households, contrary to the popular belief that affluent households are well protected.

Stress by The Numbers.

Regional analysis shows that NSW has 262,577 households in stress (261,159 last month), VIC 256,353 (258,303 last month), QLD 175,960 (176,154 last month) and WA has 128,600 (126,606 last month). The probability of default over the next 12 months rose, with around 10,513 in WA, around 10,316 in QLD, 13,830 in VIC and 14,798 in NSW.

The largest financial losses relating to bank write-offs reside in NSW ($1.4 billion) from Owner Occupied borrowers) and VIC ($936 million) from Owner Occupied Borrowers, which equates to 2.10 and 2.76 basis points respectively. Losses are likely to be highest in WA at 5 basis points, which equates to $696 million from Owner Occupied borrowers.  A fuller regional breakdown is set out below.

Here are the top post codes sorted by the highest number of households in mortgage stress.

[1] RBA E2 Household Finances – Selected Ratios December 2017 (Revised 3rd April 2018).

You can request our media release. Note this will NOT automatically send you our research updates, for that register here.

[contact-form to=’mnorth@digitalfinanceanalytics.com’ subject=’Request The April 2018 Stress Release’][contact-field label=’Name’ type=’name’ required=’1’/][contact-field label=’Email’ type=’email’ required=’1’/][contact-field label=’Email Me The April 2018 Media Release’ type=’radio’ required=’1′ options=’Yes Please’/][contact-field label=”Comment If You Like” type=”textarea”/][/contact-form]

Note that the detailed results from our surveys and analysis are made available to our paying clients.

Household Finance Confidence Slides Again In March

The latest Digital Finance Analytics Household Finance Confidence Index for March 2018 shows a further slide in confidence compared with the previous month.

The current score is 92.3, down from 94. 6 in February, and it has continued to drop since October 2016. The trend is firmly lower.

Across the states, confidence is continuing to fall in NSW and VIC, was little changes in SA and QLD, but rose in WA.

Across the age bands, there were falls in all age groups.

Turning to the property-based segmentation, owner occupied householders remain the most confident, while property investors continue to become more concerned about the market. Those who are property inactive – renting, or living with parents or friends remain the least confident. Nevertheless those who are property owners remain more confident relative to property inactive households.

We can look at the various drivers which underpin the finance confidence index.

We start with job security. This month, there was a rise 6% in households who are less confident about their job security compared with last month,  up to 25.8%. Those who felt more secure fell by 1.5% to 12.1% while 61% saw no change. Availability of work was a primary concern, but the security concerns were more around job terms and conditions, and the requirement to work unsocial hours and weekends.

Turning to concerns about levels of debt, 44.5% of households were more concerned about their outstanding loans, up 1.5% from last month. Under 3% of households were more comfortable with the debt they hold. 49% reported no change this month. Those who were more concerned about debt highlighted concerns about higher interest rates, and the ability to service their current loans in a flat income environment.

52% of households reported their incomes had fallen in the past month, in real terms. This is up 1.5% this month. Just over 1% of households reported a pay rise, and 43% reported no change in real incomes.  More households comprise of members who are working multiple jobs to maintain income.

In contrast, cost of living continues to rise faster than incomes for many households. 77% of households said their costs had indeed risen, up slightly from last month. 18% of households said costs had stayed the same and 3% said costs had fallen. Households said the costs of electricity, petrol, school fees and child care costs all hit home.  Health care costs, and especially the costs of private health care cover also figured in their responses.  More households are seriously considering terminating their health insurance cover due to the rising expense.

Turning to savings, 46% of households were less comfortable with their savings a rise of 1.5% compared with last month. 4% were more comfortable. 50% were about the same. There were ongoing concerns about further falls in interest rates on deposit accounts, and the need to continue to raid savings to support ongoing household budgets.

Finally, we look at household overall net worth. Despite the volatility seen in the financial markets, the main concern captured in answers to this question related to potential falls in property values. 52% said their total net worth was higher, down 3% from last month. 18% said their net worth was lower, a rise of 2% compared with last month. 28% remained the same.  Both those with higher levels of education, and males tended to report more of a rise in net worth. Women were considerable more concerned about the current  trajectory of home prices, and the risks relating to future falls.  Households in regional centres remained more concerned about their net worth, not least because in many areas home prices have risen less strongly in recent years.

So in conclusion, based on the latest results, we see little on the horizon to suggest that household financial confidence will improve. We expect wages growth to remain contained, and home prices to slide, while costs of living pressures continue to grow. There will also be more pressure on mortgage interest rates as funding costs rise, and lower rates on deposits as banks trim these rates to protect their net margins.

By way of background, these results are derived from our household surveys, averaged across Australia. We have 52,000 households in our sample at any one time. We include detailed questions covering various aspects of a household’s financial footprint. The index measures how households are feeling about their financial health. To calculate the index we ask questions which cover a number of different dimensions. We start by asking households how confident they are feeling about their job security, whether their real income has risen or fallen in the past year, their view on their costs of living over the same period, whether they have increased their loans and other outstanding debts including credit cards and whether they are saving more than last year. Finally we ask about their overall change in net worth over the past 12 months – by net worth we mean net assets less outstanding debts.

We will update the index next month.

The Housing Boom Is “Officially” Over – The Property Imperative 07 Apr 2018

Welcome to the Property Imperative Weekly to 07 April 2018.

Watch the video, or read the transcript.

In this week’s digest of finance and property news, we start with Paul Keating’s (he of the recession we had to have fame), comment that the housing boom is really over at the recent AFR conference.

He said that the banks were facing tighter controls as a result of the Basel rules on capital adequacy, while financial regulators had had a “gutful” of them. This was likely to lead to changes that would restrict the banks’ ability to lend. He cited APRA’s recent interventions in interest only loans as one example, as they restrict their growth. Keating also said the royal commission into misconduct in the banking and financial services sector would also “make life harder” for the banks and pointed out that banks did not really want to lend to business these days and would “rather just do housing loans”. Finally, he spoke of the “misincentives” within the big banks to grow their business by writing new mortgages, including having a high proportion of interest-only lending.

Anna Bligh speaking at the AFR event, marked last Tuesday her first year as CEO of the Australian Banking Association (ABA) – but said she feels “like 500 years” have already passed. Commenting on the Royal Commission she warned that credit could become tighter ahead. The was she said an opportunity for a major reset, not only in how we do banking but how we think about it, its place in our lives, its role in our economy and, most of all, it’s trustworthiness”.

At the same conference, Rod Simms the Chair of the ACCC speech “Synchronised swimming versus competition in banking” He discussed the results of their recent investigation into mortgage pricing, and also discussed the broader issues of competition versus financial stability in banking. He warned that the industry should be aware of, and respond to, the fact that the drive for consumers to get a better deal out of banking is shared by many beyond the ACCC. Every household in Australia is watching.  You can watch our video blog on this for more details.

He specifically called out a lack of vigorous mortgage price competition between the five big Banks, hence “synchronised swimming”. Indeed, he says discounting is not synonymous with vigorous price competition. They saw evidence of communications “referring to the need to avoid disrupting mutually beneficial pricing outcomes”.

He also said residential mortgages and personal banking more generally make one of the strongest cases for data portability and data access by customers to overcome the inertia of changing lenders.

Finally, on competition. he says if we continue to insulate our major banks from the consequences of their poor decisions, we risk stifling the cultural change many say is needed within our major banks to put the needs of their customers first. Vigorous competition is a powerful mechanism for driving improved efficiency, and also for driving improved price and service offerings to customers. It can in fact lead to better stability outcomes.

This puts the ACCC at odds with APRA who recent again stated their preference for financial stability over competition – yet in fact these two elements are not necessarily polar opposites!

Then there was the report from the good people at UBS has published further analysis of the mortgage market, arguing that the Royal Commission outcomes are likely to drive a further material tightening in mortgage underwriting. As a result, they think households “borrowing power” could drop by ~35%, mainly thanks to changes to analysis of expenses, as the HEM benchmark, so much critised in the Inquiry, is revised. Their starting point assumes a family of four has living expenses equal to the HEM ‘Basic’ benchmark of $32,400 p.a. (ie less than the Old Age Pension). This is broadly consistent with the Major banks’ lending practices through 2017. As a result, the borrowing limits provided by the banks’ home loan calculators fell by ~35% (Loan-to-Income ratio fell from ~5-6x to ~3-4x). This leads to a reduction in housing credit and a further potential fall in home prices.

Our latest mortgage stress data, which was picked by Channel Nine and 2GB, thanks to Ross Greenwood, Across Australia, more than 956,000 households are estimated to be now in mortgage stress (last month 924,500). This equates to 30.0% of households. In addition, more than 21,000 of these are in severe stress, no change from last month. We estimate that more than 55,000 households risk 30-day default in the next 12 months. We expect bank portfolio losses to be around 2.8 basis points, though with losses in WA are higher at 4.9 basis points.  Flat wages growth, rising living costs and higher real mortgage rates are all adding to the burden. This is not sustainable and we are expecting lending growth to continue to moderate in the months ahead as underwriting standards are tightened and home prices fall further”. The latest household debt to income ratio is now at a record 188.6. You can watch our separate video blog on this important topic.

ABS data this week showed The number of dwellings approved in Australia fell for the fifth straight month in February 2018 in trend terms with a 0.1 per cent decline. Approvals for private sector houses have remained stable at around 10,000 for a number of months. But unit approvals have fallen for five months. Overall, building activity continues to slow from its record high in 2016. And the sizeable fall in the number of apartments and high density dwellings being approved comes at a time when a near record volume are currently under construction. If you assume 18-24 months between approval and completion, then we still have 150,000 or more units, mainly in the eastern urban centres to come on stream. More downward pressure on home prices. This helps to explain the rise in 100% loans on offer via some developers plus additional incentives to try to shift already built, or under construction property.

CoreLogic reported  last week’s Easter period slowdown saw 670 homes taken to auction across the combined capital cities, down significantly on the week prior when a record number of auctions were held (3,990). The lower volumes last week returned a higher final clearance rate, with 64.8 per cent of homes selling, increasing on the 62.7 per cent the previous week.  Both clearance rate and auctions volumes fell across Melbourne last week, with only 152 held and 65.5 per cent clearing, down on the week prior when 2,071 auctions were held across the city returning a slightly higher 65.8 per cent success rate.

Sydney had the highest volume of auctions of all the capital city auction markets last week, with 394 held and a clearance rate of 67.9 per cent, increasing on the previous week’s 61.1 per cent across a higher 1,383 auctions.

Across the smaller capital cities, clearance rates improved week-on-week in Canberra, Perth and Tasmania; however, volumes were significantly lower across each market last week compared to the week prior.

Across the non-capital city auction markets, the Geelong region recorded the strongest clearance rate last week with 100 per cent of the 20 auction results reporting as successful.

The number of homes scheduled to go to auction this week will increase across the combined capital cities with 1,679 currently being tracked by CoreLogic, up from last week when only 670 auctions were held over the Easter period slowdown.

Melbourne is expected to see the most significant increase in volumes this, with 669 properties scheduled for auction, up from 152 auctions held last week. In Sydney, 725 homes are set to go to auction this week, increasing on the 394 held last week.

Outside of Sydney and Melbourne, each of the remaining capital cities will see a higher number of auctions this week compared to last week.

Overall auction activity is set to be lower than one year ago, when 3,517 were held over what was the pre-Easter week last year.

Finally, with local news all looking quite negative, let’s look across to the USA as the most powerful banker in the world, JPMorgan Chase CEO Jamie Dimon, just released his annual letter to shareholders.  Given his bank’s massive size (it earned $24.4 billion on $103.6 billion in revenue last year) and reach (it’s a giant in consumer/commercial banking, investment banking and wealth management), Dimon has his figure on the financial pulse.

He says that’s while the US economy seems healthy today and he’s bullish for the “next year or so” he admits that the US is facing some serious economic headwinds.

For one, he’s concerned the unwinding of quantitative easing (QE) could have unintended consequences. Remember- QE is just a fancy name for the trillions of dollars that the Federal Reserve conjured out of thin air.

He said – Since QE has never been done on this scale and we don’t completely know the myriad effects it has had on asset prices, confidence, capital expenditures and other factors, we cannot possibly know all of the effects of its reversal.

We have to deal with the possibility that at one point, the Federal Reserve and other central banks may have to take more drastic action than they currently anticipate – reacting to the markets, not guiding the markets.

And of course the DOW finished the week on a down trend, down 2.34%, and wiping out all the value gained this year, and volatility is way up. Here is a plot of the DOW.

This extreme volatility does suggest the bull market is nearing its end… if it hasn’t ended already. Dimon seems pretty sure we’re in for more volatility and higher interest rates. One scenario that would require higher rates from the Fed is higher inflation:

If growth in America is accelerating, which it seems to be, and any remaining slack in the labor markets is disappearing – and wages start going up, as do commodity prices – then it is not an unreasonable possibility that inflation could go higher than people might expect.

As a result, the Federal Reserve will also need to raise rates faster and higher than people might expect. In this case, markets will get more volatile as all asset prices adjust to a new and maybe not-so-positive environment.

Now– here’s the important part. For the past ten years, the largest buyer of US government debt was the Federal Reserve. But now that QE has ended, the US government just lost its biggest lender.

Dimon thinks other major buyers, including foreign central banks, the Chinese, etc. could also reduce their purchases of US government debt. That, coupled with the US government’s ongoing trade deficits (which will be funded by issuing debt), could also lead to higher rates…

So we could be going into a situation where the Fed will have to raise rates faster and/ or sell more securities, which certainly could lead to more uncertainty and market volatility. Whether this would lead to a recession or not, we don’t know.

We’ll leave you with one final point from Jamie Dimon. He acknowledges markets have a mind of their own, regardless of what the fundamentals say. And he sees a real risk “that volatile and declining markets can lead to a market panic.”

Financial markets have a life of their own and are sometimes barely connected to the real economy (most people don’t pay much attention to the financial markets nor do the markets affect them very much). Volatile markets and/or declining markets generally have been a reaction to the economic environment. Most of the major downturns in the market since the Great Depression reflect negative future expectations due to a potential or real recession. In almost all of these cases, stock markets fell, credit losses increased and credit spreads rose, among other disruptions. The biggest negative effect of volatile markets is that it can create market panic, which could start to slow the growth of the real economy. Because the experience of 2009 is so recent, there is always a chance that people may overreact.

Dimon cautioned investors that interest rates could rise much sooner than they expect. If inflation suddenly comes roaring back. Indeed, it’s entirely possible the 10-year could break above 4% in the near future as inflation returns to 2% and the Fed shrinks its balance sheet.

Dimon also cast a wary eye toward exchange-traded funds, which have seen their popularity multiply since the financial crisis. There are now many ETF products that are considerably more liquid than their underlying assets. In fact far more money than before (about $9 trillion of assets, which represents about 30% of total mutual fund long-term assets) is managed passively in index funds or ETFs (both of which are very easy to get out of). Some of these funds provide far more liquidity to the customer than the underlying assets in the fund, and it is reasonable to worry about what would happen if these funds went into large liquidation.

And Finally America’s net debt currently stands at 77% of GDP (this is already historically high but not unprecedented). The chart below also shows the Congressional Budget Office’s estimate of the total U.S. debt to GDP, assuming a 2% real GDP growth rate. Hopefully, with the right policies they can grow faster than 2%. But more debt does seem on the cards.

And to add to that perspective, we spoke about the recent Brookings report which highlighted the rise in non conforming housing debt in the USA. debt as lending standards are once again being loosened, and risks to mortgage services are rising.

The authors quote former Ginnie Mae president Ted Tozer concerning the stress between Ginnie Mae and their nonbank counterparties.

… Today almost two thirds of Ginnie Mae guaranteed securities are issued by independent mortgage banks. And independent mortgage bankers are using some of the most sophisticated financial engineering that this industry has ever seen. We are also seeing greater dependence on credit lines, securitization involving multiple players, and more frequent trading of servicing rights and all of these things have created a new and challenging environment for Ginnie Mae. . . . In other words, the risk is a lot higher and business models of our issuers are a lot more complex. Add in sharply higher annual volumes, and these risks are amplified many times over. . . . Also, we have depended on sheer luck. Luck that the economy does not fall into recession and increase mortgage delinquencies. Luck that our independent mortgage bankers remain able to access their lines of credit. And luck that nothing critical falls through the cracks…

They say that goldfish have the shortest memory in the Animal Kingdom… something like 3-seconds. But not even a decade after these loans nearly brought down the entire global economy, SUBPRIME IS BACK. In fact it’s one of the fastest growing investments among banks in the United States. Over the last twelve months the subprime volume among US banks doubled, and it’s already on pace to double again this year.

What could possibly go wrong?