After the ME Bank Survey, and our Household Finance Confidence Index both showed the financial pain many households are in; now National Australia Bank’s (NAB) latest Consumer Behaviour Survey, shows the degree of anxiety being caused by not only cost of living pressures but also health, job security, retirement funding as well as Australian politics.
Of all the things bothering Australian households in early 2018, nothing surpasses cost of living pressures.
Source: NAB
From the National Australia Bank’s (NAB) latest Consumer Behaviour Survey, it shows the degree of anxiety being caused by not only cost of living pressures but also health, job security, retirement funding as well as Australian politics.
The higher the reading, the more anxious it is making Australians.
Somewhat surprisingly, it was not the gaggle in Canberra that caused the most anxiety for households in the latest survey, but rather persistent concerns surrounding living expenses.
“[The index] was basically unchanged in Q4 2017 at near survey lows with job security causing Australians the least stress, consistent with a strongly improving labour market,” said Alan Oster, NAB Group Chief Economist.
“That said, the cost of living is still weighing most heavily on them, highlighting the disconnect between low levels of economy-wide inflation and consumer focused costs.”
That was reflected in the detail of the latest survey, revealing some alarming statistics as to just how many Australians are struggling at present.
It found around two in five Australians suffered some form of financial hardship over the survey period, especially among lower-income earners.
Over 50% of low income earners reported some form of hardship, with almost one in two 18 to 49-year-olds being effected.
As seen in the chart below, after a steady improvement in late 2016 and early 2017, those reporting financial hardship have increased in recent quarters, coinciding with steep increases in gas and electricity charges for many Australian households.
Source: NAB
“Being unable to pay a bill was the most common cause,” the NAB said, adding this came in at over 20%.
“Not having enough for food and basic necessities was next, impacting one in three low income earners.”
Some 18% of respondents reported not having enough for food and basic necessities in the latest survey.
Source: NAB
Nearly half of those consumers also reported they were “extremely” concerned about their current financial position, nominating paying their utility bills as the biggest impact on their financial position.
Source: NAB
“While consumers told us they were a little less concerned about their household’s current financial position in Q4, being unable to pay a bill — particularly utilities — continues to have by far the biggest impact on those households most concerned about their finances,” Oster said.
With cost of living pressures still creating anxiety among households, the NAB asked respondents how much extra income they would need to alleviate those concerns.
In short, a lot, especially for those in the big capital cities and households with children.
“On average, consumers told us they need an extra $207 a week – or $10,764 per year,” Oster said, adding that “this varied according to where we live, our income, gender and family status”.
“It ranged from $221 in New South Wales and the ACT to $132 in Tasmania, and from $214 in capital cities to $186 in rural areas.
“Consumers with children need $258 and those without $191”.
Source: NAB
While Oster admits that how consumers “feel” doesn’t necessarily correlate with how they really spend, it underlines the point that many Australians think they’re getting squeezed financially.
If it wasn’t already apparent, this likely ensure the next federal election campaign will be centred around alleviating the perceived cost of living pressures facing many Australian households.
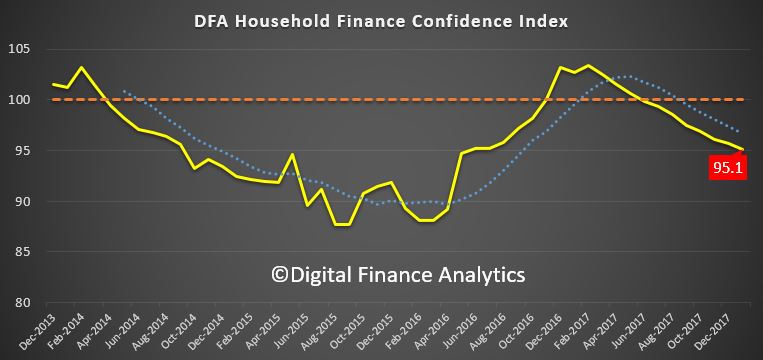
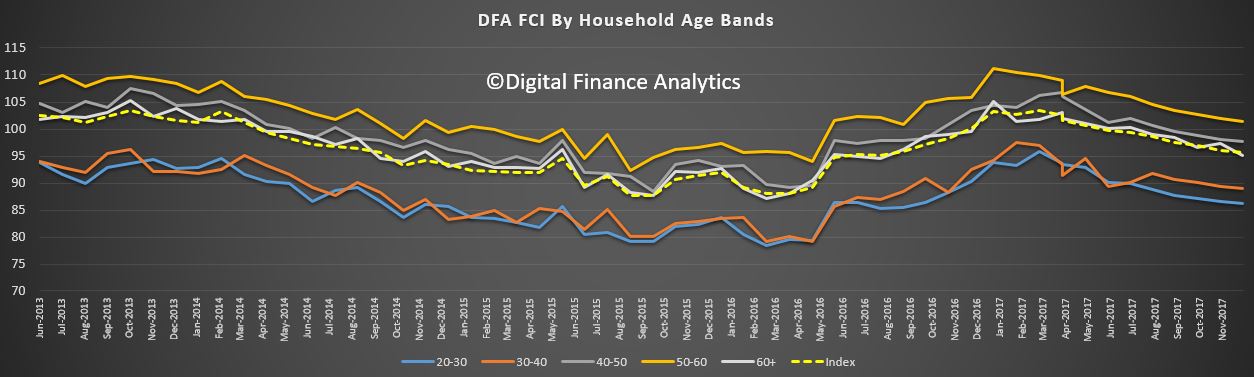
Digital Finance Analytics has released the January 2018 update of our Household Financial Confidence Index, using data from our rolling 52,000 household surveys.
The news is not good, with a further fall in the composite index to 95.1, compared with 95.7 last month. This is below the neutral setting, and is the eighth consecutive monthly fall below 100.
This result highlights the ongoing disconnect between business confidence, and consumers who are still reeling from rising costs of living, flat incomes and high debt.
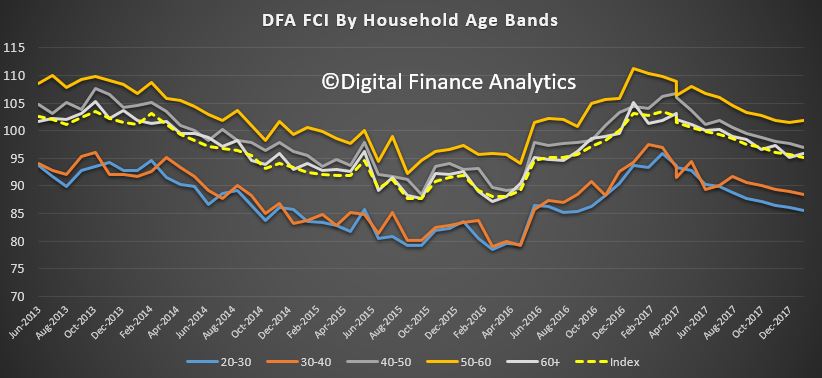
Across the age bands, there was a small rise in those older than 50 years, but younger households, from 20 -50 all tracked lower.
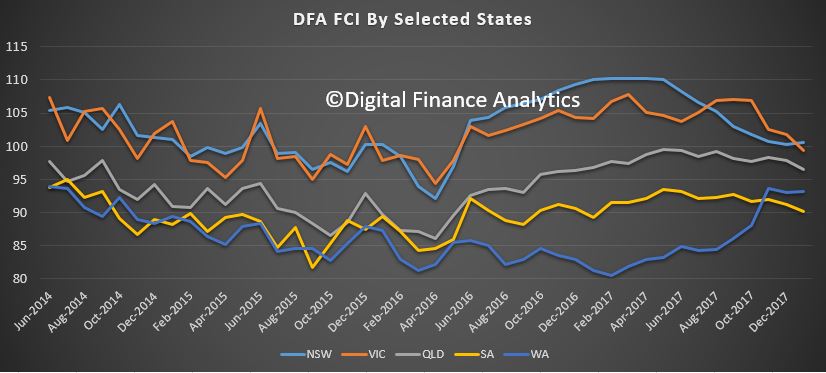
There was a significant drop in confidence in Victoria, which has now been overtaken again by New South Wales as the most confident state. Confidence fell in South Australia and Queensland, whilst there was little change in Western Australia, which recovered somewhat earlier in the year.
Household’s property footprint impacts confidence levels significantly, with those who are not property active and so living in rented accommodation sitting significantly below those who own property. Owner occupied property holders saw a small uplift this month, reflecting the lower refinancing rates available, and more first time buyers. However, property investors, traditionally the more bullish, continues to languish, dragging the whole index lower.
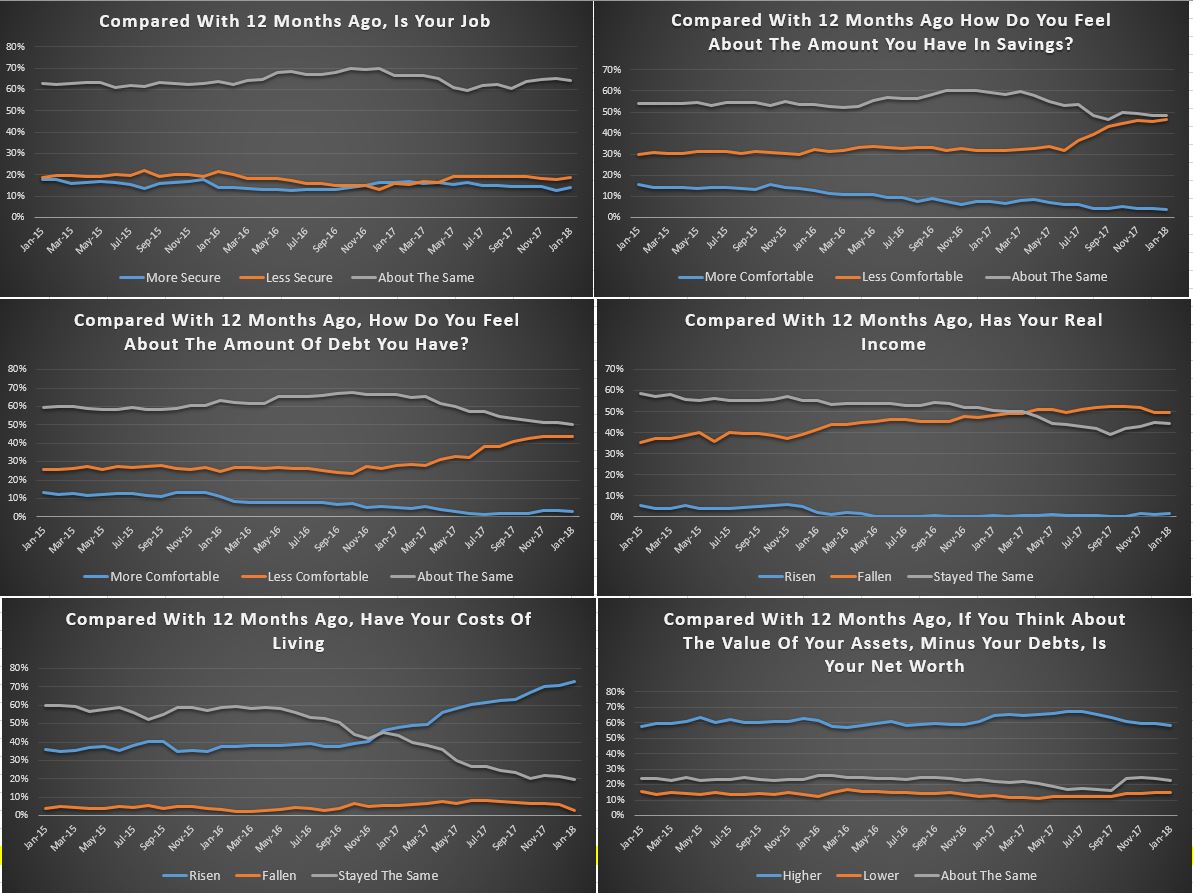
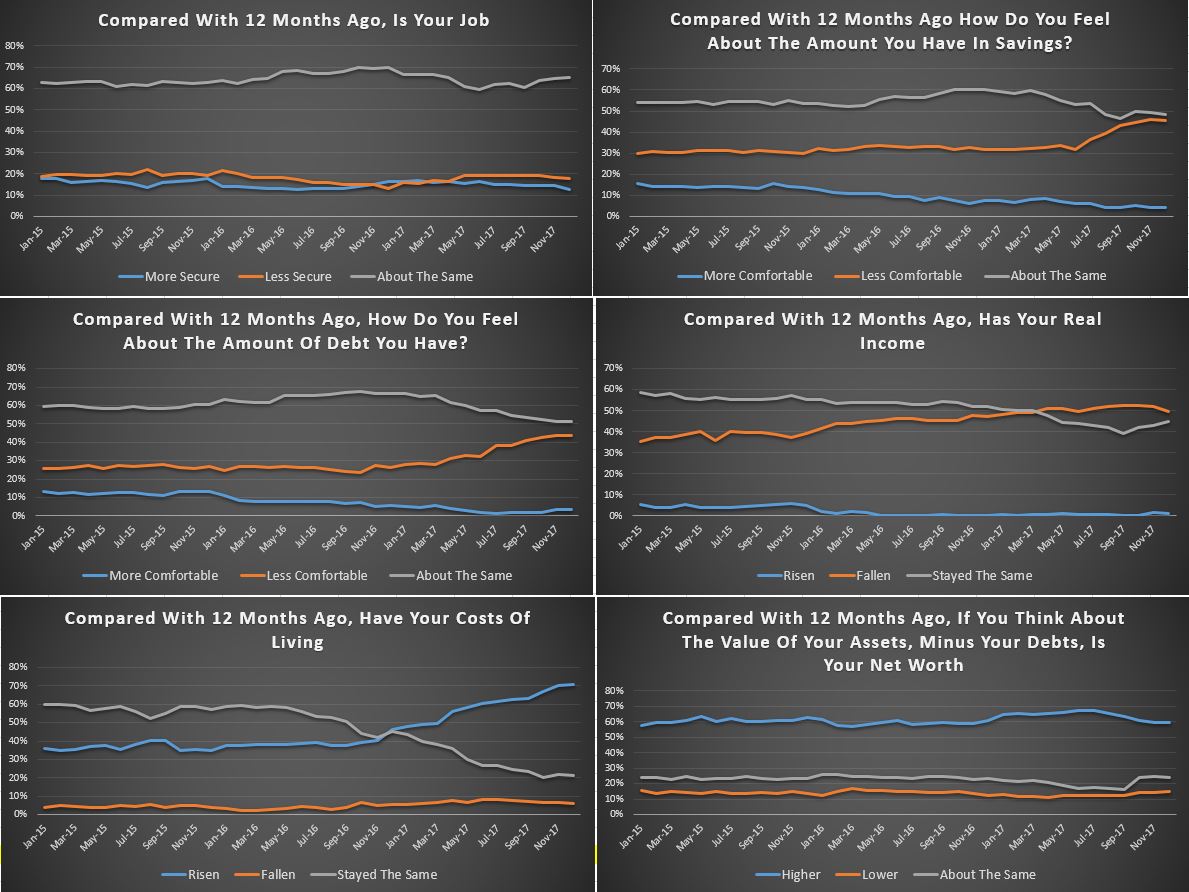
The segmental scorecard shows that whilst job security rose a little, pressure from large levels of debt rose further, with 44% of households less comfortable than a year ago, and only 3% more comfortable. Pressure on savings continues, with lower returns on deposits, and more dipping into savings to pay the bills. 46% of households were less comfortable with their savings, compared with a year ago, and 4% only were more comfortable.
Costs of living pressures are very real, with 73% of households recording a rise, up 1.5% from last month, and only 3% a fall in their living costs. A litany of costs, from school fees, child care, fuel, electricity and rates all hit home.
On the other hand, only 1% of households records a real rise in incomes compared with a year ago, while 50% said their real incomes had been eroded, and 45% stayed the same. More evidence that incomes are rising more slowly than costs. Those employed in the private sector are particularly hard hit, with many recording no pay rises for the past 2 years.
Finally, household net worth is under pressure for some, as property prices slide, and savings are being eroded (despite high stock market prices). Whilst 58% said wealth had improved, 15% recorded a fall, and 23% said there was no change. A further fall in property prices was the overwhelming concern of those holding real-estate, with more than half now expecting a fall in the months ahead. This expectation is already impacting their spending patterns, and have reduced their prospect of buying more property.
So, overall we see the ongoing slide in household financial confidence, and there is nothing on the horizon which is likely to change momentum. We expect wages growth to remain contained, and home prices to slide, while costs of living pressures continue to grow.
By way of background, these results are derived from our household surveys, averaged across Australia. We have 52,000 households in our sample at any one time. We include detailed questions covering various aspects of a household’s financial footprint. The index measures how households are feeling about their financial health. To calculate the index we ask questions which cover a number of different dimensions. We start by asking households how confident they are feeling about their job security, whether their real income has risen or fallen in the past year, their view on their costs of living over the same period, whether they have increased their loans and other outstanding debts including credit cards and whether they are saving more than last year. Finally we ask about their overall change in net worth over the past 12 months – by net worth we mean net assets less outstanding debts.
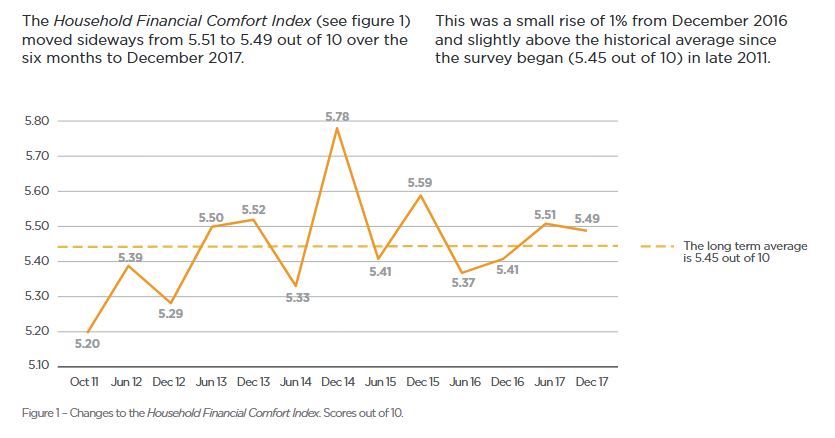
Despite improved job conditions and households reporting healthier financial buffers, the overall financial comfort of Australians is not advancing, according to ME’s latest Household Financial Comfort Report.
In its latest survey, ME’s Household Financial Comfort Index remained stuck at 5.49 out of 10, with improvements in some measures of financial comfort linked to better employment conditions – e.g. a greater ability to maintain a lifestyle if income was lost for three months – offset by a fall in comfort with living expenses.
“Households’ comfort with paying their monthly living expenses fell 3% to 6.40 out of 10 during the six months to December 2017, the lowest it’s been since mid-2014,” said Jeff Oughton, ME consulting economist and co-author of the report.
“In fact, ME’s latest report shows many households’ financial situation is getting worse and again the culprit is living expenses, with 40% reporting this as a key reason their situation is worsening.
“Around 46% of households surveyed also cited the cost of necessities such as fuel, utilities and groceries as one of their biggest worries.
“It’s unsurprising households are still feeling the pinch, given subdued income growth and the rising costs of energy, childcare, education and health.
“If it wasn’t for a decline in comfort with monthly living expenses, the report’s overall Household Financial Comfort Index would’ve likely increased,” said Oughton.
“The rising cost of necessities is currently holding Australians back when it comes to their finances.”
Oughton said that over the past year, 16% of households were not always able to pay their utility bills on time, while 19% sought financial help from family or friends and 13% pawned or sold something to buy necessities – a clear illustration of bill stress, particularly for those on lower incomes.
In other findings from the ABS, childcare costs have doubled in the past six years, while the cost of primary and secondary education has increased by 50%.
But Oughton said one household group of Australians is bucking the trend.
“Households under 35 years old without children – commonly dubbed the ‘avocado generation’ − many of whom have benefited from improved employment conditions without the burden of childcare costs or potentially a mortgage, are not as worried. Their financial comfort rose by 8%, and their comfort with living expenses increased 2% during 2017.”
Oughton said the report’s most encouraging result was households’ improved ability to maintain a lifestyle, if income was lost for three months, which rose 3% to 4.82 out of 10 in the past six months to December 2017 – its highest outcome since 2015. This finding reflects stronger labour market conditions, although mainly among full-time workers.
Victorians’ comfort plummets, while NSW’s rises
Household financial comfort in Victoria dropped significantly below New South Wales’ financial comfort for the first time since the survey began in 2011.
New South Wales improved by 3% in the past six months to 5.83 out of 10 in December 2017, the highest in three years, while Victoria fell 7% to 5.30 out of 10, its lowest level in the past six years.
“New South Wales’ superior financial comfort can be linked to greater confidence in handling a financial emergency (loss of income for three months) – a reflection of healthier employment conditions in the state,” said Oughton.
“Meanwhile, Victoria’s decline can be attributed to falls across most key drivers of financial comfort, including lower confidence in handling a financial emergency (loss of income for three months) and less comfort with investments.
“The discrepancy between the two states is significant given both have traditionally felt similar levels of comfort in the past,” added Oughton.
High levels of mortgage payment stress – set to worsen
More than half of households (56%) renting or paying off a mortgage reported they are contributing over 30% of their disposable household income towards this cost – a common indicator of financial stress – with 72% of renters spending 30% or more of their disposable income on rent and 46% of those paying off a mortgage putting 30% or more of their disposable income towards this.
Furthermore, the proportion of households who ‘worried about their household’s level of debt over the last month’ increased by 1 point to 38%. This proportion increased to 51% among mortgage holders, compared to 27% with no mortgage and 23% who own their own home outright.
“Seven per cent of households reported they could not always pay their mortgage on time during the past year, and 7% could not pay their rent on time.”
“Mortgage defaults may escalate if interest rates increase, particularly among vulnerable low-income households already dealing with the rising cost of necessities,” said Oughton.
The gap between Australia’s rich and poor continues to widen
A disparity in financial comfort between some household groups remain, with 30% of households reporting their financial situation worsened in the past year, while 35% reported it remained the same and 35% reported it improved.
“Around 61% of households with ‘low levels of comfort’ reported a significant worsening in their overall financial situation during 2017, while almost 70% of households on ‘high levels of comfort’ reported that their financial comfort improved during 2017. In other words, the rich are getting richer and the poor are getting poorer,” said Oughton.
Hardest hit were households with incomes below $40,000, 45% of which said their financial situation had worsened, as well as single parents and baby boomers, 36% of which reported their situation had worsened.
For the third consecutive report, disparity was also evident in household income improvements, with more than 50% of those earning over $100,000 reporting income gains while only 29% of those earning between $40,001 and $75,000 reporting income gains.
“Despite continued improvement in the labour market and general economic conditions, the benefits are not trickling down to many households. For these households it will only get worse as the cost of necessities keeps going up,” added Oughton.
Other findings
SA still feeling the pinch: Household financial comfort in South Australia fell by 4% to 5.00 out of 10 during the past six months, to remain the lowest of the mainland states.
WA and QLD continue to trend higher: Comfort in both Western Australia and Queensland remained broadly unchanged at 5.49 and 5.39 out of 10 respectively. Both resource-dominated regions are recovering from the mining downturn to be more in line with the level of household financial comfort reported across Australia as a whole.
The Household Financial Comfort Report is based on a survey of 1,500 Australians conducted by DBM Consultants in December 2017. The Report is produced every six months, with the first survey conducted in October 2011.
Digital Finance Analytics has released the January 2018 mortgage stress and default analysis update. Across Australia, more than 924,000 households are estimated to be now in mortgage stress (last month 921,000). This equates to 29.8% of households. In addition, more than 20,000 of these are in severe stress, down 4,000 from last month.
In this video we discuss the results, and count down the top 10 most stressed post codes this month.
We estimate that more than 51,500 households risk 30-day default in the next 12 months, down 500 from last month. We expect bank portfolio losses to be around 2.7 basis points, though with losses in WA are likely to rise to 4.9 basis points. Some households have benefited from refinancing to cheaper owner occupied loans, giving them a little more wriggle room in terms of cash flow. The typical transaction has saved up to 45 basis points or $187 each month on a $500,000 repayment mortgage.
Martin North, Principal of Digital Finance Analytics said “the number of households impacted are economically significant, especially as household debt continues to climb to new record levels. Mortgage lending is still growing at three times income. This is not sustainable and we are expecting lending growth to moderate in the months ahead”. The latest household debt to income ratio is now at a record 199.7.[1]
Risks in the system continue to rise, and while recent strengthening of lending standards will help protect new borrowers, there are many households currently holding loans which would not now be approved. This is a significant sleeping problem and the risks in the system are higher than many recognise.
As a result, many Australian households are heavily indebted and large segments of the community and the nation are highly susceptible to future harm. With these settings, Gill North (a professor of law at Deakin University and joint principal of Digital Finance Analytics) “expects a significant escalation of legal actions against lenders during the next decade.”
National responsible lending regimes have operated in Australia since 2009, with the stated aims to encourage prudent lending, curtail undesirable market practices, and impose sanctions for irresponsible lending and leasing. These regimes require credit providers to ensure a loan is suitable for the borrower (or more precisely, that it is not unsuitable). When doing so, lenders must consider the ability of the consumer to repay the loan and must verify their financial capacity to meet the relevant commitments. The Australian Securities and Investments Commission (ASIC) is required to supervise and enforce these provisions and has various powers under the National Consumer Credit Protection Act 2009 (Cth). ASIC has already challenged some lenders regarding their lending practices. However, when external conditions in Australia deteriorate and or levels of financial stress and loan defaults rise acutely, a wave of responsible lending actions seems inevitable.
Our analysis uses the DFA core market model which combines information from our 52,000 household surveys, public data from the RBA, ABS and APRA; and private data from lenders and aggregators. The data is current to end January 2017. We analyse household cash flow based on real incomes, outgoings and mortgage repayments, rather than using an arbitrary 30% of income.
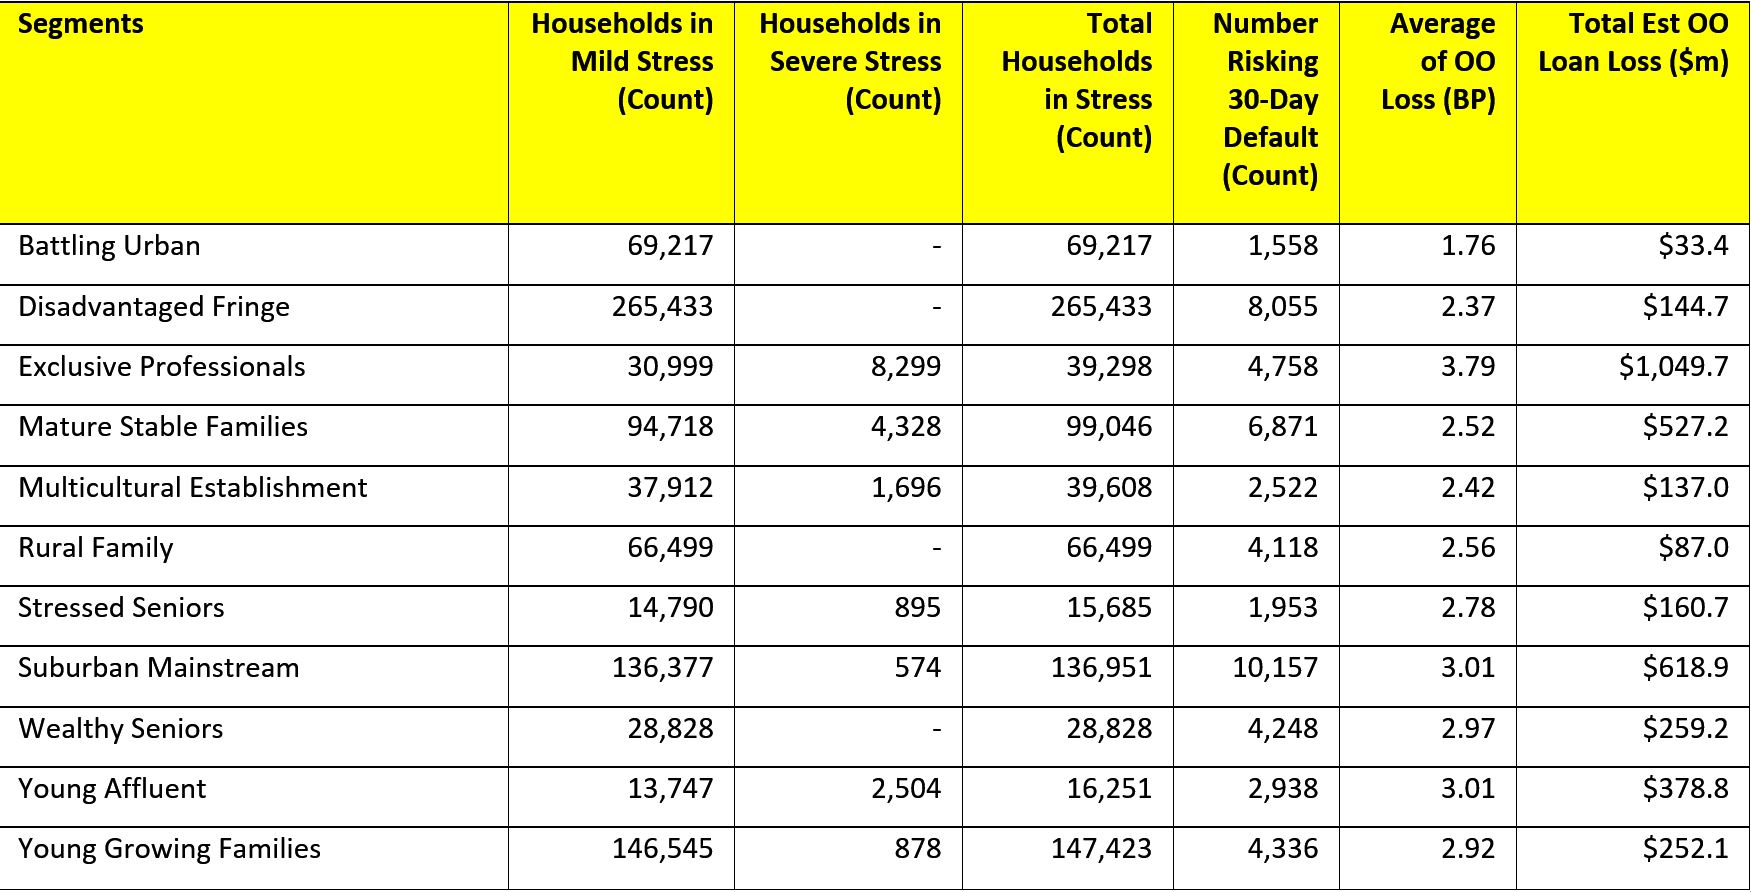
Households are defined as “stressed” when net income (or cash flow) does not cover ongoing costs. Households in mild stress have little leeway in their cash flows, whereas those in severe stress are unable to meet repayments from current income. In both cases, households manage this deficit by cutting back on spending, putting more on credit cards and seeking to refinance, restructure or sell their home. Those in severe stress are more likely to be seeking hardship assistance and are often forced to sell.
The forces which are lifting mortgage stress levels remain largely the same. In cash flow terms, we see households having to cope with rising living costs – notably child care, school fees and fuel – whilst real incomes continue to fall and underemployment remains high. Households have larger mortgages, thanks to the strong rise in home prices, especially in the main eastern state centres, but now prices are slipping. While mortgage rates remain quite low for owner occupied borrowers, those with interest only loans or investment loans have seen significant rises. We expect some upward pressure on real mortgage rates in the next year as international funding pressures mount, a potential for local rate rises and margin pressure on the banks.
Probability of default extends our mortgage stress analysis by overlaying economic indicators such as employment, future wage growth and cpi changes. Our Core Market Model also examines the potential of portfolio risk of loss in basis point and value terms. Losses are likely to be higher among more affluent households, contrary to the popular belief that affluent households are well protected.
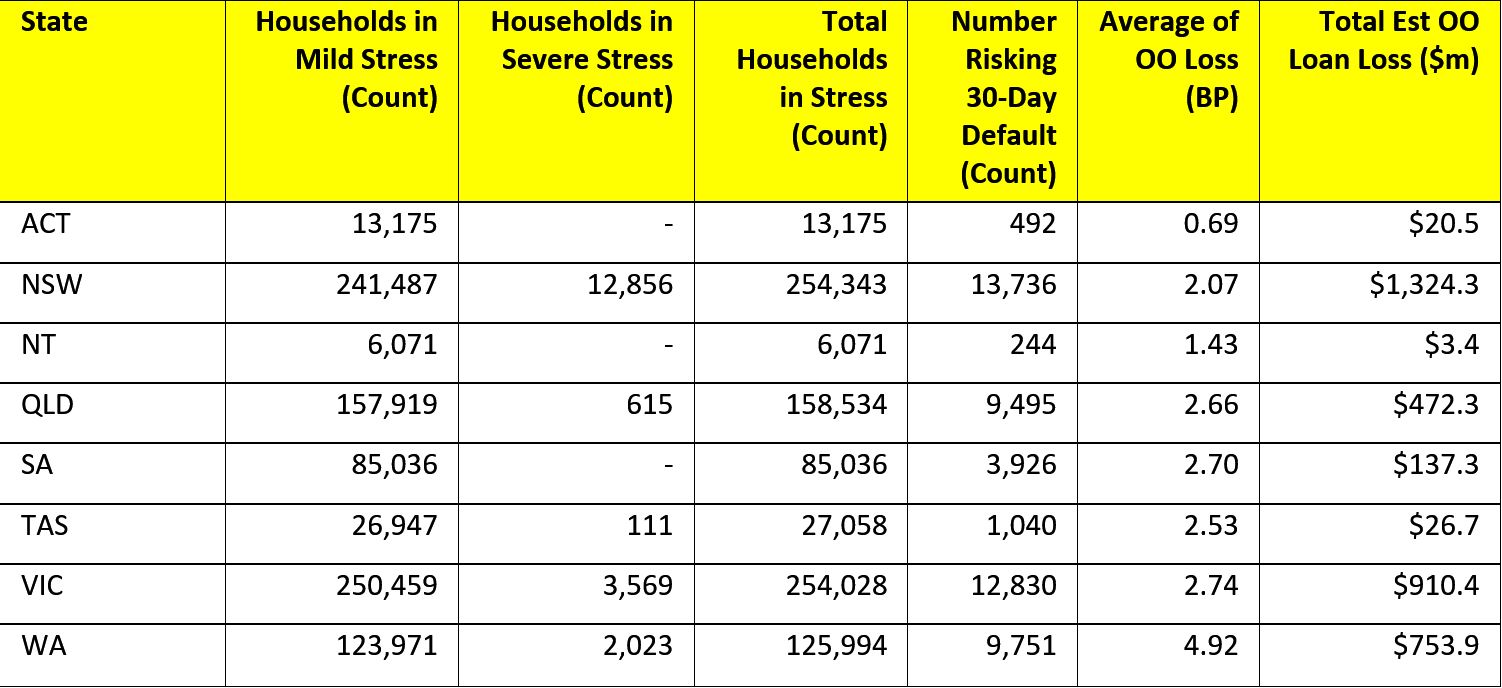
Regional analysis shows that NSW has 254,343 households in stress (258,572 last month), VIC 254,028 (254,485 last month), QLD 158,534 (156,097 last month) and WA 125,994 (121,934 last month). The probability of default rose, with around 9,800 in WA, around 9,500 in QLD, 13,000 in VIC and 14,000 in NSW.
The largest financial losses relating to bank write-offs reside in NSW ($1.3 billion) from Owner Occupied borrowers) and VIC ($910 million) from Owner Occupied Borrowers, which equates to 2.07 and 2.74 basis points respectively. Losses are likely to be highest in WA at 4.9 basis points, which equates to $753 million from Owner Occupied borrowers.
You can request our media release. Note this will NOT automatically send you our research updates, for that register here.
[contact-form to=’mnorth@digitalfinanceanalytics.com’ subject=’Request The January 2018 Stress Release’][contact-field label=’Name’ type=’name’ required=’1’/][contact-field label=’Email’ type=’email’ required=’1’/][contact-field label=’Email Me The January 2018 Media Release’ type=’radio’ required=’1′ options=’Yes Please’/][contact-field label=”Comment If You Like” type=”textarea”/][/contact-form]
Note that the detailed results from our surveys and analysis are made available to our paying clients.
[1] RBA E2 Household Finances – Selected Ratios September 2017
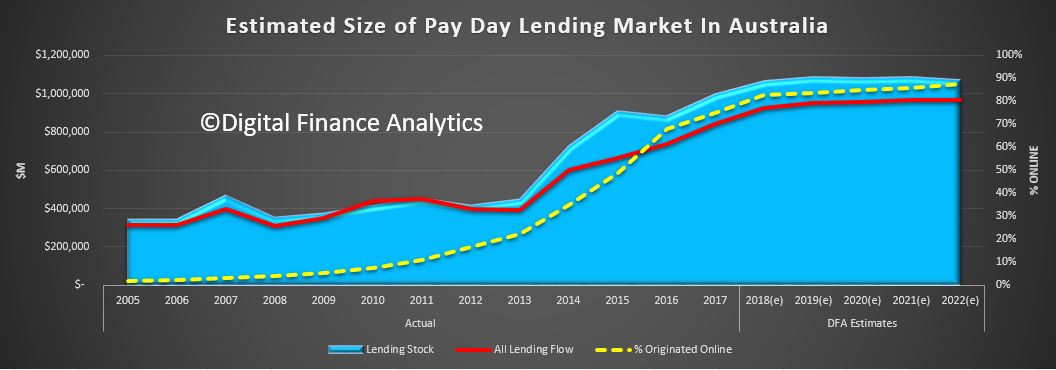
We monitor Pay Day lending – or Small Amount Credit Contracts (SACC) – as they should be called, via our surveys. We have just run our 2017 updates, and we find that SACC lending is still growing, and well above inflation and wage growth. A symptom of financial stress in the community .
Watch the video, or read the post.
But SACC lenders are targeting different borrowers now, and mainly via online channels.
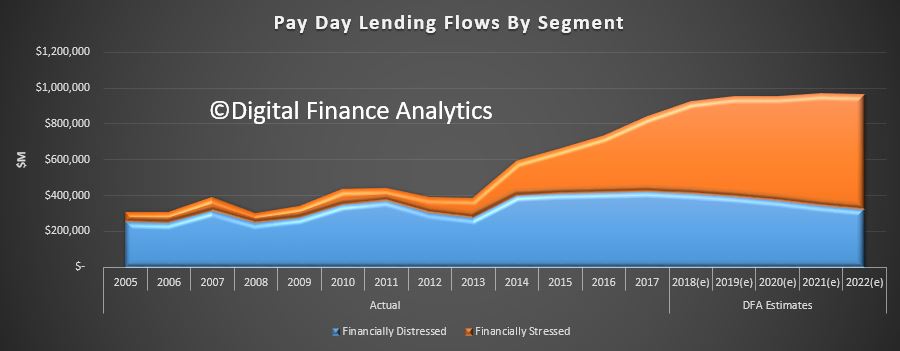
This first chart shows the relative lending flows split by distressed households and stressed households. Stressed households, we define as those with cash flow problems (often thanks to poor budgeting or over commitment) but many will have other financial assets, and even may own property. Most will be in employment. Lenders are targeting this group (especially using TV, radio and online channels) and there has been substantial growth.
Distressed households are those under financial pressure, often with limited employment, and are very likely to be on Government assistance. Recent tightening of the lending rules has reduced the share of lending to these distressed groups – which is a good thing.
The overall net effect is the total lending from Pay Day providers, including the many online players – has risen to around $842m flow and $994m stock. Growth in 2015 -2016 was 10.7% and 2016-17 was 14.5%. We expect growth at least 10% in 2018, perhaps higher.
The share of loans originated online continues to rise, from 48% in 2015, to more than 75% now, and it will continue to rise further. These online services are easy to access, and borrowers, once they sign up can get “special” deals.
The online environment is of course hard to police, but the interest rates offered by many players are right at the top end of the allowable range.
The latest changes to the SACC legislation are still in the works. But we think there should be a further review looking at the online lending environment. This is clearly where the action (and risks) are. By plugging the lending to our most vulnerable households, the industry has regrouped around more affluent but needy connected households. There are more to target, and the prospect of substantial growth.
For an outline and critique of the proposed payday lending* reforms, see the following articles by Gill North (Professor of Law at Deakin University and Joint Principal of Digital Finance Analytics)
‘Small Amount Credit Contract Reforms in Australia: Household Survey Evidence & Analysis’ (2016) 27 Journal of Banking and Finance Law and Practice 203
‘Small Amount Credit Contract Reforms: Will the Affordability Cap Achieve Its Intended Objectives Without Unintended Adverse Consequences?’ (2017) 32 Australian Journal of Corporate Law 1
‘Small Amount Credit Contract Reforms: Have Transparency and Competition Concerns Been Forgotten?’ (2017) 25 Competition & Consumer Law Journal 101
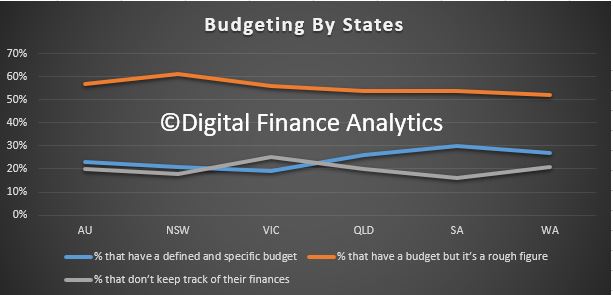
Recent research by AMP has found three quarters of Australians will be starting the year without a defined and specified budget, which will make sticking to our new financial goals tricky.
Whilst around half of households do some rough calculations, one fifth do not track spending at all, and this is true across all age bands and states. Our own surveys suggest that half of all mortgage holders do not budget effectively.
Michael Christofides, Director of Retail Solutions at AMP Bank, said the findings are worrying as budgeting is a critical part to achieving financial security.
“Knowing what you earn, owe and spend gives your greater control over your money and lets you quickly identify areas where you could be saving.
“The problem is that many people mistakenly think they are too busy to budget.
“But perhaps this is because many of us are still using back of the envelope and time-consuming techniques to try and track our finances.”
According to AMP’s research, over a third of Aussies (34 per cent) believe budgeting is too much effort and almost one in five Aussies (19 per cent) say budgeting takes too much time.Even if we do start off the year with good intentions – sitting down and creating an initial budget – over a quarter (27 per cent) of us won’t end up sticking to it.
The research also showed that regularly checking our bank accounts (47 per cent), paper (28 per cent) and excel (20 per cent) were the main ways we keep track of our budgets.
Mr Christofides said, “In this era of smart banking applications, Aussies don’t need to be spending time hunched over an excel spreadsheet – not when an application or smart bank account can do all the work for you with far greater accuracy, giving you far greater control.”
So maybe this year, if we are to meet our financial New Year’s resolutions, we should look to use technology to help us. Not only will it take away the time and effort of budgeting, it will help us to achieve our financial goals and resolutions in 2018.
Lenders are facing a dilemma, do they chase mortgage lending growth, and embed more risks into their portfolios, or accept the consequences of lower growth and returns as household debt explodes and we join the 200% Club!
Welcome to the Property Imperative weekly to 20 January 2018. We offer two versions of the update, the first a free form summary edition in response to requests from members of our community:
Alternatively, you can watch our more detailed version, with lots of numbers and charts, which some may find overwhelming, but was the original intent of the DFA Blog – getting behind the numbers.
Tell us which you prefer. You can watch the video, or read the transcript.
In our latest digest of finance and property news, we start with news from the ABS who revised housing debt upward, to include mortgage borrowing within Superannuation, so total Household Liabilities have been increased by approximately 3% to $2,466bn. The change, which required the accurate measurement of property investment by self-managed superannuation funds, brought the figure up from 194 per cent so we are now at 200% of income. A record which no-one should be proud of. It also again highlights the risks in the system. Australian households are in the 200% club.
The final set of data from the ABS – Lending Finance to November 2017 which also highlights again the changes underway in the property sector. Within the housing series, owner occupied lending for construction fell 0.88% compared with the previous month, down $17m; lending for the purchase of new dwellings rose 0.25%, up $3m; and loans for purchase of existing dwellings rose 0.11%, up $12m.
Refinance of existing owner occupied dwellings rose 0.28%, up $16m.
Looking at investors, borrowing for new investment construction rose 5%, up $65m; while purchase of existing property by investors fell $74m for individuals, down 0.75%; and for other investors, down $21m or 2.28%.
Overall there was a fall of $16m across all categories.
We see a fall in investment lending overall, but it is still 36% of new lending flows, so hardly a startling decline. Those calling for weakening of credit lending rules to support home price growth would do well to reflect that 36% is a big number – double that identified as risky by the Bank of England, who became twitchy at 16%!
Looking then across all lending categories, personal fixed credit (personal loans rose $70m, up 1.74%; while revolving credit (credit cards) fell $4m down 0.18%. Fixed commercial lending, other than for property investment rose $231m or 1.12%; while lending for investment purposes fell 0.25% or $30m. The share of fixed business lending for housing investment fell to 36.7% of business lending flows, compared with 41% in 2015. Revolving business credit rose $6m up 0.06%.
A highlight was the rise in first time buyer owner occupied loans, up by around 1,030 on the prior month, as buyers reacted to the incentives available, and attractor rates. This equates to 18% of all transactions. Non-first time buyers fell 0.5%. The average first time buyer loan rose again to $327,000, up 1% from last month. We do not think the data gives any support for the notion that regulators should loosen the lending rules, as some are suggesting. That said the “incentives” for first time buyers are having an effect – in essence, persuading people to buy in at the top, even as prices slide. I think people should be really careful, as the increased incentives are there to try and keep the balloon in the air for longer.
So, what can we conclude? Investment lending momentum is on the turn, though there is still lots of action in the funding of new property construction for investment – mostly in the high rise blocks around our major centres. But in fact momentum appears to be slowing in Brisbane, Sydney and Melbourne. This does not bode well for the construction sector in 2018, as we posit a fall in residential development, only partly offset by a rise in commercial and engineering construction (much of which is state and federal funded). What I’m noticing is that those in the construction sector – from small builders to sub-contractors – have significantly lower confidence levels than they did six months ago, based on our surveys.
Whilst lending to first time buyers is up, there are risks attached to this, as we will discuss later.
The good news is lending to business, other than for housing investment is rising a little, but businesses are still looking to hold costs down, and borrow carefully. This means economic growth will be slow, and potential wages growth will remain contained.
Fitch Ratings says Australian banks’ profit growth is likely to slow in 2018 as global monetary tightening pushes up funding costs, loan-impairment charges rise, and tighter regulation has an impact on business volumes and compliance costs from the 15 or so inquiries or reviews across the sector (according to UBS). They say Australian banks are more reliant on offshore wholesale funding than global peers, as the superannuation scheme here has created a lack of domestic customer deposits. Global monetary tightening could therefore push up banks’ funding costs. Indeed, The 10-Year US Bond yield is moving higher, and whilst the US Mortgage rates were only moderately higher today, the move was enough to officially bring them to the highest levels since the (Northern) Spring of 2017.
The main risks to banks’ performance stem from high property prices and household debt. Australian banks are more highly exposed to residential mortgages than international peers, while households could be sensitive to an eventual increase in interest rates or a rise in unemployment, given that their debt is nearly 200% of disposable income. Indeed, Tribeca Investment Partners said this week that local equities may be hurt by troughs in the domestic property market. “A heavily indebted household sector that is experiencing flat to negative real income growth, as well as dealing with higher energy and healthcare costs, and which has drawn down its savings rate, is unlikely to fill the gap in growth”
In local economic news, the latest ABS data on employment to December 2017, shows the trend unemployment rate decreased slightly to 5.4 per cent in December 2017, after the November 2017 figure was revised up to 5.5 per cent. The trend unemployment rate was 0.3 percentage points lower than a year ago, and is at its lowest point since January 2013.
The seasonally adjusted number of persons employed increased by 35,000 in December 2017. The seasonally adjusted unemployment rate increased by 0.1 percentage points to 5.5 per cent and the labour force participation rate increased to 65.7 per cent. The number of hours worked fell. By state, trend employment rose in NT, WA and SA. Over the past year, all states and territories recorded a decrease in their trend unemployment rates, except the Northern Territory (which increased 1.6 percentage points). The states and territories with the strongest annual growth in trend employment were Queensland and the ACT (both 4.6 per cent), followed by New South Wales (3.5 per cent).
The ABA released new research – The Edelman Intelligence research conducted late last year which tracks community trust and confidence in banks. Whilst progress may be being made, the research shows Australian banks are behind the global benchmark in terms of trust. Based on the Annual Edelman Trust Barometer study released in January 2017, Australia remains 4 points behind the global average.
The Australian Financial Review featured some of our recent research on the problem of refinancing interest only loans (IO). Many IO loan holders simply assume they can roll their loan on the same terms when it comes up for periodic review. Many will get a nasty surprise thanks to now tighter lending standards, and higher interest rates. Others may not even realise they have an IO loan!
Thousands of home owners face a looming financial crunch as $60 billion of interest-only loans written at the height of the property boom reset at higher rates and terms, over the next four years.
Monthly repayments on a typical $1 million mortgage could increase by more than 50 per cent as borrowers start repaying the principal on their loans, stretching budgets and increasing the risk of financial distress.
DFA analysis shows that over the next few years a considerable number of interest only loans (IO) which come up for review, will fail current underwriting standards. So households will be forced to switch to more expensive P&I loans, assuming they find a lender, or even sell. The same drama played out in the UK a couple of years ago when they brought in tighter restrictions on IO loans. The value of loans is significant. And may be understated.
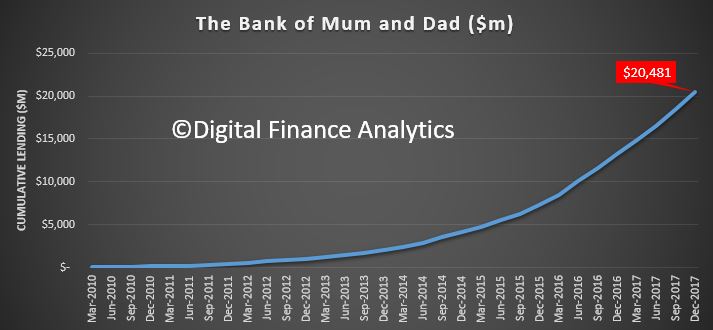
We also featured research on the Bank of Mum and Dad, now a “Top 10” Lender in Australia. Our analysis shows that the number and value of loans made to First Time Buyers by the “Bank of Mum and Dad” has increased, to a total estimated at more than $20 billion, which places it among the top 10 mortgage lenders in Australia. Savings for a deposit is very difficult, at a time when many lenders are requiring a larger deposit as loan to value rules are tightened. The rise of the important of the Bank of Mum and Dad is a response to rising home prices, against flat incomes, and the equity growth which those already in the market have enjoyed. This enables an inter-generational cash switch, which those fortunate First Time Buyers with wealthy parents can enjoy. In turn, this enables them also to gain from the more generous First Home Owner Grants which are also available. Those who do not have wealthy parents are at a significant disadvantage. Whilst help comes in a number of ways, from a loan to a gift, or ongoing help with mortgage repayments or other expenses, where a cash injection is involved, the average is around $88,000. It does vary across the states. But overall, around 55% of First Time Buyers are getting assistance from parents, with around 23,000 in the last quarter.
There was also research this week LF Economics which showed that some major lenders are willing to accept a 20% “Deposit” for a mortgage from the equity in an existing property, and in so doing, avoided the need for expensive Lenders Mortgage Insurance.
Both arrangements are essentially cross leveraging property from existing equity, and is risky behaviour in a potentially falling market. More evidence of the lengths banks are willing to go to, to keep their mortgage books growing. We think these portfolio risks are not adequately understood.
So, we conclude that banks are caught between trying to grow their books, in a fading market, by offering cheap rates to target new borrowers, and accept equity from existing properties, thus piling on the risk; while dealing with rising overseas funding, and in a flat income environment, facing heightened risks from borrowers as they join the 200% club.
That’s the Property Imperative Weekly to 20 January 2018. If you found this useful, do leave a comment, subscribe to receive future updates and check back for our latest posts. Many thanks for watching.
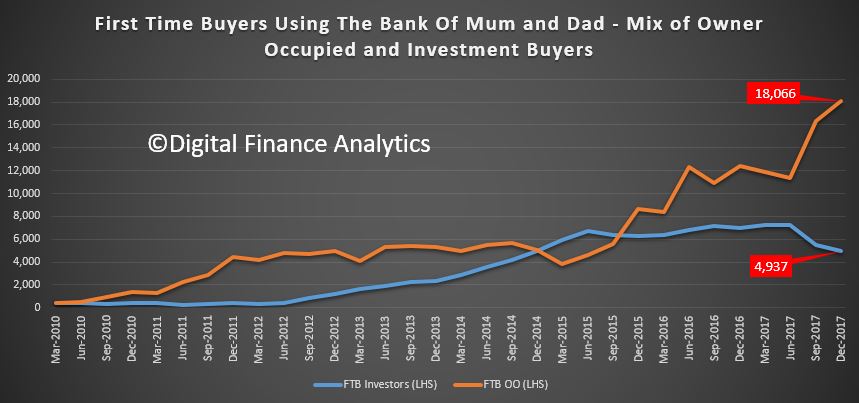
The latest Digital Finance Analytics analysis shows that the number and value of loans made to First Time Buyers by the “Bank of Mum and Dad” has increased, to a total estimated at more than $20 billion, which places it among the top 10 mortgage lenders in Australia.
We use data from our household surveys to examine how First Time Buyers are becoming ever more reliant on getting cash from parents to make up the deposit for a mortgage to facilitate a property purchase.
Savings for a deposit is very difficult, at a time when many lenders are requiring a larger deposit as loan to value rules are tightened. The rise of the important of the Bank of Mum and Dad is a response to rising home prices, against flat incomes, and the equity growth which those already in the market have enjoyed. This enables an inter-generational cash switch, which those fortunate First Time Buyers with wealthy parents can enjoy. In turn, this enables them also to gain from the more generous First Home Owner Grants which are also available. Those who do not have wealthy parents are at a significant disadvantage.
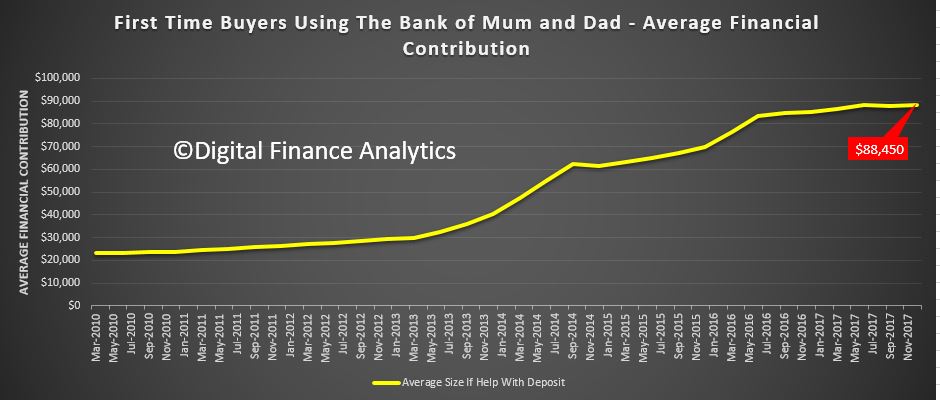
Whilst help comes in a number of ways, from a loan to a gift, or ongoing help with mortgage repayments or other expenses, where a cash injection is involved, the average is around $88,000. It does vary across the states.
We see a spike in owner occupied First Time Buyers accessing the Bank of Mum and Dad, while the number of investor First Time Buyers has fallen away.
But overall, around 55% of First Time Buyers are getting assistance from parents, with around 23,000 in the last quarter.
There are risks attached to this strategy, for both parents and buyers, but for many it is the only way to get access to the expensive and over-valued property market at the moment. Of course if prices fall from current levels, both parents and their children will be adversely impacted in an inter-generational financial embrace.
The Weekly ANZ/Roy Morgan, Australian Consumer Confidence Index jumped 4.7% to 122 last week, leaving it at the highest level since late 2013.
Strange considering some of the other indicators around, but then perhaps the holidays and ashes victory are colouring perspectives? Compare and contrast our monthly Finance Security Index, published yesterday, which granted looks from a different perspective, and uses December data.
“ANZ-Roy Morgan Australian Consumer Confidence starts the year on a high as the festive mood carries on to 2018,” said David Plank, head of Australian Economics at ANZ. “Continued strength in the labour market, and a strong performance in the Ashes series, likely helped sustain the cheer among consumers.”
“It needs to be acknowledged that consumer confidence usually rises in the first reading for January,” he says.
“Still, the increase this year is stronger than the 3.6% average lift in confidence for the past nine ‘annual turns’, indicating that the gain in confidence is more than just seasonal.
“Confidence has been trending higher since the low for 2017 in late August.”
Plank says that it’s encouraging that “consumers seemed willing to overlook their high debt burden, moderating house price gains and the impact of higher petrol prices”.
“We think the continued strong growth in employment is the key driver. We’ll find out in February when the next wages data is due whether a pick-up in wage growth has also contributed to the gain in sentiment.”
Explaining the lift in the headline index, ANZ said all five survey subindices rose last week, led by strong improvements in sentiment towards household finances and the economy.
“Consumers remained optimistic about financial conditions, which rose to the highest since early 2017. Both current and future financial conditions registered gains, rising 5.8% and 4.2% from last reported respectively,” Plank said.
“Economic prospects were also perceived to be much better. Current economic conditions rose 5.2% from last reported to 113.7, the highest since September 2013, while future economic conditions increased by 4.2% to 115.2.”
The final component within the survey — whether now was a good time to buy a household item — also rebounded, jumping 4.4%, offsetting a 1.2% fall in the final survey of 2017.
The strength in this component and the future financial conditions subindex is a good sign for household spending levels in the period ahead, helping to build confidence that the weakness seen in the September quarter last year may have reversed in recent months.
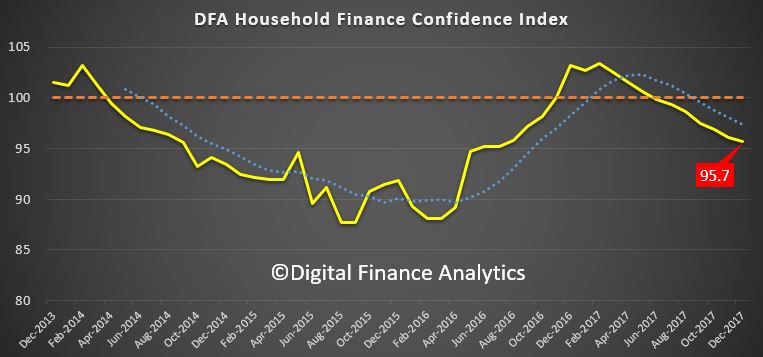
The latest edition of the Digital Finance Analytics Household Financial Security Confidence Index, to December 2017 shows another fall, down from 96.1 last month to 95.7 this time, and remains below the neutral measure of 100.
The trend continues to drift south as flat incomes, big debt and now falling home prices all impact.
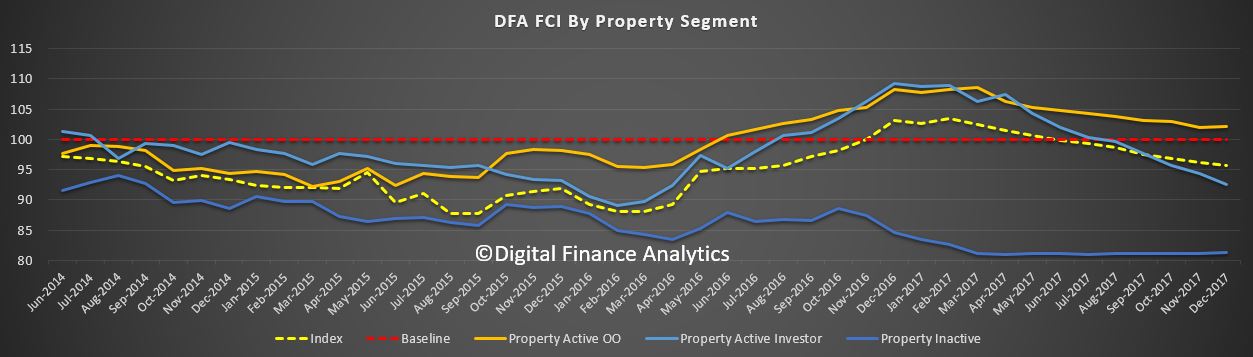
Analysis of households by their property owning status reveals that property investors are in particular turning sour, as flat net rental incomes, and rising interest rates hit many, at a time when property capital growth is stalling. Owner occupied households are faring a little better, thanks to a range of ultra cheap mortgage rates on offer at the moment, but they are also concerned about price momentum. Those without property interests remain the least confident, as the costs of renting outstrip income growth, and more are slipping into rental stress.
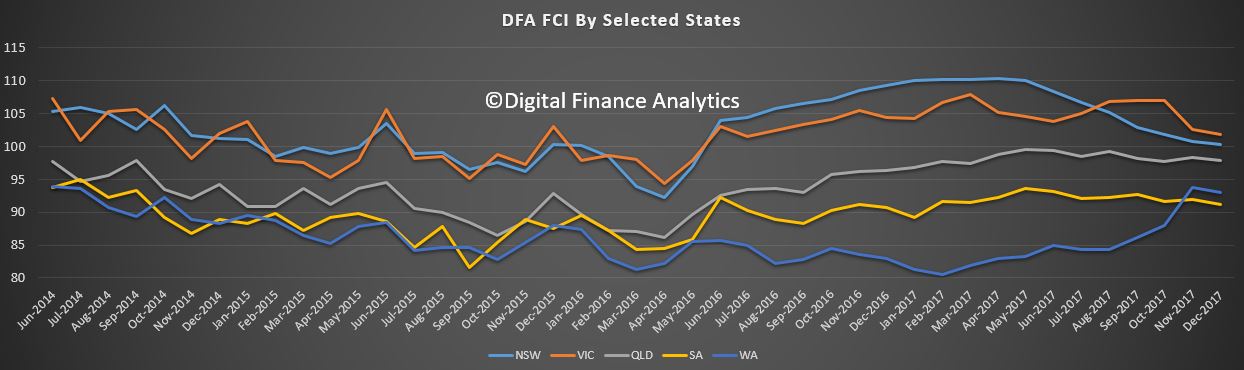
Looking across the states, they all slipped a little, with NSW now well behind VIC (we think the Victorian market is about 6 months behind Sydney, so will drift lower ahead). WA has not improved this time, suggesting that those talking up the market in the west may be over optimistic.
Across the age groups, young households are most concerned about their financial position, but every age group shows a small fall this month – perhaps thanks to the Christmas binge (though we think credit card debt will not rise that much this year) and retail stats may be lower than expected.
Looking in detail at the scorecard, which shows the elements which drive the index; job security is pretty stable, but savings are being raided by many to support their finances, while rates on bank deposits continue to drift lower. Households are becoming increasingly uncomfortable with the level of debt they hold (they should at a ratio of 2:1, debt to income). Income continues to fall in real terms and costs of living are rising (child care costs and rising fuel costs are concerning many). We also see a slide in net worth, as home prices, especially in the Sydney region decline. This despite high stock market prices at the moment.
We cannot see any circuit breakers in the mix ahead, so we expect the falling trend to continue into autumn.
By way of background, these results are derived from our household surveys, averaged across Australia. We have 52,000 households in our sample at any one time. We include detailed questions covering various aspects of a household’s financial footprint. The index measures how households are feeling about their financial health. To calculate the index we ask questions which cover a number of different dimensions. We start by asking households how confident they are feeling about their job security, whether their real income has risen or fallen in the past year, their view on their costs of living over the same period, whether they have increased their loans and other outstanding debts including credit cards and whether they are saving more than last year. Finally we ask about their overall change in net worth over the past 12 months – by net worth we mean net assets less outstanding debts.

 Source: NAB
 Source: NAB
 Source: NAB
 Source: NAB
 Source: NAB