NAB today announced their results for 1H 2015, which completes the updates from the major banks this week. Somewhat similar themes, with volumes up but lending margins down, offset by some deposit repricing and lower provisions. The hand of the regulator can be seen on the Australian home loan business, but significantly NAB outlined an exit path from the UK requiring capital, and other strategic initiatives, and a rights issue. No commentary on the potential demands by higher regulatory capital.
On a statutory basis, net profit attributable to owners of the Company was $3.44 billion, an increase of $584 million or 20.4% compared with March 2014. Cash earnings were $3.32 billion, an increase of $170 million or 5.4% with improved performances across all major businesses. This was in line with expectations. Excluding prior period UK conduct related charges, cash earnings rose 0.3%. Analysis of the results shows a trade off between volume growth and margin.
 Revenue increased 3.1%. Excluding gains on the UK Commercial Real Estate (CRE) loan portfolio sale and SGA asset sales, revenue rose 2.2% benefitting from higher lending balances, the impact of changes in foreign exchange rates, stronger Markets and Treasury income and increased NAB Wealth net income. Group net interest margin (NIM) declined 2 basis points over the year and 1 basis point when compared to the September 2014 half year.
 Expenses were broadly flat but excluding a fine paid in relation to UK conduct and prior period UK conduct related charges rose 4.0%. The increase mainly reflects the impact of changes in foreign exchange rates, investment in the Group’s priority customer segments and higher technology costs, combined with occupancy and Enterprise Bargaining wage increases.
Improved asset quality resulted in a total charge to provide for bad and doubtful debts (B&DDs) of $455 million, down 13.8%. This primarily reflects lower charges in UK Banking and NAB UK CRE. Compared to the September 2014 half year, the B&DD charge rose 30.4% due to releases from the Group economic cycle adjustment and NAB UK CRE overlay of $104 million in the prior period which were not repeated. Group asset quality metrics continued to improve over the period. The ratio of Group 90+ days past due and gross impaired assets to gross loans and acceptances of 0.85% at 31 March 2015 was 34 basis points lower compared to 30 September 2014 and 67 basis points lower compared to
31 March 2014.
The Group’s Basel III Common Equity Tier 1 (CET1) ratio was 8.87% as at 31 March 2015, an increase of 24 basis points from September 2014. As previously announced, the Group’s CET1 target ratio from 1 January 2016 remains between 8.75% – 9.25%, based on current regulatory requirements. The interim dividend is 99 cents per share (cps) fully franked, unchanged from the prior interim dividend, and below market expectations.
For the March 2015 half year the Group has raised approximately $17.3 billion of term wholesale funding. The weighted average term to maturity of the funds raised by the Group for the March 2015 half year was approximately 5.0 years.
The Group’s quarterly average liquidity coverage ratio as at 31 March 2015 was 118%. The ratio of collective provision to credit risk weighted assets was 1.01% at 31 March 2015 compared to 0.83% at 30 September 2014 with the increase over the period reflecting transition to AASB. The ratio of specific provisions to impaired assets was 35.5% at 31 March 2015, which compares to 35.3% at 30 September 2014 and 34.8% at 31 March 2014.
There were two significant strategic announcements in the results.
UK Exit – this was signalled in October 2014 as a result of the strategy to focus on the Australian and New Zealand franchise. Significant work has since been undertaken on various exit options, in particular public market options which offer increased certainty on the ability to transact and timing. While remaining open to a trade sale, NAB intends to pursue a public market option of a demerger of approximately 70-80% of Clydesdale Bank’s holding company National Australia Group Europe Ltd and its subsidiaries (Listco) to NAB shareholders and a sale of the balance by way of IPO (approximately 20-30%) to institutional investors. A demerger accelerates the full exit of the UK business, as opposed to a prolonged multi-staged public market sell-down, and allows an exit to be targeted by the end of this calendar year, subject to market conditions. The consequences for NAB will be a reduction in cash earnings on separation of Listco with shares in Listco to be received by NAB shareholders, whilst NAB cash ROE should increase on separation; the transaction expected to have a broadly neutral impact on NAB’s capital position excluding the capital support to Listco which will receive capital support of £1.7bn is, from separation, expected to be a full deduction from NAB CET1. Actual losses lower than £1.7bn should result in a capital release for NAB over time. Post separation, future actual conduct cost will be recognised by NAB within discontinued operations outside of cash earnings with no impact on capital (netted against £1.7bn support). � No impact on NAB’s credit ratings expected
NAB Wealth today announced it has received APRA approval for its life insurance arm to enter into a reinsurance arrangement with a major global reinsurer for approximately 21% of its in-force retail advised insurance book. The transaction is expected to release approximately $500 million of CET1 capital (13 basis points) to the NAB Group, and represents approximately 15% of NAB Wealth’s life insurance embedded value. This is expected to result in a reduction in NAB Wealth cash earnings of approximately $25 million per annum.
Also, NAB will be undertaking a 2 for 25 fully underwritten pro rata accelerated renounceable rights issue with retail rights trading (the Entitlement Offer) at an offer price of $28.50, to raise approximately $5.5 billion. Approximately 194 million new NAB ordinary shares are to be issued (approximately 8.0% of issued capital). New shares issued under the Entitlement Offer will rank equally with existing shares from the date of allotment. New shares will not however be entitled to the interim dividend for the half year ended 31 March 2015 of 99 cps because they will not be issued before the dividend record date.
Looking at the segmentals, Australian Banking cash earnings were $2,574 million, an increase of 4.0%, with revenue the key driver. Revenue rose 3.9% reflecting a stronger trading performance, combined with higher volumes of housing and business lending, partly offset by weaker margins. Expenses rose 3.8% driven by additional service roles and front line business bankers, combined with Enterprise Bargaining wage increases and higher technology costs. Cost to income rose by 10 basis points to 40.7%. Asset quality metrics continued to improve and B&DD charges of $366 million fell 2.4%, benefitting from lower business impairment activity partly offset by higher collective provision charges including a $49 million overlay for agriculture and resource sectors. NIM declined 3 basis points to 1.60% as a result of asset competition and lending mix impacts.
 Although NAB experienced above system growth in mortgages, margins on home lending were squeezed 5 basis points.
 Broker volumes grew from 30.2% to 30.9% of loans originated. There was a net 209 increase in brokers across aggregators PLAN, Choice and FAST – currently 3,700 affiliated brokers, and a 31% increase in white label transaction. LVR’s over 80% were circa 20% of transactions, and around 15% of book, with a slight fall above 90%.
 Looking at the loan portfolio mix, 28.8% of loans were for investment property (up from 28.2% in Sept 2014), and 35% of loans were interest only. The average balance was $276,000. 90 Day past due was 0.48% and impaired loans 0.14%. The loss rate is 0.03%. Home loan impairment is lower through the broker channels than proprietary channels (opposite to what the regulator says, by the way, but consistent with our own modelling).
 Steps are being taken to slow growth in investor mortgage lending to meet APRA’s 10% YoY threshold – currently 13%, and they say they are on track to comply with APRA’s best practice serviceability guidelines by June 2015 – floor rate comfortably above 7.0% and serviceability buffer comfortably above 2.0% (including buffer on existing debt). Interest only lending assessed on a principal and interest basis. This shows the regulator is having an impact and that lending criteria are tightening.
NZ Banking local currency cash earnings rose 4.5% to NZ$418 million with higher revenue given steady growth in lending volumes and improved margins (up 7 basis points, but with a 13 basis fall in lending margin, offset by 10 basis point rise in deposit margin, as well as funding and capital benefits) reflecting lower funding costs and benefits from both higher capital levels and higher earnings on capital. Costs rose 1.8% due mainly to increased personnel expenses, but were broadly flat compared to the September 2014 half year. Cost to income ratio rose 80 basis points to 40.2% B&DD charges were higher over the period with lower collective provision write-backs, but were flat over the six months to 31 March 2015 given the continued benign credit environment.
NAB Wealth cash earnings increased 28.2% to $223 million reflecting improved results from both the investments and insurance businesses, and lower operating expenses. Net income rose 8.0% due to improved insurance claims performance, stable lapses and growth in funds under management (FUM) as a result of strong investment markets, partly offset by lower investment margins related to a change in business mix. Cost to income ratio fell by 7.7% to 67.9%. There was no repeat of the insurance reserve increases seen in prior periods.
UK Banking local currency cash earnings grew 35.6% to £99 million driven by a further material reduction in B&DD charges as the business benefitted from improved economic conditions and loan portfolio shifts. Revenue was slightly weaker despite good growth in home lending volumes with competitive pressures resulting in NIM decline of 11 basis points from lending, points. Costs fell 1.2% (cost to income up 10 basis points to 70.3%) with increased restructuring and marketing spend more than offset by a one-off pension scheme gain in the March 2015 half year and conduct related charges that were incurred only in the March 2014 half year.

 Looking next at whether households expect to transact, we find that investors are mostly likely to make a purchase, but there is a continued rise among those wanting to refinance. 40% of those seeking to refinance expect to do so in the coming year.
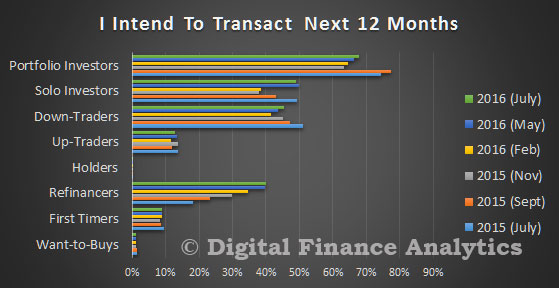 Turning to borrower expectations, first time buyers, those trading up, and portfolio investors are most likely to seek additional mortgage funding. In fact, as interest rates have fallen, demand is even stronger.
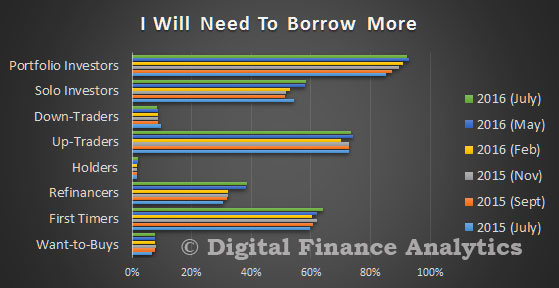 Those saving to assist in a purchase are mainly confined to households who are yet to transact, or who are trading up. More than 70 per cent of first time buyers wishing to purchase, continue to save.
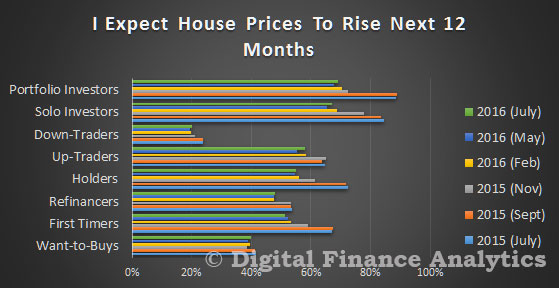
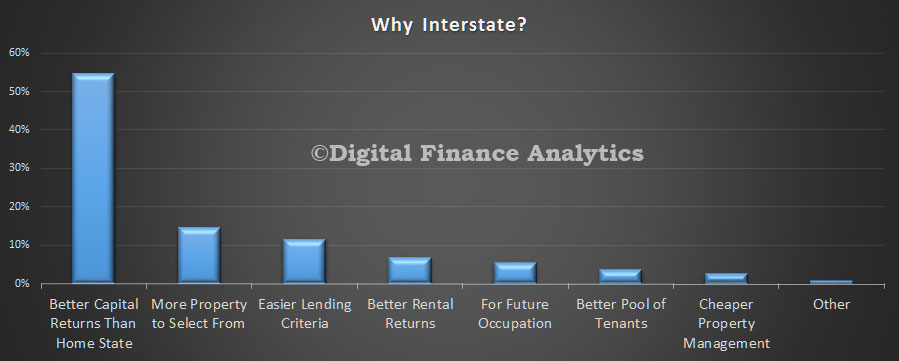
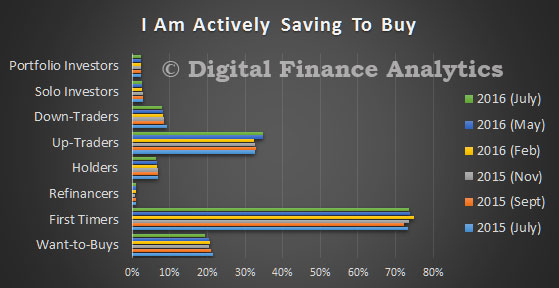 We will look in more detail at the forces which are driving investors in a later post, but this summary chart gives a good flavour of what we found. Tax efficiency is the single most powerful driver, and property capital appreciation is also important. Together these are perceived to give better returns that from deposits (in this low interest rate environment). Around 15 per cent of investors cited the low finance rates currently available.
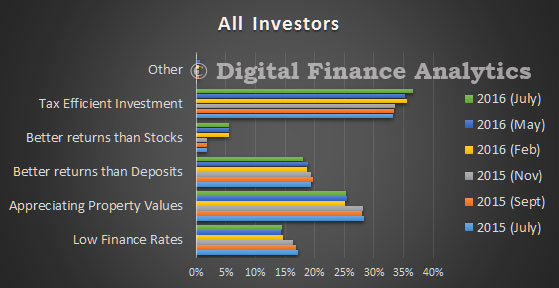 Finally, in this post, we look at which household segments are most likely to use a mortgage broker. Given that half of all new transactions are originated via this route, understanding which customer groups are most likely to reach of advice is important. Those seeking to refinance are most likely to transact via a broker.
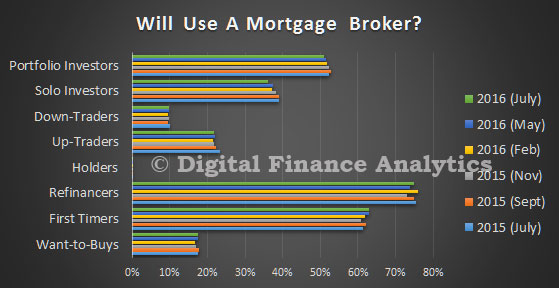 Next time we will look at some of the more detailed segment specific analysis. But in summary, whilst property transaction, and lending volumes may be falling, there is still strong demand for property. This will provide ongoing support for prices in the coming months, and also suggests that households will be seeking deals from lenders. There is life in the old dog yet!


 Go here to request a copy.