
I discussed the future of ATMs with Neil Mitchell on 3AW following the banks’ removal of withdrawal fees last year. Now many banks are removing these devices as usage falls, but should they have a social obligation (in the light of the Royal Commission)?
Category: Economics and Banking
More Data On The Downside – The Property Imperative Weekly 19th May 2018
Welcome to our latest summary of finance and property news to the 19th May 2018.

Watch the video or read the transcript.
Today we start with bank culture and the next round of the Royal Commission.New ASIC chairman James Shipton was at the Australian Council of Superannuation Investors conference in Sydney and was asked how seriously he was taking the threat to the financial system given the failures aired at the royal commission. He said the threat is great. As a former member of the finance profession – as a person who is proud to be a financier – I find it jarring and disappointing that this is where we find ourselves,” he said. As a proud Australian who is returning from nearly 25 years overseas, it is very confronting that we find ourselves in this situation. The misconduct discussed at the royal commission “must not stand, [it] must be addressed”
Mr Shipton also highlighted the “proliferation” of conflicts of interest in parts of the financial industry. “It is clear to me that a number of institutions have not taken the management of conflicts of interest to heart,” he said. “This is verging on a systemic issue. Indeed, it is the source of much of the misconduct ASIC has been responding to and which is being highlighted by the royal commission hearings.” Mr Shipton expressed his “surprise” that many Australian firms have “turned a blind eye” to conflicts of interest as their businesses have grown. “Too often, unacceptable conflicts were justified by firms on the basis that ‘everyone else is doing it’, even though it’s the right thing to do to end them .“A business culture that is blind to conflicts of interest is a business culture that does not have the best interests of its customer in mind. Moreover, it is one that is not observing the spirit as well as the letter of the law,” he said.
These are relevant comments in the light of the next round of the Royal Commission which starts on 21st May. This round of public hearings will consider the conduct of financial services entities and their dealings with small and medium enterprises, in particular in providing credit to businesses. The hearings will also explore the current legal and regulatory regimes, as well as self-regulation under the Code of Banking Practice. They will use the same case study approach.
They will be considering Responsible lending to small businesses, with ANZ, Bank of Queensland, CBA, Westpac and Suncorp on the stand. They will then consider the Approach of banks to enforcement, management and monitoring of loans to businesses with CBA / Bankwest and NAB. Third will be Product and account administration with CBA and Westpac; then the Extension of unfair contract terms legislation to small business contracts with ASIC and finally The Code of Banking Practice with ABA and ASIC. This should be worth watching, as we are expecting more cases of misconduct and poor behaviour. Our Small and Medium Business surveys highlight the problem many have with getting credit and being treated unfairly. There is a link below if you want to grab a free copy.
So now to the statistics. The ABS data this week painted a rather unsettling picture. The latest unemployment data to April 2018 showed that employment growth is slowing. The trend unemployment rate rose from 5.53 per cent to 5.54 per cent in April 2018 after the March figure was revised down, while the seasonally adjusted unemployment rate increased 0.1 percentage points to 5.6 per cent. The trend participation rate increased to a further record high of 65.7 per cent in April 2018 and in line with the increasing participation rate, employment increased by around 14,000 with part-time employment increasing by 8,000 persons and full-time employment by 6,000 persons in April 2018. But as we discussed in our separate post “Jobs Aren’t What They Use To Be” underutilisation – or those in work who want more work, continues to running at very high rates, and this helps to explain the low wages growth, which was also reported by the ABS this week. This showed a showed a further fall compared with last time with the seasonally adjusted Wage Price Index up 0.5 per cent in March quarter and 2.1 per cent through the year. Seasonally adjusted, private sector wages rose 1.9 per cent and public sector wages grew 2.3 per cent through the year to March quarter.
We discussed this in our post “Some Disturbing Trends”. In fact, you can mount an argument the federal budget is already shot as a result. The gap is large, and growing. And for comparison, the Average Compensation of Employees from the national accounts which is to December 2017 is tracking even lower circa 1.3%. And the latest inflation figure is sitting at 1.9%.
An article in The Conversation this week by Stephen Kirchner, from the University of Sydney, argued that the RBA is making an explicit trade-off between inflation and financial stability concerns which is weighing on Australians’ wages. In the past, the RBA focused more on keeping inflation in check, the usual role of the central bank. But now the bank is playing more into concerns about financial stability risks in explaining why it is persistently undershooting the middle of its inflation target. In the wake of the global financial crisis, the federal Treasurer and Reserve Bank governor signed an updated agreement on what the bank should focus on in setting interest rates. This included a new section on financial stability. That statement made clear that financial stability was to be pursued without compromising the RBA’s traditional focus on inflation. But the latest agreement, adopted when Philip Lowe became governor of the bank in 2016, means the bank can pursue the financial stability objective even at the expense of the inflation target, at least in the short-term. He concluded that when the RBA governor and the federal treasurer renegotiate their agreement on monetary policy after the next election, the treasurer should insist on reinstating the wording of the 2010 statement that explicitly prioritised the inflation target over financial stability risks. If the RBA continues to sacrifice its inflation target on the altar of financial stability risks, inflation expectations and wages growth will continue to languish and the economy underperform its potential.
International funding costs continue to rise with the US 10 Year Treasury rising this week, as yields were boosted after a report on U.S. retail sales for April indicated that consumer spending is on track to rebound after a soft patch in the first quarter. Yields have climbing higher since the Fed said on at its May meeting that inflation is moving closer to its 2% target. The Fed raised rates in March and projected two more rate hikes this year, although many investors see three hikes as possible.There is a strong correlation between the 10-year bond yield and the quantitate tightening which is occurring – making the point again that the rate rises are directly correlated with the change in policy.
Libor, the interbank benchmark continued to rise, as we discussed in our post “The Problem with LIBOR”. And this translates to higher mortgage rates in the US, with US headlines speaking of “the highest mortgage rates in seven years.
To be clear, we watch the US markets, and especially the capital market rates. because these movements impact the cost of bank funding and the Australian banks, especially the larger ones need access to these funds to cover perhaps 30% of their mortgage books. As a result, there is pressure on mortgage rates locally, with the BBSW reflecting some of this already.
Canada is another market worth watching, because it shares a number of the same characteristics as our own. The authorities tightened mortgage underwriting standards earlier in the year, and the results are now some significant slowing of purchase volumes, and home prices.
Significantly, the lenders are discounting new loans to try to maintain mortgage underwriting volumes in the fading market, which is similar to the dynamics here, with some Australian lenders now offering discounts to property investors for the first time in a year or so.
We hold our view that credit growth will continue to slow, as underwriting standards get tightened further. Investor lending has fallen by 16.1 per cent over the year to March, while owner-occupied lending is off by 2.2 per cent, according to the Australian Bureau of Statistics. The latest housing finance statistics show that lending to owner-occupiers fell by 1.9 per cent in March, the highest rate of decline in over two years; investor lending fell by 9 per cent over the month.
However, these figures are yet to reflect the latest round of credit tightening by the major banks, who face increased scrutiny amid damning evidence of irresponsible lending during the first round of the royal commission.
Both the major banks and the RBA expect credit growth to slow. We are now entering a “credit crunch”, which will reduce total mortgage volumes by around 10 per cent over the next year. The chances are that people will not be moving as swiftly as they had previously and not only is there lower demand now, particularly for property investors, but tighter lending criteria means that brokers will have to work a lot harder to get the information from clients and go through more hoops to get an application processed. Overall volumes will be down.
The Auction clearance rates continue lower, according to CoreLogic. Last week, a total of 2,279 auctions were held across combined capital cities, returning a final clearance rate of 58.2 per cent, the lowest clearance rate seen since late 2015. This time last year, the clearance rate was much stronger with 72.8 per cent of the 2,409 auctions returning a successful result.
Melbourne’s final clearance rate dropped to 59.8 per cent this week across 1,099 auctions making it the lowest clearance rate the city has seen since Easter 2014 (58.1 per cent).
Sydney’s final auction clearance rate fell to 57.5 per cent across 787 auctions last week, down from 63.1 per cent across 797 auctions over the previous week. Over the same week last year, 960 homes went to auction and a clearance rate of 74.5 per cent was recorded.
Across the smaller auction markets, Canberra, Perth and Tasmania saw clearance rates improve while clearance rates across Adelaide and Brisbane fell slightly. Of the non-capital city auction markets, Geelong returned the highest final clearance rate once again, with a success rate of 83.0 per cent across 50 auctions.
This week they expect to see a lower volume of auctions – 1,931, down from 2,279 last week. Melbourne is the busiest city for auctions again this week, with 948 auctions being tracked so far, down from 1,099 last week. Sydney has 637 auctions scheduled this week, down from 787 last week.
Adelaide and Perth are expecting to see a slight increase in auction volumes this week, with Adelaide tracking 102 auctions, up from 97 last week, while Perth currently has 43 auctions scheduled, up from 40 last week.
In terms of home price movements, prices are continuing to fall in all states last week, according to the CoreLogic Indices, other than Adelaide which was just a tad higher. Perth fell the most, down 0.11% followed by Sydney down 0.10%. The year to data movements, and the rolling 12-month view shows that Sydney is leading the way down. As we have said before, we think Melbourne is 6-9 months behind Sydney. But remember that the latest spate of lending tightening has yet to work though, so we expect prices to continue to fall. Of course prices are still well above those from the previous peak, with Sydney still up 60% and Melbourne up 44%. However, Perth is down 11%, and the overall average is 37% higher.
Finally, The Australian Financial Security Authority released the personal insolvency activity statistics for the March quarter 2018. In state and territory terms, personal insolvencies reached a record quarterly high in Western Australia (1,020) and the highest level since the September quarter 2014 in New South Wales (2,372). Total personal insolvencies in the March quarter 2018 increased slightly by 0.1% compared to the March quarter 2017. We discussed this data in more detail in our video “Some Disturbing Trends”
Given all the data we discussed today, we expect the insolvencies will continue to rise in the months ahead, as the impact of flat incomes, rising costs, and big debt continue to press home.
The Problem With LIBOR
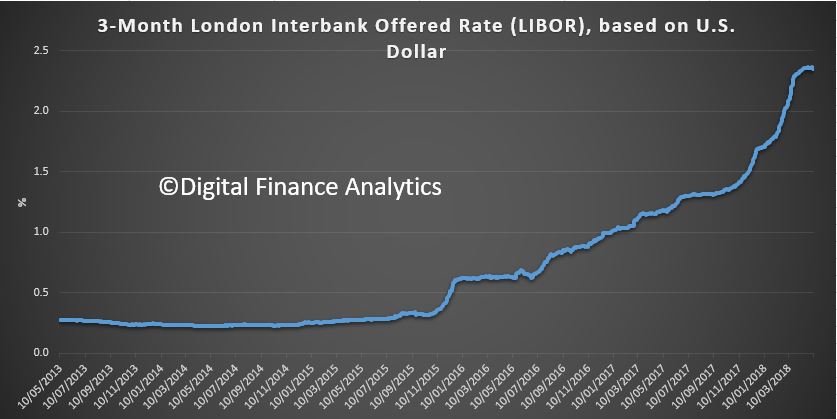
The cost of money continues to rise, and this includes the LIBOR benchmark rate, as shown by this chart. LIBOR or ICE LIBOR (previously BBA LIBOR) is a benchmark rate that some of the world’s leading banks charge each other for short-term loans. As it climbs, it signals rate rises ahead.
 But what is LIBOR, and more importantly, will it survive?
ICE LIBOR stands for Intercontinental Exchange London Interbank Offered Rate and serves as the first step to calculating interest rates on various loans throughout the world. LIBOR is administered by the ICE Benchmark Administration (IBA) and is based on five currencies: the U.S. dollar (USD), euro (EUR), pound sterling (GBP), Japanese yen (JPY), and Swiss franc (CHF). The LIBOR serves seven different maturities: overnight, one week, and 1, 2, 3, 6 and 12 months. There is a total of 35 different LIBOR rates each business day. The most commonly quoted rate is the three-month U.S. dollar rate (usually referred to as the “current LIBOR rate”), as shown in the chart.
So, LIBOR is the key interest rate benchmark for several major currencies, including the US dollar and British pound and is referenced in around US$350 trillion worth of contracts globally. A large share of these contracts have short durations, often three months or less. But it’s up for a shakeout as RBA Deputy Governor Guy Debelle Discussed recently.
Last year, the UK Financial Conduct Authority raised some serious questions about the sustainability of LIBOR. That is, apart from the rate fixing problems and the ensuing large fines.
The key problem is that there are not enough transactions in the short-term interbank funding market to reliably calculate the benchmark. In fact, the banks that make the submissions used to calculate LIBOR are uncomfortable about continuing to do this, as they have to rely mainly on their ‘expert judgment’ in determining where LIBOR should be rather than on actual transactions. To prevent LIBOR from abruptly ceasing to exist, the FCA has received assurances from the current banks on the LIBOR panel that they will continue to submit their estimates to sustain LIBOR until the end of 2021. But beyond that point, there is no guarantee that LIBOR will continue to exist. The FCA will not compel banks to provide submissions and the panel banks may not voluntarily continue to do so. There is no guarantee at all that will be the case.
So market participants that use LIBOR need to work on transitioning their contracts to alternative reference rates. The transition will involve a substantial amount of work for users of LIBOR, both to amend contracts and update systems. The process is not straightforward. A large share of these contracts have short durations, so these will roll off well ahead of 2021, but they should not continue to be replaced with another short-dated contract referencing LIBOR. A very sizeable number of current contracts would extend beyond 2021, with some lasting as long as 100 years.
So regulators around the world have been working closely with the industry to identify alternative risk-free rates that can be used instead of LIBOR. These alternative rates are based on overnight funding markets since there are plenty of transactions in these markets to calculate robust benchmarks. Last month, the Federal Reserve Bank of New York began publishing the Secured Overnight Financing Rate (SOFR) as the recommended alternative to US dollar LIBOR. For the British pound, SONIA has been identified as the alternative risk-free rate, and the Bank of England has recently put in place reforms to ensure that it remains a robust benchmark.
But these chosen risk-free rates are overnight rates, while the LIBOR benchmarks are term rates. Some market participants would prefer for the LIBOR replacements to also be term rates. While the development of term risk-free rates is on the long-term agenda for some currencies, they are unlikely to be available anytime soon. This reflects that there are currently not enough transactions in markets for term risk-free rates – such as overnight indexed swaps (OIS) – to support robust benchmarks. Given this reality, it is very important that users of LIBOR are planning their transition to the overnight risk-free benchmarks that are available, such as SOFR for the US dollar and SONIA for the British pound.
For the risk-free rates to provide an alternative to LIBOR, the next challenge is to generate sufficient liquidity in derivative products that reference the risk-free rates. This will take some time, particularly for the US dollar, where SOFR only recently started being published. Nevertheless, progress is being made, with the first futures contracts referencing SOFR recently being launched.
Market participants also need to be prepared for a scenario where the LIBOR benchmarks abruptly cease to be published. In such an event, users would have to rely on the fall-back provisions in their contracts. However, for many products the existing fall-back provisions would be cumbersome to apply and could generate significant market disruption. For instance, some existing fall-backs involve calling reference banks and asking them to quote a rate. To address this risk, the Financial Stability Board has encouraged ISDA to work with market participants to develop a more suitable fall-back methodology, using the risk-free rates that have been identified. But LIBOR is very different from an overnight risk-free rate as it includes bank credit risk and is a term rate. So the key challenge is to agree on a standard methodology for calculating credit and term spreads that can be added to the risk-free rate to construct a fall-back for LIBOR. This needs to be resolved as soon as possible, and we encourage users of LIBOR to engage with ISDA on this important work.
Finally, In Australia, the key InterBank Offer Rate benchmark for the Australian dollar is BBSW. Again we saw a spate of rate manipulations around BBSW, but the RBA and the Australian Securities and Investments Commission (ASIC) have been working closely with industry to ensure that it remains robust. The RBA argues the critical difference between BBSW and LIBOR is that there are enough transactions in the local bank bill market each day to calculate a robust benchmark. Australia has an active bank bill market, where the major banks issue bills as a regular source of funding, and a wide range of wholesale investors purchase bills as a liquid cash management product.
They think that BBSW can continue to exist even if credit-based benchmarks, such as LIBOR, are discontinued in other jurisdictions. But in the event that LIBOR was to be discontinued, with contracts transitioning to risk-free rates, there may be some corresponding migration away from BBSW towards the cash rate. This will depend on how international markets for products such as derivatives and syndicated loans end up adapting in a post-LIBOR world.
The infrastructure is already in place for BBSW and the cash rate to coexist as the key interest rate benchmarks for the Australian dollar. The OIS market is linked to the cash rate and has been operating for almost 20 years. It already has good liquidity at the short end, and the infrastructure is there for longer term OIS. A functioning derivatives market for trading the basis between the benchmarks is important for BBSW and the cash rate to smoothly coexist. Such a basis swap market is also in place, allowing market participants to exchange the cash flows under these benchmarks.
So the bottom line is that these Interbank Offer Rates are not as immutable as might be imagined, and this uncertainty is likely to continue for some time to come.
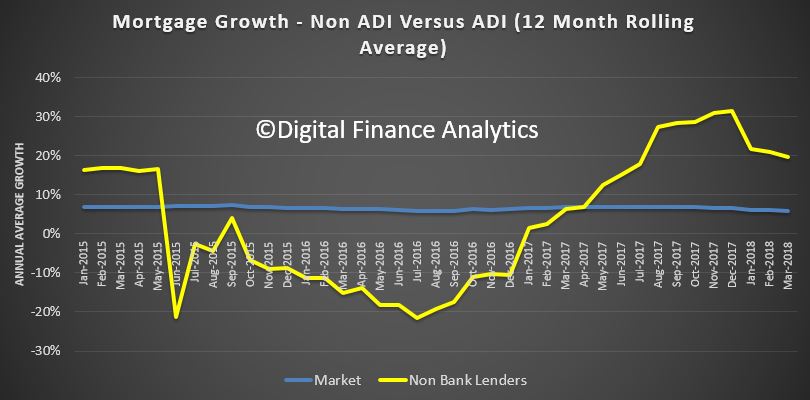
Non-banks winning prime mortgages as majors tighten
A credit crackdown among the big four banks has been a blessing for the non-ADI sector, with lenders seeing a significant boost in prime mortgage flows. We discussed this a few weeks back.
Credit has been tightening since 2014 and a raft of measures have been introduced to stem the flow of investor loans, interest-only mortgages and foreign buyers.
“A lot of that is narrowing what is prime credit for a bank,” Fitch Ratings’ head of APAC, Ben McCarthy, told the group’s 2018 Credit Insights Conference in Sydney on Wednesday.
“As the bank prime market gets smaller, things that were prime last year will end up in the non-bank space.
“Talking to some of the issuers just recently, some of them have commented on the potential outcomes for them as an individual lender. Non-banks are telling me that their volumes are increasing, but not in the areas that you might think. Interest-only volumes are falling and investor loans are relatively stable.”
Australia’s RMBS market is dominated by the non-banks, which rely on securitisation and warehouse funding to grow their books and continue lending.
In 2017, securitisation issuance was at its highest since the GFC. Last year saw $36.9 billion of RMBS issuance, of which $14.7 billion came from the non-banks. Only $8 billion of issuance was made up of non-conforming loans.
The strength of the non-bank sector has attracted US investors. Last year, KKR snapped up the Pepper Group, Blackrock purchased an 80 per cent stake in La Trobe Financial and private investment firm Cerberus Capital Management, L.P. acquired the APAC arm of Bluestone Mortgages.
With a bolstered balance sheet, Bluestone was recently able to edge closer to the prime mortgage space by introducing a new product and lopping 225 basis points off its rates.
Last month, the non-bank lender entered the near-prime space and made significant rate cuts to the Crystal Blue portfolio, which comprises full and alt doc products geared to support established self-employed borrowers (with greater than 24 months trading history) and PAYG borrowers with a clear credit history.
Speaking of the move, Royden D’Vaz, head of sales and marketing at Bluestone Mortgages, said: “The recent acquisition of the Bluestone’s Asia Pacific operations by Cerberus Capital Management has enabled a number of immediate opportunities to be realised — most notably the assessment of our full range of products and to ensure they fully address market demands.
“We’re now in an ideal position to aggressively sharpen our rates based on the new line of funding and pass on the considerable net benefit to brokers and end users alike.”
With many anticipating a significant slowdown in bank credit growth, driven by the evidence given during the Hayne royal commission, non-banks look well positioned to capture a greater slice of the prime and near-prime markets.
“Non-banks are becoming a bigger part of the market,” Fitch Ratings’ Mr McCarthy said. “That trend will increase.”
Is The RBA Myopic On Financial Stability?
The Reserve Bank of Australia (RBA) is making an explicit trade-off between inflation and financial stability concerns. And this could be weighing on Australians’ wages.

In the past, the RBA focused more on keeping inflation in check, the usual role of the central bank. But now the bank is playing more into concerns about financial stability risks in explaining why it is persistently undershooting the middle of its inflation target.
In the wake of the global financial crisis, the federal Treasurer and Reserve Bank governor signed an updated agreement on what the bank should focus on in setting interest rates. This included a new section on financial stability.
That statement made clear that financial stability was to be pursued without compromising the RBA’s traditional focus on inflation.
The latest agreement, adopted when Philip Lowe became governor of the bank in 2016, means the bank can pursue the financial stability objective even at the expense of the inflation target, at least in the short-term.
While the RBA board has explained its recent steady interest rate decisions partly on the basis of risks to financial stability, this sits uneasily with what the RBA otherwise has to say about underlying fundamentals of our economy.
It correctly blames trends in house prices and household debt on a lack of supply of housing, and not on excessive borrowing. These supply restrictions amplify the response of house prices to changes in demand for housing. RBA research estimates that zoning alone adds 73% to the marginal cost of houses in Sydney.
Restrictions on lending growth by the Australian Prudential Regulation Authority since the end of 2014 have been designed to give housing supply a chance to catch-up with demand and to maintain the resilience of households against future shocks.
The RBA argues that it needs to balance financial stability risks against the need to stimulate the economy through lower interest rates. But this has left inflation running below the middle of its target range and helps explain why wages growth has been weak.
The official cash rate has been left unchanged since August 2016, the longest period of steady policy rates on record. The fact that inflation has undershot its target of 2-3% is the most straightforward evidence that monetary policy has been too restrictive.
While long-term interest rates in the US continue to rise, reflecting expectations for stronger economic growth and higher inflation, Australia’s long-term interest rates have languished.
Australian long-term interest rates are below those in the US by the largest margin since the early 1980s. This implies the Australian economy is expected to underperform that of the US in the years ahead.
Inflation expectations (implied by Australia’s long-term interest rates) have been stuck around 2% in recent years, below the Reserve Bank’s desired average for inflation of 2.5%.
Financial markets can be forgiven for thinking the RBA will not hit the middle of its 2-3% target range any time soon. The RBA doesn’t believe it will either, with its deputy governor Guy Debelle repeating the word “gradual” no less than 12 times in a speech when describing the outlook for inflation and wages.
Inflation has been below the midpoint of the target range since the December quarter in 2014. On the RBA’s own forecasts inflation isn’t expected to return to the middle of the target range over the next two years.
The Reserve Bank blames low inflation on slow wages growth, claiming in its most recent statement on monetary policythat “labour costs are a key driver of inflationary pressure”. But this is putting the cart before the horse.
In fact, recently published research shows that it is low inflation expectations that are largely to blame for low wages growth.
Workers and employers look at likely inflation outcomes when negotiating over wages. These expectations are in turn driven by perceptions of monetary policy.
Below target inflation makes Australia less resilient to economic shocks, not least because it works against the objective of stabilising the household debt to income ratio. Subdued economic growth and inflation also gives the economy a weaker starting point if and when an actual shock does occur, potentially exacerbating a future downturn.
When the RBA governor and the federal treasurer renegotiate their agreement on monetary policy after the next election, the treasurer should insist on reinstating the wording of the 2010 statement that explicitly prioritised the inflation target over financial stability risks.
If the RBA continues to sacrifice its inflation target on the altar of financial stability risks, inflation expectations and wages growth will continue to languish and the economy underperform its potential.
Author: Stephen Kirchner, Program Director, Trade and Investment, United States Studies Centre, University of Sydney
HashChing White Labels
Australian mortgage marketplace HashChing is launching its own branded home loans for the first time, claiming to offer some of the lowest rates in Australia, and one of the fastest approval times on the market available through the mortgage brokers.

They say this is an opportunity for Australians to access highly competitive deals that are independent of the big four and large financial institutions, whose shady lending practices have been recently exposed by the Royal Commission.
Mandeep Sodhi, CEO of HashChing, said that securing a competitive rate with the banks is a stressful experience for most Australian borrowers.
“Even a slight difference in an interest rate can cost the average homeowner thousands of dollars each year,” said Mr Sodhi.
“That’s why so many Australians access the market through a mortgage broker, but finding a broker that aligns with their interests can also be challenging. This is what motivated us to launch HashChing and what has motivated us to offer competitive home loans through our platform.”
The new home loan product, which can only be accessed by HashChing mortgage brokers, gives borrowers access to approval within an impressive 24 hours, one of the fastest approval times available to Australians through the mortgage brokers.
“Timing can be the difference between owning your own dream home or missing out on the opportunity of a lifetime. The big banks typically take 4 to 5 days to complete an approval process, so we’re confident we can offer a service in this area that they cannot compete with.
“On top of that, our core business is offering instant access to the top rated mortgage brokers in any area who do all the legwork at no cost to borrowers, meaning we now offer a front to back mortgage service with some of the most competitive deals on market.”
HashChing started to initially solve the pain point of finding a community rated local broker in the area. The move to offer home loans through the platform is part of the greater expansion plans for HashChing, which is currently raising $5 million through crowdfunding platform Equitise.
HashChing is independent of the big banks and has chosen to undertake crowdfunding as a means to raise money while staying independent of any ownership by the banks. The funds will help to improve and expand the company’s current business activities and enable it to continue looking for ways to improve on the home loan process and offer better rates to borrowers.
Mr Sodhi said: “One of the main reasons we chose equity crowdfunding was because we wanted to stay independent. Unlike many other online mortgage platforms who are backed by a lender, we are and will continue to stand separate from the banks. We want our customers to become shareholders in HashChing and help us deliver the simple and effective end-to-end home loan journey that Australia is currently lacking.
“We look for ‘win-win’ opportunities, whereby if our customers do well, we do too – and vice versa. One such opportunity is allowing customers to own a piece of HashChing and benefit from any success we have. We’ve built this business on the ability to put more money back into the pockets of homeowners and not the banks, and this crowdfunding opportunity extends that vision to give our loyal customers and everyday Australians an opportunity to invest in a fast-growing disruptive start-up that they believe in.”
HashChing is Australia’s first online marketplace allowing consumers to access great home loan deals without having to shop around. Completely free to consumers, HashChing connects customers directly with verified mortgage brokers who further negotiate better rates from lenders, saving valuable time and money.
Equitise is an online equity crowdfunding platform connecting start-ups and high growth businesses, with a broad range of investors. We help businesses grow and thrive in a simple, intuitive and social way by disrupting the investment marketplace and removing the traditional funding barriers and costs.
Mortgage Brokers Heyday Over?
Slower credit growth and reduced borrowing capacity are expected to wipe 10 per cent off volumes this year, but brokers may find a silver lining in their trail commissions.

Investor lending has fallen by 16.1 per cent over the year to March, while owner-occupied lending is off by 2.2 per cent, according to the Australian Bureau of Statistics.
The latest housing finance statistics show that lending to owner-occupiers fell by 1.9 per cent in March, the highest rate of decline in over two years; investor lending fell by 9 per cent over the month.
However, these figures are yet to reflect the latest round of credit tightening by the major banks, who face increased scrutiny amid damning evidence of irresponsible lending during the first round of the royal commission.
Both the major banks and the RBA expect credit growth to slow.
Digital Finance Analytics principal Martin North believes that we are now entering a “credit crunch”, which will reduce total mortgage volumes by around 10 per cent over the next year.
Mr North said that the changing credit landscape paints “a complex picture” for brokers.
“The chances are that people will not be moving as swiftly as they had previously, so you might find that, in fact, the trail commissions go on for longer, which is a good piece of news,” Mr North said.
“But in terms of new business volumes, not only is there lower demand now, particularly for property investors, but tighter lending criteria means that brokers will have to work a lot harder to get the information from clients and go through more hoops to get an application processed. Overall volumes will be down.
“My own feeling is that we haven’t yet seen the full impact of the tightening that is happening as we speak. I’m predicting about a 10 per cent fall in volumes over the next year.”
Mr North told The Adviser that cooling property prices may force some property owners in Sydney and Melbourne to capitalise on years of growth, sell up and downsize.
However, he believes that first home buyers are unlikely to fill the gap and that any government incentives are now failing to encourage new mortgage sales. The latest ABS figures show that the percentage of FHBs fell to 17.4 per cent over March.
In addition to tighter credit conditions, mortgage brokers also face increased compliance in response to a slew of inquiries.
“This may mark the point in the cycle where some brokers decide to quit the industry,” Mr North said. “You may end up with a smaller number of brokers. I think there will be a bit of a shake-out.”
Greater scrutiny and increased regulation is the primary driver of tighter lending conditions. However, with the RBA signalling that the next cash rate movement will be up, Mr North sees little indication that the situation will change.
“I don’t think there is anything that will reverse that any time soon,” the principal said. “If anything, rates will go up, further tightening credit. I don’t think this is a temporary shift; it’s a realignment of the market. People need to start planning their businesses on a different trajectory.
The Economic Outlook (According to the RBA)
We got some more data on the state of the Australian Economy today from RBA Deputy Governor, Guy Debelle, which built on the recently released Statement on Monetary Policy (SMP).
There were four items which caught my attention.
First, the recent rise in money market interest rates in the US, particularly LIBOR. He said there are a number of explanations for the rise, including a large increase in bill issuance by the US Treasury and the effect of various tax changes on investment decisions by CFOs at some US companies with large cash pools. 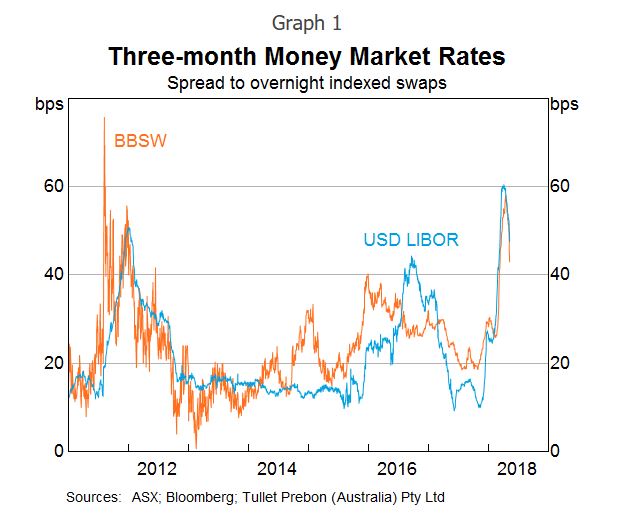 This rise in LIBOR in the US has been reflected in rises in money market rates in a number of other countries, including here in Australia. This is because the Australian banks raise some of their short-term funding in the US market to fund their $A lending, so the rise in price there has led to a similar rise in the cost of short-term funding for the banks here; that is, a rise in BBSW. This increases the wholesale funding costs for the Australian banks, as well as increasing the costs for borrowers whose lending rates are priced off BBSW, which includes many corporates.
However, he says the effect to date has not been that large in terms of the overall impact on bank funding costs. It is not clear how much of the rise in LIBOR (and hence BBSW) is due to structural changes in money markets and how much is temporary. In the last couple of weeks, these money market rates have declined noticeably from their peaks. But to my mind it shows one of the potential risks ahead.
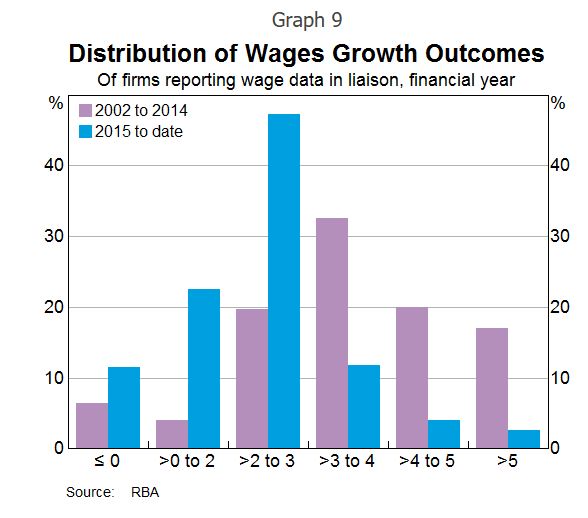
Second the gradual decline in spare capacity is expected to lead to a gradual pick-up in wages growth. But when? The experience of other countries with labour markets closer to full capacity than Australia’s is that wages growth may remain lower than historical experience would suggest. In Australia, 2 per cent seems to have become the focal point for wage outcomes, compared with 3–4 per cent in the past. Work done at the Bank shows the shift of the distribution of wages growth to the left and a bunching of wage outcomes around 2 per cent over the past five years or so.
 The RBA says that recent data on wages provides some assurance that wages growth has troughed. The majority of firms surveyed in the Bank’s liaison program expect wages growth to remain broadly stable over the period ahead. Over the past year, there has been a pick-up in firms expecting higher wage growth outcomes. Some part of that is the effect of the Fair Work Commission’s decision to raise award and minimum wages by 3.3 per cent. They suggest there are pockets where wage pressures are more acute. But, while those pockets are increasing gradually, they remain fairly contained at this point
But he concluded that there is a risk that it may take a lower unemployment rate than we currently expect to generate a sustained move higher than the 2 per cent focal point evident in many wage outcomes today.
Third, he takes some comfort from the fact that arrears rates on mortgages remain low. This despite Wayne Byres comment a couple of months back, that at these low interest rates, defaults should be even lower! Debelle said that even in Western Australia, where there has been a marked rise in unemployment and where house prices have fallen by around 10 per cent, arrears rates have risen to around 1½ per cent, which is not all that high compared with what we have seen in other countries in similar circumstances and earlier episodes in Australia’s history. To which I would add, yes but interest rates are ultra-low. What happens if rates rise as we discussed above or unemployment rises further?
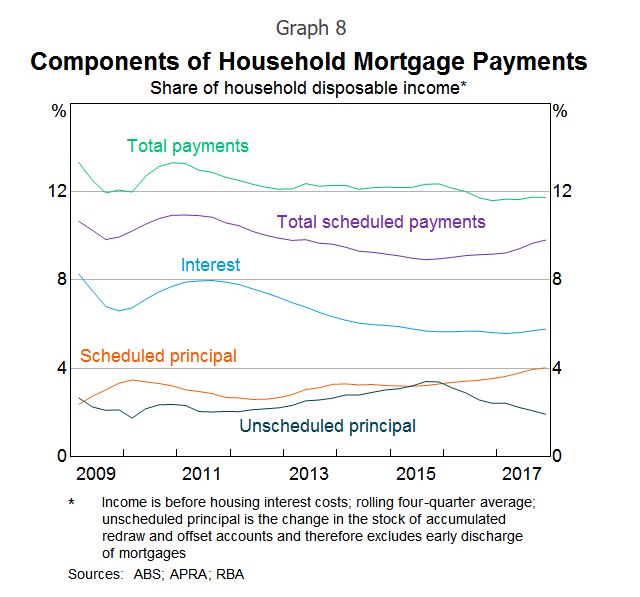
Finally, the interest rate resets on interest-only loans will potentially require mortgage payments to rise by nearly 30–40 per cent for some borrowers. There are a number of these loans whose interest-only periods expire this year. It is worth noting that there were about the same number of loans resetting last year too. The RBA says there are quite a few mitigants which will allow these borrowers to cope with this increase in required payments, including the prevalence of offset accounts and the ability to refinance to a principal and interest loan with a lower interest rate. While some borrowers will clearly struggle with this, our expectation is that most will be able to handle the adjustment so that the overall effect on the economy should be small.
This switch away from interest-only loans should see a shift towards a higher share of scheduled principal repayments relative to unscheduled repayments for a time. We are seeing that in the data. It also implies faster debt amortisation, which may have implications for credit growth.
 And there is a risk of a further tightening in lending standards in the period ahead. This may have its largest effect on the amount of funds an individual household can borrow, more than the effect on the number of households that are eligible for a loan. This, in turn, means that credit growth may be slower than otherwise for a time. That he says has more of an implication for house prices, than it does for the outlook for consumption. To which I would add, yes, but consumption is being funded by raiding deposits and higher debt. Hardly sustainable.
So in summary, there are still significant risks in the system and the net effect could well drive prices lower, as credit tightens. And I see the RBA slowly turning towards the views we have held for some time. I guess if there is more of a down turn ahead, they can claim they warned us (despite their settings setting up the problem in the first place).
Should I Sell Now?
Back in January I published a video entitled “To Buy, Or Not To Buy, That IS indeed the Question” which addressed the question of should I buy property now. It’s still available, and as current as ever it was.
 But as we have seen prices slide further, which we showed in yesterday’s edition of the Property Imperative Weekly, one question is coming up more often from our community. That is, should I SELL now – ever more relevant as the future direction looks to be south, so reducing the paper value of property – to which the answer is, it depends.
Once again, a necessary caveat, as this is not financial advice, and your mileage may vary, but I think there are some principles which are worth exploring in general terms. So today, I am going to touch on some of the most important ones.
Owner Occupiers
First, I think the answer will vary by the type of property holder. For those owning a property to live in – for owner occupation – to provide shelter – you may have reason to switch properties perhaps because of moving with a job, or to trade up, to get more space, or to trade down, to get a smaller place, and possibly release capital on the way through.
Now here is an important point. One property is worth one property. You only need one property. Just one. So at any point in the market cycle, if you sell to buy, you are crystallising value in your existing property at the point in time you sell, and commit to buy a new place at the same time. So in a relative sense, if you buy and sell, you transact at a specific point in time. And even if values have fallen, so you have lost some paper equity in your existing place, the property you are buying may well have fallen also, though of course different markets may be moving at different rates, and even different types of property may have moved differentially. But generally, selling and buying can actually be done at any time, provided of course there are properties to buy, and prospective purchasers for your existing place. It might be much harder if the market itself has frozen.
But often you will have a mortgage on your existing place and you are selling, and often that needs to be repaid from the proceeds of sale. That’s fine provided you have sufficient equity, even if the capital value has fallen, but could be a real barrier if the value of the mortgage is higher than the property – so called negative equity. And if fact, it is negative equity which can become the barrier to switching property, as we have seen in other markets where prices fell 30-40%.
But if you have sufficient equity to repay the mortgage, and need a mortgage on a new place, you may have to apply afresh. Of course bear in mind that lending standards may have become tighter so you might not be able to get the same value of loan as previously, and this is also true if your circumstances have changed. So it is worth checking this out early. Generally, mortgage borrowing power has been reduced in recent months.
Or perhaps your mortgage is portable.
In fact, loan portability is often a standard on all home loans – but you may have to ask, and sometimes it’s not obvious. This means if you choose to move houses, you can take your loan with you. So in this case you are to transfer your existing loan to another property without having to go through the process of refinancing. But you will need to ask the lender for the “hidden” rules and parameters, and generally, you may have to pay slightly more for the flexibility of portability. And overseas, some lenders even allowed negative equity to be transferred to facilitate a move.
Sometimes people will try to sell, rent, and wait for the market to fall further, before buying. That might work, but you are essentially taking a bet on the market. You might be right; you could be wrong. As I have said before predicting future home price movements is a mugs game, and most predictions will be wrong. There are too many moving parts.
Finally, if you are trading down, – seeking a smaller place, to release capital, you may want to bring the transaction forward, because larger value homes are falling faster than smaller ones. On the other hand, those seeking to trade up, and get a larger place might do better to wait, as prices may fall so you can get a larger place for less money. But again, you are betting on the market, and you may be wrong.
A Forced Sale
One other scenario to consider is being forced to sell, perhaps because the mortgage repayments are just too demanding. In fact, given we have nearly 1 million households in mortgage stress, and flat incomes, the number facing difficulty is increasing. Now the banks have an obligation to assist in cases of hardship, and they may be able to restructure the loan, or even waive interest payments for a bit in this case. They are also loathe to push people out of their homes – as a forced sale – as this risks significant negative publicity and also may reduce the value of the property in the process. But they often “encourage” stressed households to sell, and we are seeing a rise among these households. So households come to accept there is no way out but to sell. In this situation it is probably better to sell sooner rather than later, as in our experience in the current environment the cure rate is very low, unless the problem is created by a short term health or employment hiatus. But often it’s a matter of the income just consistently not covering expenditure. So selling in these circumstances can be a positive circuit breaker, and in a falling market, selling sooner may yield higher net returns.
Property Investors
So now to property investors. The equation here is quite different. We are already seeing some sassy property investors selling, to realise the capital gains they have achieved, remember value is not true value until it is crystallised. In some cases, this is to reinvest in the smaller markets of Adelaide and Hobart, where capital gains are for the moment still being seen. Though that may change.
For some investors, its simply that the net rental yield – the flow of rental payments, less the costs of managing and maintaining the property are now net negative, so unless you can see rapid capital growth and offset losses again other income it might be time to sell.
Our latest data shows that about half of all rentals are underwater on a cash flow basis, especially in Victoria and NSW. Some other states, such as Queensland are doing somewhat better, mainly because values have not lifted so high, and so mortgages relative to rental streams are smaller. So it pays to shop around – as the outcomes are remarkably different. The fact is for many, the true “all in” returns, even allowing for capital appreciation, are remarkably low – and many investors do not do the calculations to know the real picture. They would get a nasty surprise. And if capital values continue to fall, yields will drop also. And in addition, rental rates are more connected with incomes, than home prices, so changes in capital value, or even mortgage rates, do not get reflected in the majority of rents. This is a pre-tax picture by the way.
Talking of tax, the current generous tax incentives are used by many, especially more affluent households, to reduce their effective taxable income. This is why the Government can say that the majority of negatively geared investors do not have large incomes – it is stating the obvious, as net taxable income is after all the tax manipulation!
Some investors are choosing to sell, to lock in significant capital gains (and again the tax breaks are generous), fearing that values may fall ahead. Others are being forced to sell to meet or avoid higher mortgage repayments as they move from interest only loans to principal and interest loans. This is especially true for those holding multiple properties – and many have more than 5, and some more than 20 leveraged investment properties. So they sell to cover the costs on the remaining ones.
And once again it is important to remember mortgage underwriting standards are much tighter now – including a 20% haircut on rental streams to cover times when the property is vacant, a repayment assessment made on a pre-tax not post-tax position and on a principal and interest basis – even if applying for an interest only loan. And significantly more questions, and evidence required to get a loan if you are materially dependent on the rental streams to cover the costs of the mortgage.
Remember too that Labor would freeze negative gearing for most new transactions (but they do not plan retrospective changes, so existing negatively geared loans would be more attractive to retain) and they may still have tax breaks for newly built property. There are no details as yet.
Generally, in a downturn, its investors who flee the market first – as data from Ireland and the UK both show. This is why investor mortgages are more risky – the Bank of England says four times more likely to default.
So my perspective would be investors might seriously want to review their portfolios, and estimate the true net returns. Given many will have paper profits on capital gains over recent years, there is a strong logic to sell.
But again, it does depend on your view of future home price movements. As you know, we hold the view that prices are correlated with loan availability, and as because loans are now harder to come by, property prices have further to fall. They are at least 30% overvalued compared with their true economic value.
In Summary
So the bottom line is this. Property Investors have more of a burning platform to take action and consider selling before prices fall further. Down Traders also would be in a similar position as they are also seeking to lock in capital growth. On the other hand, Up Traders may prefer to wait – assuming prices will fall further. And those owners occupied sellers, who need to move, should probably, do so in any case, with the caveat that the mortgages available now will be smaller than they were a few months again.
Again, to reiterate, this is not financial advice, and it’s just my – hopefully informed – opinion, but you would need to get more specific guidance based on your individual circumstances.
The Great Credit Crunch – The Property Imperative Weekly 12 May 2018
Welcome to The Property Imperative Weekly to 12 May 2018.
In this week’s review of the latest finance and property news we look at the impact of the impending credit crunch. Watch the video or read the transcript.
The evidence is mounting that we are entering a credit crunch, driven by tighter lending restrictions, and the recent revelations from the Royal Commission. And the implications of this are profound, not just in terms of the immediate impact on home prices, but also, and perhaps more significantly, on the broader economy. Housing and finance for housing has formed a significant plank in the trajectory of the economy over recent years and when coupled with construction activity it has supported the transition from the mining boom. But now that could change, and the impact on households and the broader economy is potentially profound, as borrowers deal with massively higher debt levels, and the inability to spend as a result; and new loans harder to get. As a result, home prices will fall, further and harder. Let’s look at the evidence.
First there is a quite a strong relationship between auction volumes and home price growth. This is why we watch the auction results so closely. Now we know there is a lot of noise in the system because of the way auction volumes are reported – for more on that watch our separate video – Auction Results Under The Microscope, but CoreLogic reported that the auction volumes fell last week. There was a total of 2,311 auctions held, which returned a final clearance rate of 62.1 per cent. Over the same week last year, the clearance rate was much stronger with 73.0 per cent of the 1,689 auctions cleared. Melbourne’s final clearance rate has been fairly stable over the last 3 weeks. Last week’s final clearance rate came in at 63.7 per cent across 1,144 auctions, compared to 63.9 per cent across 1,334 auctions the previous week. This time last year, 792 homes went under the hammer, returning a clearance rate of 77.5 per cent. Sydney’s final auction clearance rate increased to 63.1 per cent across 797 auctions last week, after falling to 55.8 per cent across 829 auctions over the previous week, the lowest clearance rate recorded across the city all year. Over the same week last year, 592 homes went to auction and a clearance rate of 73.8 per cent was recorded. Across the smaller auction markets, Canberra was the only city to see an increase in auction volumes with 102 auctions held, up from 92 over the previous week. Clearance rates were varied with Adelaide, Brisbane and Perth recording lower clearance rates week-on-week. Of the non-capital city auction markets, Geelong returned the highest final clearance rate of 75.0 per cent across 58 auctions.
They are expecting lower auction volumes this Saturday with Melbourne, the busiest city at 1,012 auctions being tracked so far, down from 1,144 last week while Sydney has 696 auctions scheduled this week, down from 797 last week.
Lending criteria are tighter now with a focus on real expenses, supported by evidence. (Why this was not happening previously is a whole other discussion). Our household surveys reveal that more households simply cannot meet the current new and tighter borrowing requirements. Borrowing power has been reduced – significantly. For example, in one scenario, take a household with incomes of close to $200k. Previously they might have been able to get a $1million loan, but now if they provide more detailed expenses – including the fact they pay for child care, their borrowing power will now be scaled back closer to $650,000. Most lenders are applying stricter criteria – though we see in our data the non-banks are still more flexible. But the lending tap is being turned down, significantly.
It is already impacting the ABS housing finance data to March 2018. The trends are pretty clear, lending is slowing, and bearing in mind our thesis that lending and home prices are inextricably linked, this signals further home price falls ahead, which will be exacerbated by even tighter lending standards we think are coming. You can watch our recent video “The Absolute Link Between House Prices and Credit” for more on this. And remember debt is still rising faster than inflation or wages, so household debt will continue to rise from its already overextended level. The rolling 12 month rolling trend says it all, and we see that both owner occupied and investor loan flows are slowing, with investor lending shrinking faster. You can watch our separate video on the data “Housing Credit Goes into Reverse”. The proportion of investor loan flows slid again (excluding refinance) to 43.6%.
CoreLogic did a neat piece of analysis showing the strong correlation between home prices and investor property lending. They said that since macro prudential measures were announced and implemented by APRA, the trends in housing related credit have changed remarkably. Soon after APRA announced the ten percent annual speed limit for investment lending in December 2014, investment housing finance commitments peaked at 55% of mortgage demand and investment credit growth moved through a cyclical peak rate of annual growth at 10.8%. Around the same time, the quarterly rate of home value appreciation peaked in Sydney and Melbourne; the two cities where investment has been most concentrated. As credit policies were tightened in response to the APRA limits, then loosened as lenders overachieved their APRA targets, the housing market responded virtually in concert. Interest rate cuts in May and August of 2016 helped to support a rebound in the pace of capital gains, however as lenders came close to breaching the 10% limit, at least on a monthly annualised basis, credit once again tightened and the second round of macro prudential, announced in March 2017, saw credit availability restricted further. The result of changes in credit availability has been evident across most housing markets, but is very clear in Sydney and Melbourne; dwelling values started to track lower in Sydney from July last year and peaked in Melbourne in November last year.
And the latest trends in home price movements shows further falls in Sydney and Melbourne. In fact, from the start of the year, only Brisbane has shown any increase, all other capital cities fell with an average of 0.26%, and this before the tighter lending standards have started to bite. But of course, whilst we see some slippage now, this is small beer relative to the average gained since May 2012 of 46.7% with the strongest gains in Sydney at 60.9% followed by Melbourne at 43.8%.
Others are now revising their forecasts on future home price momentum with SQM research downgrading their estimates for Sydney, Melbourne, Brisbane, Darwin, Canberra and The Capital City Average. They have tended to be more bullish than some other analysts, but gravity is finally catching up and they also said property prices in Sydney and Melbourne are massively overvalued against fundamentals – by up to 45% we agree.
UBS also published analysis which suggests that home prices are likely to fall, on the back of weaker credit. Once again, gravity will win.
You may remember the RBA warned recently of the potential for credit availability to become more constrained. And economists are now all beginning to highlight the potential impact – the question now is, how tight will lending become? Will the regulators try to alleviate the impact, for example freeing up property investor lending, and will the next move in interest rates be up, or down in the months ahead. More importantly, if lending tanks as we expect, then the spill over effects on the broader economy, growth, home prices, all compound the problems. We are in for a credit crunch, so my scenario 2 – see our video on “Four Potential Finance and Property Scenarios – None Good”.
And if you want more evidence of the economic indicators, look at Retail turnover from the ABS this week which showed further evidence of the stress on households. Retail turnover showed no growth in March, in seasonally adjusted terms following a 0.6 per cent rise in February 2018. Our preferred trend estimates for Australian retail turnover rose 0.3 per cent in March 2018, following a rise (0.3 per cent) in February 2018. Compared to March 2017, the trend estimate rose 2.6 per cent. And across the states there were some significant variations, with NSW up 0.3%, VIC. Up 0.5%, QLD and SA up 0.1%, WA and flat, the Northern territories up 0.3% and ACT 0.4%.
And this is consistent with our Household Finance Confidence Index, to the end of April 2018, which showed that households remain concerned about their financial situation. This is consistent with rising levels of mortgage stress, as we reported recently. The index fell to 91.7, down from 92.3 in March. This remains below the neutral 100 setting, and continues the decline since October 2016. You can watch our separate video “Household Financial Confidence Takes Another Dive” Again, we continue to see little on the horizon to suggest that household financial confidence will improve. Currently, wages growth will remain contained, and home prices are likely to slide further, while costs of living pressures continue to grow. Whilst banks have reduced their investor mortgage interest rates to attract new borrowers, we believe there will also be more pressure on mortgage interest rates as funding costs rise, and lower rates on deposits as banks trim these rates to protect their net margins. In the last reporting round, the banks were highlighting pressure on their margins as the back-book pricing benefit from last year ebbs away.

We got half year results from Westpac this week which were an interesting counterpoint to recent announcements, with stronger NIM, including from Treasury. Their CET1 ratio fell a little, but they are still well placed. Mortgage delinquencies were a little higher but and they had been able to lift margin by reducing rates on some deposits, though they did signal higher funding at the moment and the risks of higher rates ahead. They defended the quality of their mortgage portfolio. One slide in the investor presentation said “Australian mortgages performing well”. The data showed that Westpac originated $5 billion in mortgages in the first half 18, or about $10 billion over a year, or the same as the bank funded as far back as 2014. Compare that with the $18 billion in 2017 and 17 billion the year before that. Momentum is slowing. Analysts, UBS, who called out potential “liar loans” at the bank said they say they remain concerned with the findings of APRA’s ‘Targeted Review’ into WBC’s mortgage serviceability assessment and in particular comments from Wayne Byres (APRA Chairman) that WBC was a “significant outlier” and WBC’s Board Papers which stated its performance was “poor, both absolutely and relative to peers”. Further, WBC stated in the March quarter ~20% of loans were approved with Debt-to-Income (DTI) > 6x. This as a very high level especially given the concerns that mortgagor gross household income appears to be overstated across the industry, and the total debt position of customers is not yet fully visible (the mandatory comprehensive credit reporting regime begins 1 July 2018). You can watch our separate video “Westpac and The Liar Loans Incident”
CBA reported their Q3 unaudited trading results, with a statutory net profit of approximately $2.30bn, in the quarter and unaudited cash net profit of approximately $2.35bn in the quarter. This is down 9% on an underlying basis compared with 1H18. We see some signs of rising consumer arrears, and a flat NIM (stark contrast to WBC earlier in the week!). Expenses were higher due to provisions for regulatory and compliance. They reputation is in question.
The impact of reputational risk is highlighted by AMP’s Q118 results. They said cashflows were subdued in Australian wealth management but there was continued strength in AMP Capital and AMP Bank. AMP Bank’s total loan book up 2 per cent to A$19.8 billion during the quarter. The portfolio review of manage for value businesses continues. In response to ASIC industry reports, AMP continues to review adviser conduct, customer fees, the quality of advice, and the monitoring and supervision of its advisers. They anticipate that this review will lead to further customer remediation costs and associated expenses and they will provide a further update at or before the 1H 18 results. This will include enhancements to AMP’s control frameworks, governance and systems.
AMP’s share price has fallen significantly, to levels not seen since 2003, and in a vote of no confidence, Australian Ethical has announced it will completely divest from AMP following revelations of “systemic prudential and cultural issues” at the royal commission. They will not reinvest until AMP demonstrates they have addressed their underlying issues. And they are watching the two of the four major banks they have holdings in, in the light of the findings from the royal commission too.
Finally, It’s worth looking at the impact of higher interest rates on the market. The Bank of England made small adjustments from a low base recently, and the results have been negative and predictable. The UK economy remains in the doldrums, so no surprise, the cash rate remained unchanged this month. In fact, the small rises made before have translated directly to lower home prices, reflecting the highly leverage state of many households. GDP is expected to grow by around 1¾% per year on average over the forecast period. Household consumption growth remains subdued. CPI inflation fell to 2.5% in March, lower than expected.
Indeed, Fitch Ratings says the UK household sector’s worsening financial health reduces consumer resilience to income or interest rate shocks and presents risks for UK consumer loan portfolios. Consumer credit has been a key driver of rising household debt. But weaker household finances reduce the resilience of consumer spending – by far the largest demand component of UK GDP – to shocks. A major interest rate shock appears unlikely (they forecast the UK base rate to rise gradually, to 1.25% by end-2019), but a more immediate shock could come from tightening credit supply. The impact of the Brexit referendum on real wages may be fading, but Brexit uncertainty creates risks of a bigger shock to growth and employment. They say that UK banks are highly exposed to UK households, but mostly through mortgages, with consumer credit accounting for just 10% of banks’ lending to the sector. High household debt is a constraint on UK banks’ operating environment. Does this sound familiar?