
The latest edition of our finance and property news digest with a distinctively Australian flavour. We had a power cut last evening, so this is a few hours later than normal. Thanks Endeavour Energy!!
Category: Long Range Econometrics
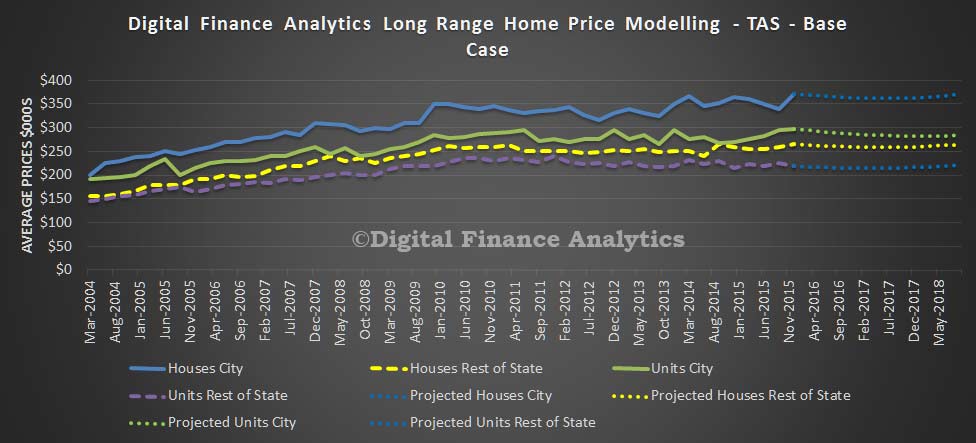
Where To With Hobart Home Prices?
As we continue our state by state scenario analysis – read about our assumptions here – we look at Tasmania. Given the low transaction volumes, our results will be more noisy. That said, in our base case to mid 2018, we expect to see the average house price in Hobart fall by 0.2% to $371,000 and the average unit price in Hobart fall by 4.1% to $285,000. In the regional areas, the average house price will fall by 0.3% to $264,000 and units will rise 0.8% to $221,000.
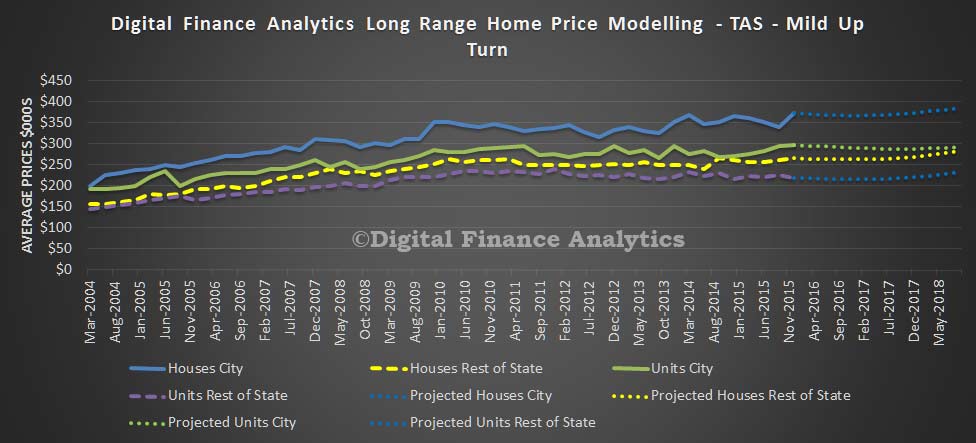
 If economic activity picks up to mid 2018, we expect to see the average house price in Hobart rise by 3.6% to $385,000 and the average unit price in Hobart fall by 1.9% to $291,000. In the regional areas, the average house price will rise by 6.6% to $283,000 and units will rise 5.7% to $231,000.
 If economic activity slows to mid 2018, we expect to see the average house price in Hobart fall by 11.3% to $329,000 and the average unit price in Hobart fall by 16.2% to $249,000. In the regional areas, the average house price will fall by 13.3% to $230,000 and units will fall 13.4% to $190,000.
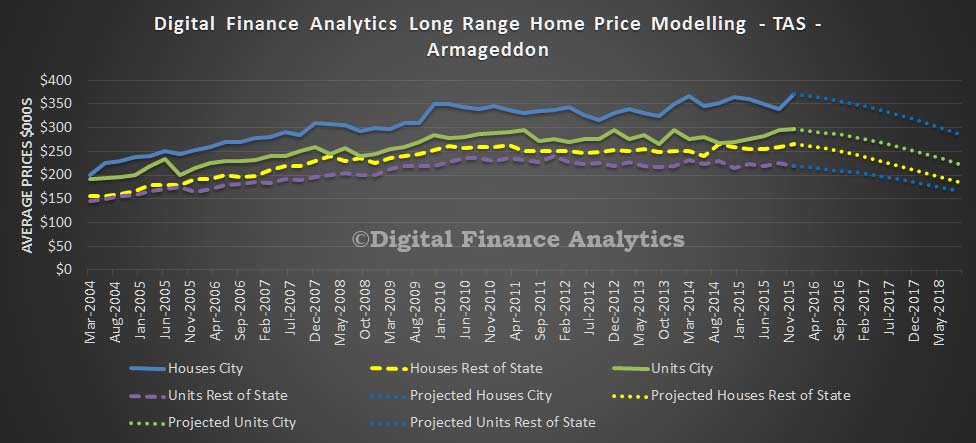
 If economic activity falls significantly to mid 2018, we expect to see the average house price in Hobart fall by 23.0% to $286,000 and the average unit price in Hobart fall by 24.6% to $224,000. In the regional areas, the average house price will fall by 30.3% to $185,000 and units will fall 23.7% to $167,000.
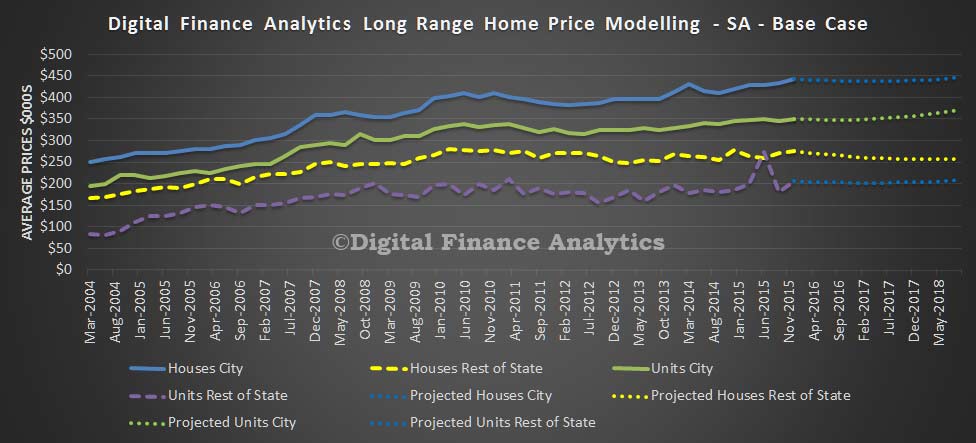
Where To With Adelaide Home Prices?
As we continue our state by state analysis, today we look at South Australia.
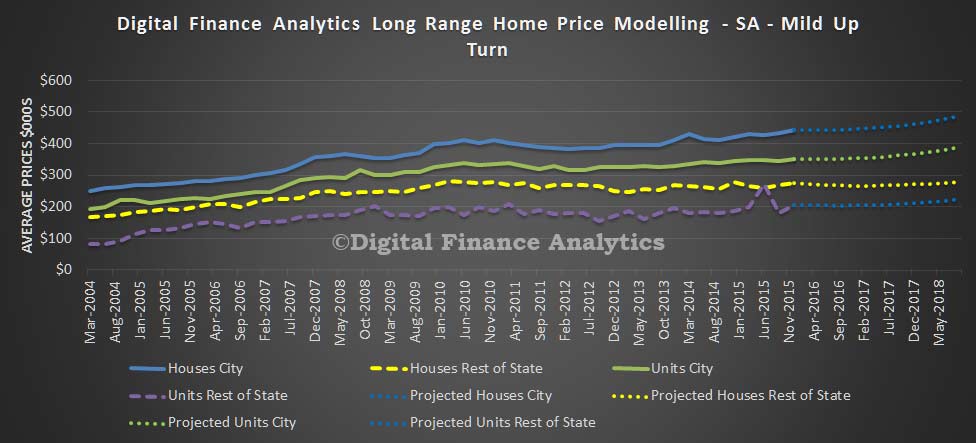
In our base case to mid 2018, we expect to see the average house price in Adelaide rise by 0.8% to $446,000 and the average unit price in Adelaide rise by 5.9% to $371,000. In the regional areas, the average house price will fall by 7.0% to $256,000 and units will rise 1.1% to $208,000.
 If economic activity picks up to mid 2018, we expect to see the average house price in Adelaide rise by 9.9% to $487,000 and the average unit price in Adelaide rise by 10.7% to $387,000. In the regional areas, the average house price will rise by 1.4% to $279,000 and units will rise 8.8% to $224,000.
 If economic activity slows to mid 2018, we expect to see the average house price in Adelaide fall by 10.3% to $397,000 and the average unit price in Adelaide fall by 7.1% to $325,000. In the regional areas, the average house price will fall by 18.1% to $226,000 and units will fall 11.9% to $182,000.
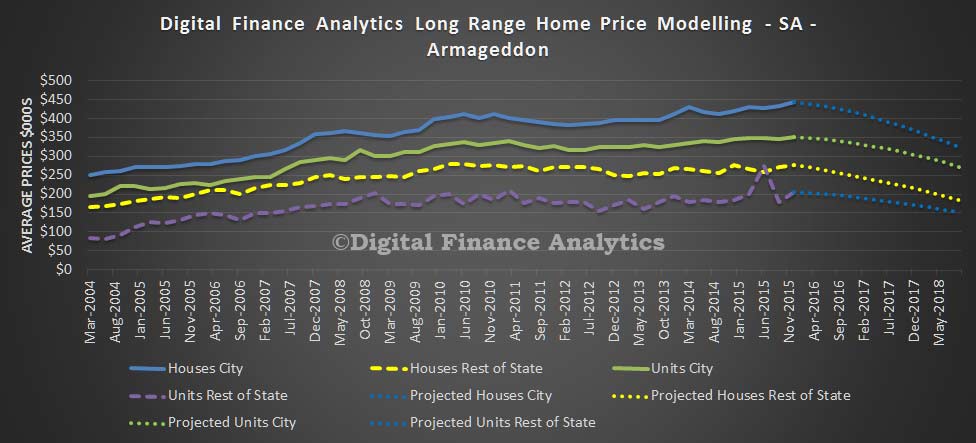
 If economic activity falls significantly to mid 2018, we expect to see the average house price in Adelaide fall by 26.7% to $324,000 and the average unit price in Adelaide fall by 22.2% to $272,000. In the regional areas, the average house price will fall by 33.1% to $184,000 and units will fall 25.8% to $153,000.
 A reminder. This modelling is wrong, but is designed to illustrate the relative sensitivities in different scenarios!
Where To For Perth Home Prices?
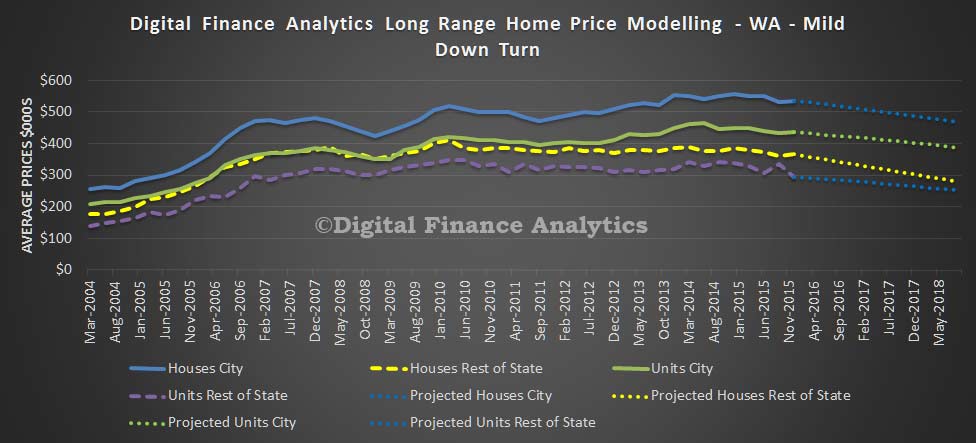
We continue our series of home price modelling by state. Today we look at WA. You can read about our modelling and scenarios.
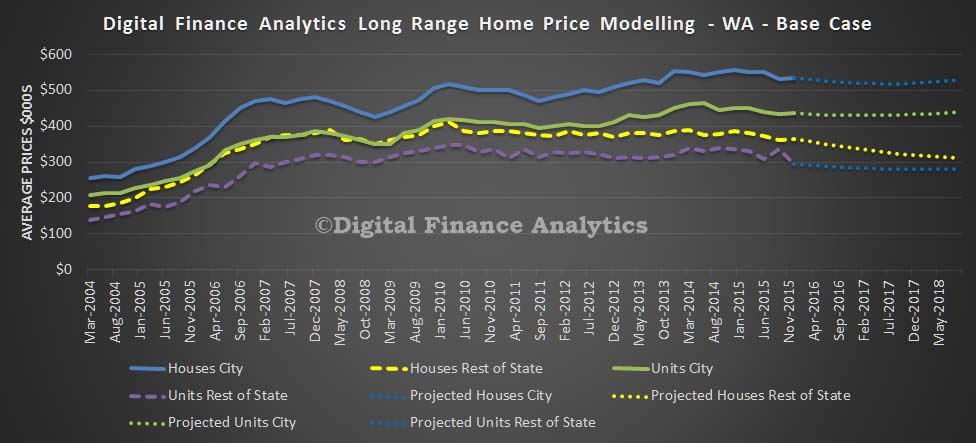
In our base case to mid 2018, we expect to see the average house price in Perth fall by 1.4% to $528,000 and the average unit price in Perth rise by 0.7% to $438,000. In the regional areas, the average house price will fall by 14.6% to $312,000 and units will fall 5.3% to $279,000.
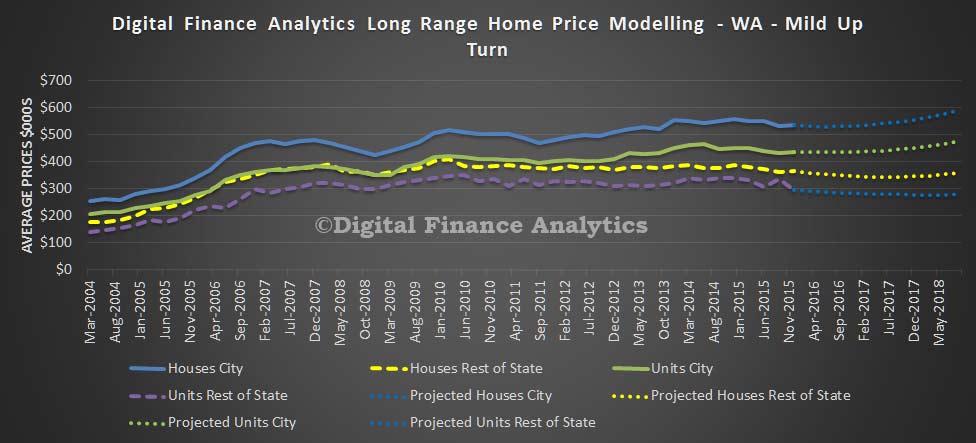
 If economic activity picks up to mid 2018, we expect to see the average house price in Perth rise by 10.1% to $589,000 and the average unit price in Perth rise by 9.5% to $477,000. In the regional areas, the average house price will fall by 2.3% to $357,000 and units will fall 5.6% to $279,500.
 If economic activity slows to mid 2018, we expect to see the average house price in Perth fall by 12.6% to $467,000 and the average unit price in Perth fall by 11.2% to $386,000. In the regional areas, the average house price will fall by 23.6% to $279,000 and units will fall 14.8% to $251,000.
 If economic activity falls significantly to mid 2018, we expect to see the average house price in Perth fall by 27.9% to $386,000 and the average unit price in Perth fall by 20.1% to $347,000. In the regional areas, the average house price will fall by 35.0% to $237,000 and units will fall 29.4% to $208,000.
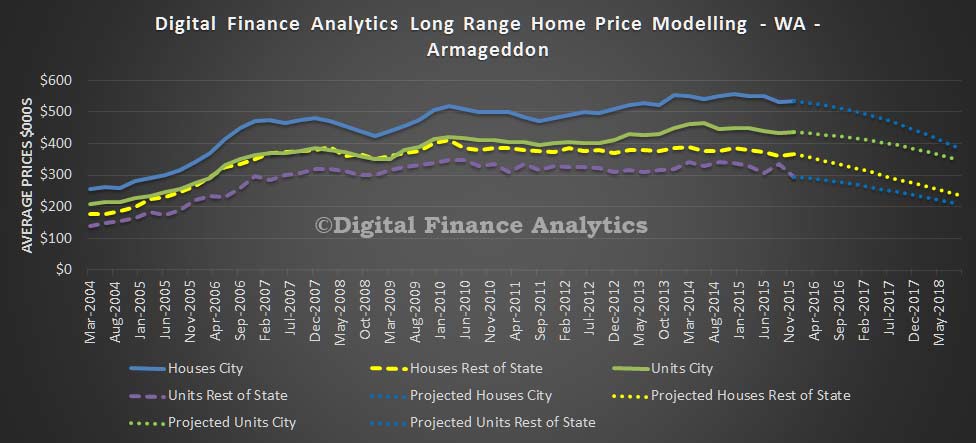 This shows the WA market is quite fragile, despite considerable construction momentum, and interest from first time buyers. The modelling is designed to show relative sensitivity rather than making absolute predictions.
Where To With Brisbane Home Prices?
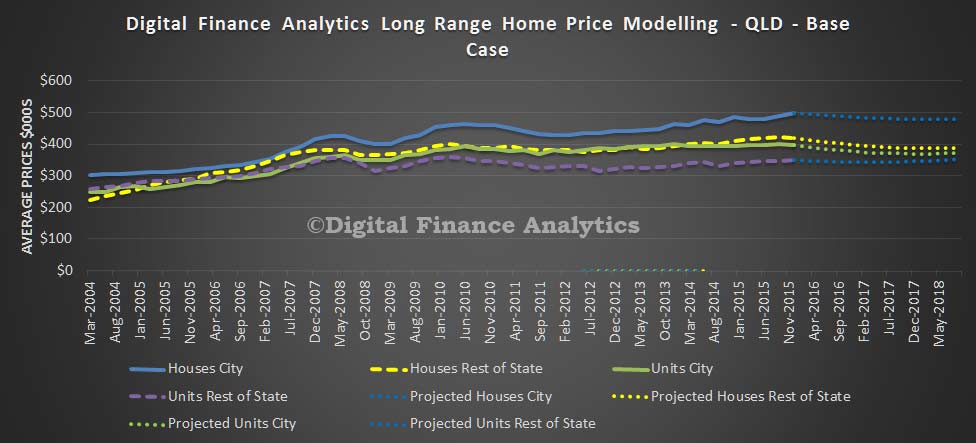
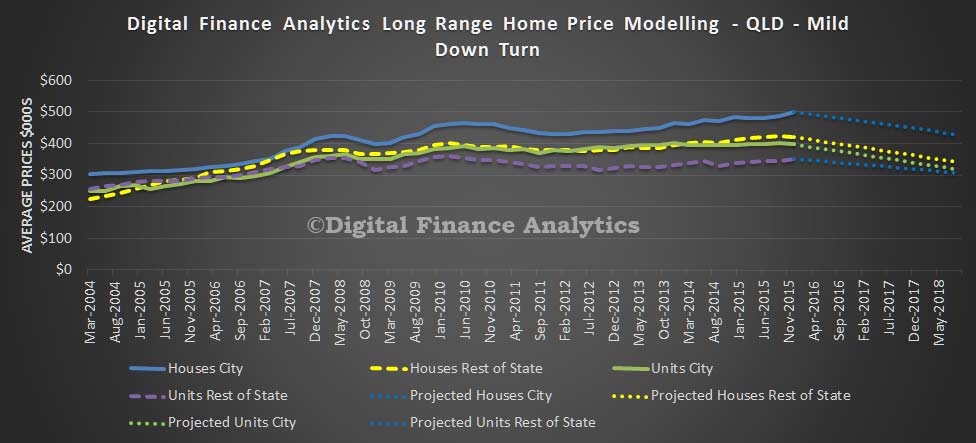
Continuing our modelling of future home prices, as described in our earlier post, today we look at QLD and run the analysis against our various scenarios.
In our base case to mid 2018, we expect to see the average house price in Brisbane fall by 3.9% to $481,000 and the average unit price in Brisbane fall by 6.2% to $372,000. In the regional areas, the average house price will fall by 7.6% to $388,000 and units will rise 0.7% to $353,000.
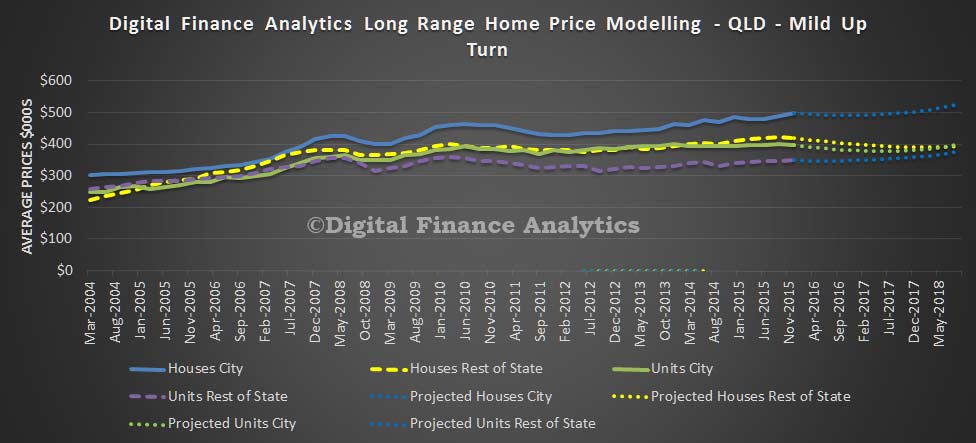
 If economic activity picks up to mid 2018, we expect to see the average house price in Brisbane rise by 5.3% to $526,000 and the average unit price in Brisbane rise by 0.6% to $399,000. In the regional areas, the average house price will fall by 5.9% to $395,000 and units will rise 7.9% to $378,000.
 If economic activity slows to mid 2018, we expect to see the average house price in Brisbane fall by 14.6% to $427,000 and the average unit price in Brisbane fall by 20.1% to $317,000. In the regional areas, the average house price will fall by 18.9% to $340,000 and units will fall 12.4% to $307,000.
 Finally, if economic activity falls significantly to mid 2018, we expect to see the average house price in Brisbane fall by 21.7% to $391,000 and the average unit price in Brisbane fall by 29.5% to $280,000. In the regional areas, the average house price will fall by 29.2% to $297,000 and units will fall 24.6% to $264,000.
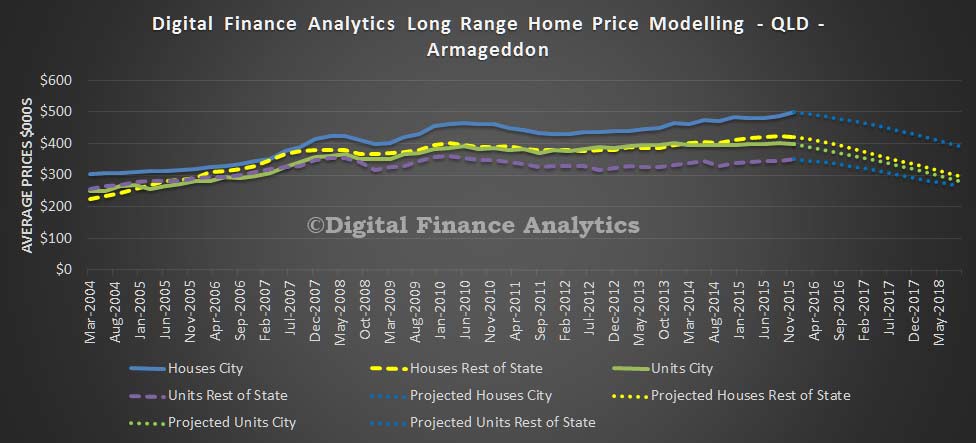 Essentially, regional areas in QLD are more exposed to economic down turns than Brisbane. Also, investment property purchases are a large proportion of transactions, and these are very sensitive to economic variables. Whilst this modelling will be wrong, it does give an indication of relative sensitives.
Tomorrow we will look at Western Australia.
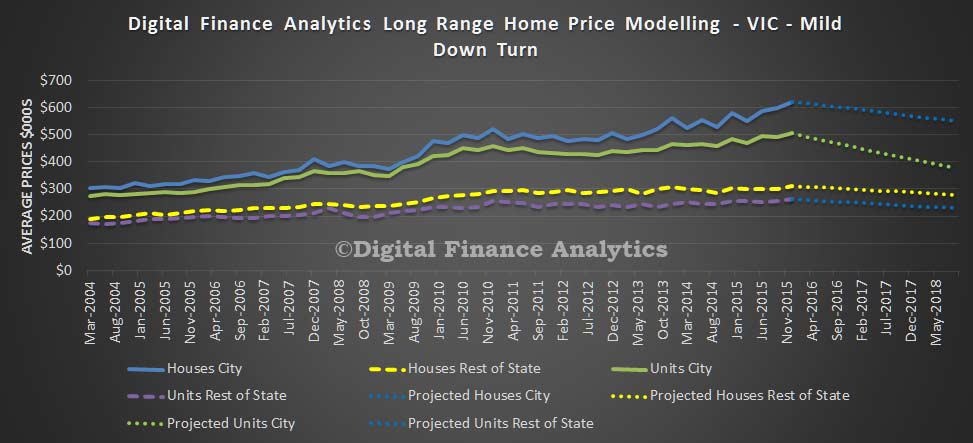
Where to With Melbourne Home Prices?
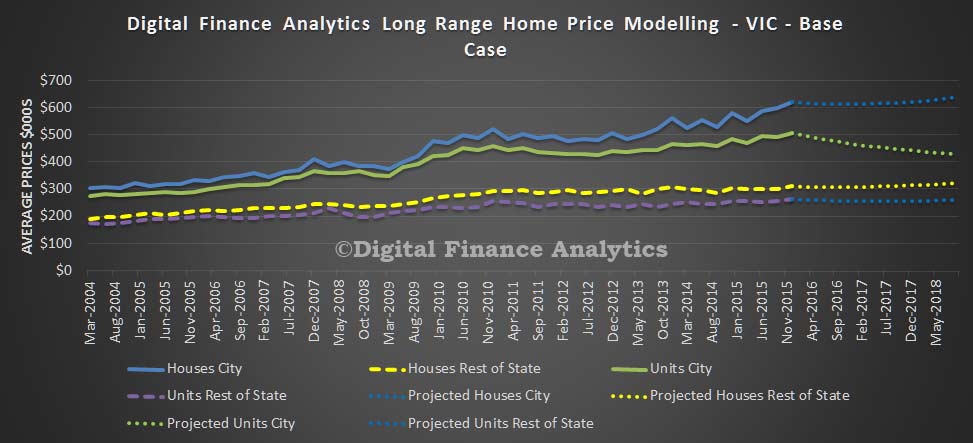
Continuing our econometric modelling of home prices trends, today we examine Melbourne. As we discussed our model takes account of a range of factors and runs a series of future scenarios out to mid 2018. We look at prices both within Melbourne and also across the state and split the analysis into houses and units.
In our base case to mid 2018, we expect to see the average house price in Melbourne rise by 2.8% to $639,000 and the average unit in Melbourne fall by 15.1% to $429,000. In regional areas, the average house price will rise 3.5% to $321,000 and units will fall by 0.4% to $260,000. The oversupply of units in the CBD explain the projected price falls.
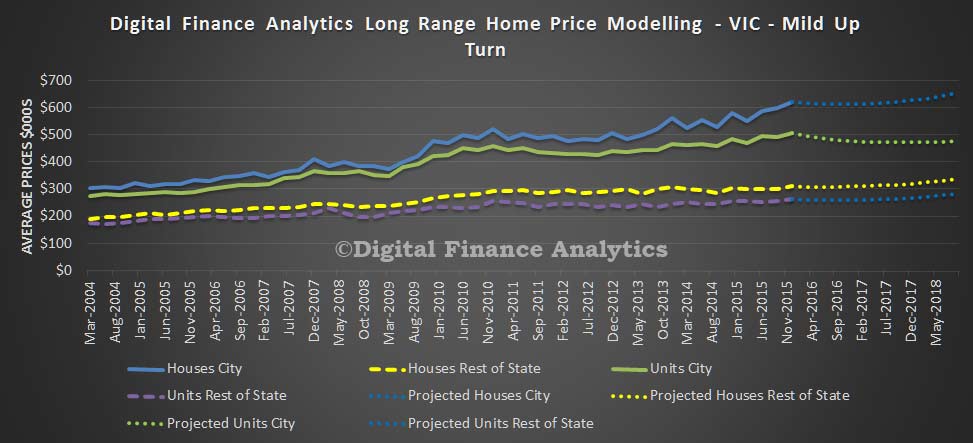
 If economic momentum becomes stronger, to mid 2018, the average house price in Melbourne will rise by 5.1% to $653,000 and the average unit in Melbourne will fall by 5.7% to $476,000. In regional areas, the average house price will rise 3.4% to $337,000 and units will rise by 7.9% to $282,000. The rise in Melbourne will continue despite lower demand for investment property and static incomes. Over supply of units in the CBD will depress unit prices.
 If economic momentum falls, to mid 2018, we expect to see the average house price in Melbourne fall by 11.6% to $549,000 and the average unit in Melbourne fall by 25.2% to $378,000. In regional areas, the average house price will fall 10.6% to $277,000 and units will fall by 12.6% to $228,000. In this scenario, growth remains low, unemployment moves higher, incomes remain flat, and demand for property slows.
 If economic momentum falls significantly, to mid 2018, we expect to see the average house price in Melbourne fall by 29.2% to $439,000 and the average unit in Melbourne fall by 38.4% to $311,000. In regional areas, the average house price will fall 28% to $223,000 and units will fall by 18.8% to $221,000. In this scenario, cash interest rates are cut further, unemployment rises, income falls in real terms, and demand for property falters. This is our Armageddon scenario.
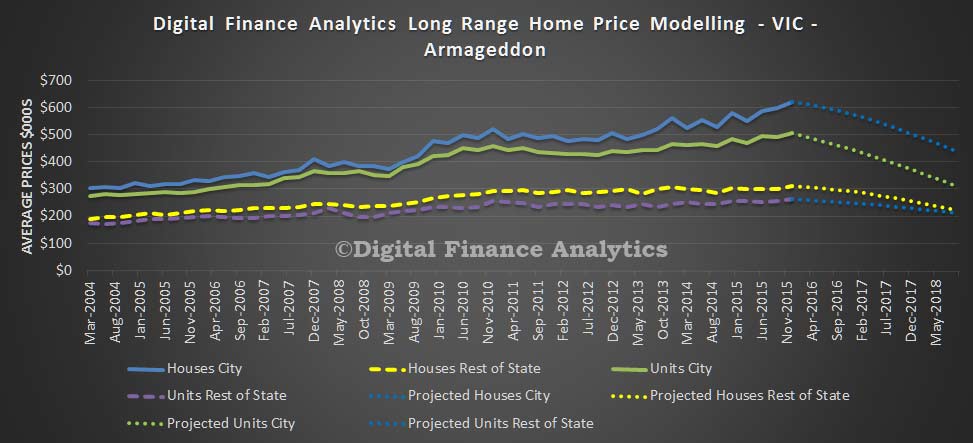 We see that the main area of risk centres on units in Melbourne, especially those within the CBD and surrounds. Supply is rising fast, at a time when demand is not matched.
And a caveat, this modelling will be wrong, but it does give an indication of relative sensitives. Next time we will look at Brisbane and QLD.
Econometric House Price Modelling
Given the near $6 trillion of residential real estate, and the near $1.6 trillion of loans on these properties, future house price dynamics are important for households, banks, regulators and the wider economy. So it is worth thinking about where house prices might go. There is no rule that house prices can only rise. In the US they fell up to 40% and in the UK up to 25% post the GFC. Domain today reported falls in many states in the past few months. In Australia, prices are way above long term trends.
Any modelling of future outcomes will be wrong. However we have been developing an econometric model which draws current data from our segmented household surveys and using a range of relationships we seek to estimate average house and unit prices by state, for properties in the main urban areas, and separately in the regional areas. Averages across Australia mask too many differences to be useful. Having used the model to track events over the past year, we feel confident enough of the algorithms to share some of the results. But to stress, this model is only a guide, and its results are wrong!!
Our point of departure is data from the ABS on house and unit prices. We overlay our survey data with a range of factors to drive our modelling from a range of sources. These include:
- Supply of property by type (building approvals and construction)
- Demand for property by type (from the DFA survey)
- Population growth and demography (combination of DFA survey and ABS)
- Income growth (from ABS)
- Unemployment rate (from ABS)
- Inflation rate (from ABS)
- GDP Growth rate (from ABS)
- Demand for finance (from the survey)
- Supply of finance (RBA and ABS data)
- Interest rates (RBA)
- Mortgage interest margins (RBA and DFA analysis)
- Mortgage underwriting interest rate floors (APRA)
- Choice modelling between investment types (DFA survey)
- Choice modelling between property types (DFA survey)
- Tax breaks (DFA survey and ATO)
- Mortgage default rates (Various, including DFA survey)
- Lender mortgage write-downs (Company results)
- Penetration of Lenders Mortgage Insurance (DFA surveys and analysis)
We have six scenarios:
- Strong recovery
- Mild up turn
- Base case (no changes from current settings)
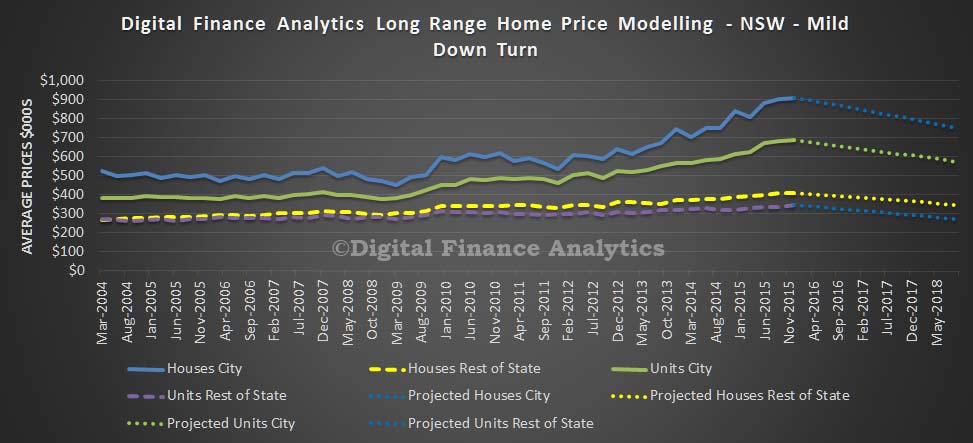
- Mild down turn
- Severe down turn
- Armageddon
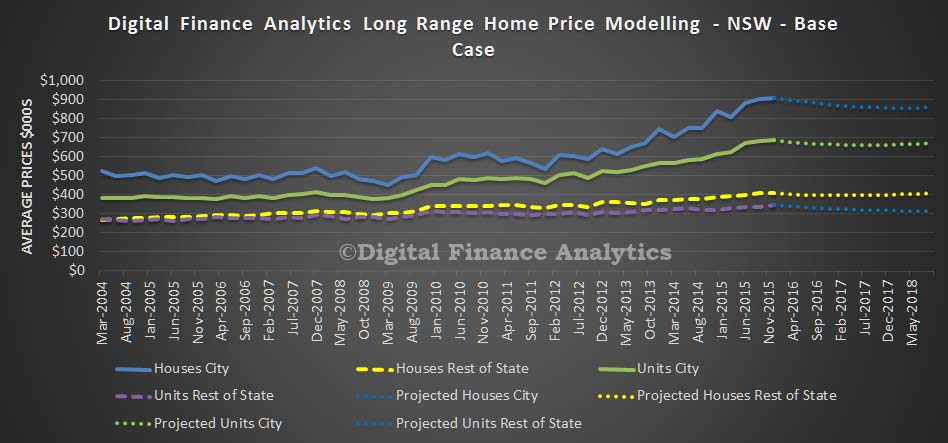
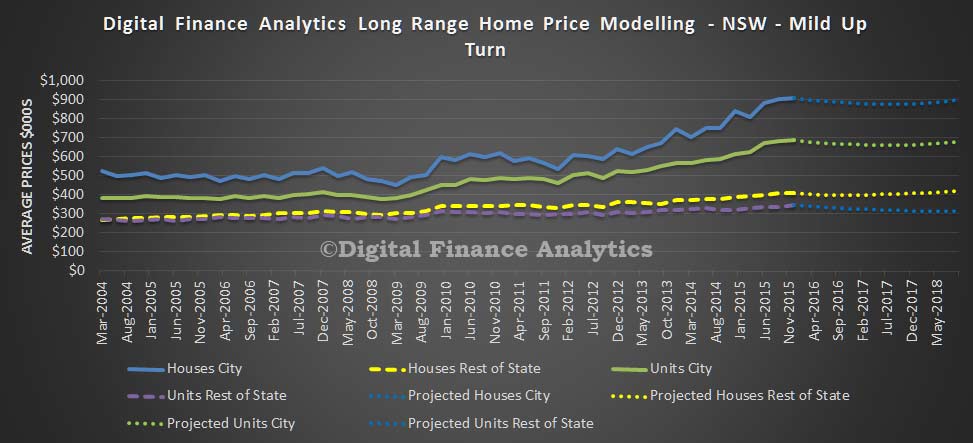
Over the coming days we will discuss some of the initial analysis we have completed. Today, we look at NSW.
In our base case to mid 2018, we expect to see the average house price in Sydney fall by 5.5% to $860,000 and the average unit in Sydney fall by 1.2% to $400,000. In regional areas, the average house price will fall 2.5% to $395,000 and units will fall by 10.6% to $309,000.
 If economic momentum becomes stronger, to mid 2018, the average house price in Sydney will still fall a little, by 1.4% to $897,000 and the average unit in Sydney will fall by 1.1% to $677,000. In regional areas, the average house price will rise 3.3% to $418,000 but units will fall by 9.3% to $313,000. The falls in Sydney will continue given the previous strong run, lower demand for investment property and static incomes.
 If economic momentum falls, to mid 2018, we expect to see the average house price in Sydney fall by 17.5% to $751,000 and the average unit in Sydney fall by 16.3% to $573,000. In regional areas, the average house price will fall 14.6% to $346,000 and units will fall by 21.9% to $269,000. In this scenario, growth remains low, unemployment moves higher, incomes remain flat, and demand for property slows.
 If economic momentum falls significantly, to mid 2018, we expect to see the average house price in Sydney fall by 26.1% to $672,000 and the average unit in Sydney fall by 28.4% to $490,000. In regional areas, the average house price will fall 25.2% to$303,000 and units will fall by 34.5% to $226,000. In this scenario, cash interest rates are cut further, unemployment rises, income falls in real terms, and demand for property falters. This is our Armageddon scenario.
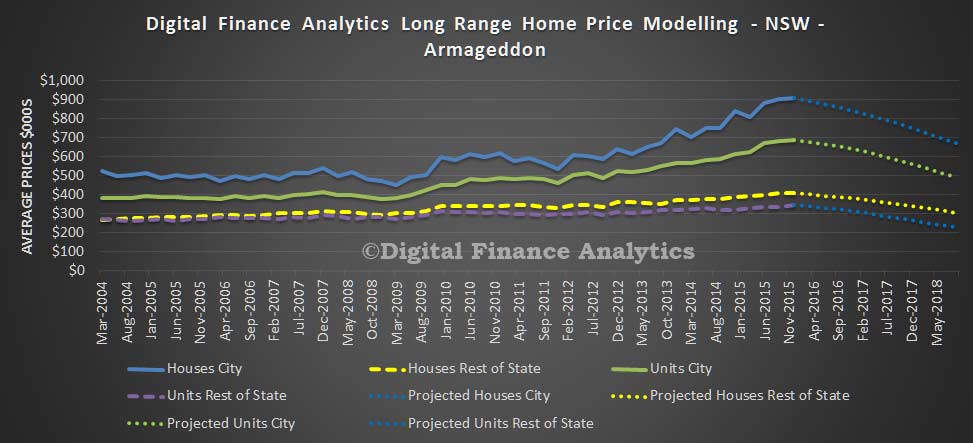 Our conclusion is that in NSW, there is more down side than upside in property at the moment and this will continue for some time to come. How severe the correction will be depends on the economic and growth outcomes.
Results are rather different in other states, and we will explore these scenarios in the next few days.