
Thus far, the corporate credit market has been relatively steady amid equity market turmoil. Corporate credit’s comparative calm stems from expectations of continued profit growth that underpins a still likely slide by the high-yield default rate. The record shows that 90% of the year-to-year declines by the default rate were joined by year-to-year growth for the market value of U.S. common stock.
Today’s positive outlooks for business sales and operating profits suggest that equities will recover once issues pertaining to interest rates are sufficiently resolved. For now, equities may be paying dearly for having been more richly priced vis-a-vis fundamentals when compared to corporate bonds.
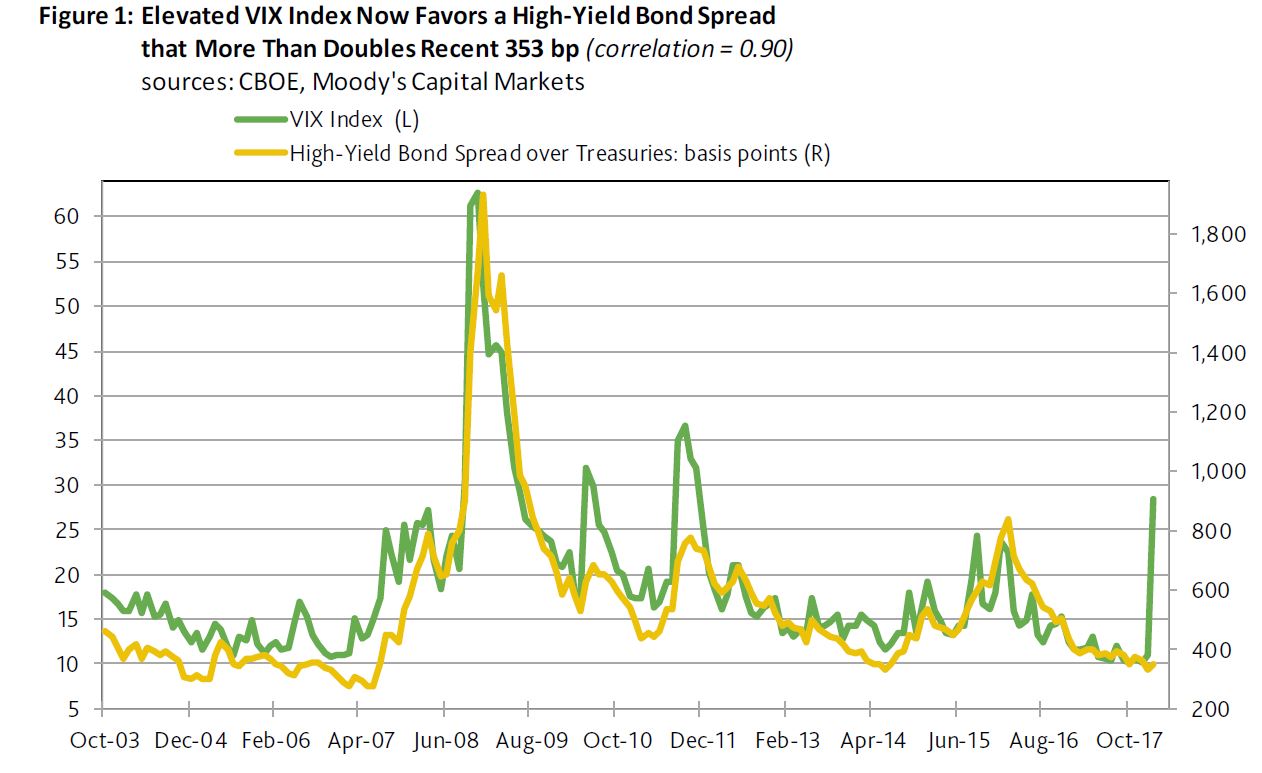
Since the VIX index’s current estimation methodology took effect in September 2003, the high-yield bond spread has generated a strong correlation of 0.90 with the VIX index. However, for now that ordinarily tight relationship has broken down. Never before has the high-yield bond spread been so unresponsive to a skyrocketing VIX index.
The VIX index’s 28.5-point average of February-to-date has been statistically associated with an 832-basis-point midpoint for the high-yield bond spread. Instead, the high-yield bond spread recently approximated 353 bp. Thus, the high-yield spread predicted by the VIX index now exceeds the actual spread by a record 479 bp.
The old record high gap was the 364 bp of October 2008, or when the actual spread of 1,398 bp would eventually surpass the 1,762 bp predicted by the VIX index. Not long thereafter, the actual high-yield spread would peak at the 1,932 bp of December 2008.
More recently, or during the euro zone crisis of 2011, the 1,018 bp high-yield spread predicted by the VIX index was as much as 323 bp above August 2011’s actual spread of 695 bp. After eventually peaking at October 2011’s 775 bp, the spread narrowed to 590 bp by August 2012.
What transpired following August 2011 and October 2008 warns against being too quick to dismiss the possibility of at least a 100 bp widening by the latest high-yield spread. Nevertheless, high-yield spreads would be significantly thinner one year after the gap between the predicted and actual spreads peaked.
For example, by August 2012, the high-yield spread had narrowed to 590 bp, while the spread had thinned to 737 bp by October 2009.