
Following 7/30’s report last night I have received a number of requests for access to the maps. So here are the high resolution versions for Sydney, Melbourne and Perth. If they are reproduced elsewhere, please attribute DFA.
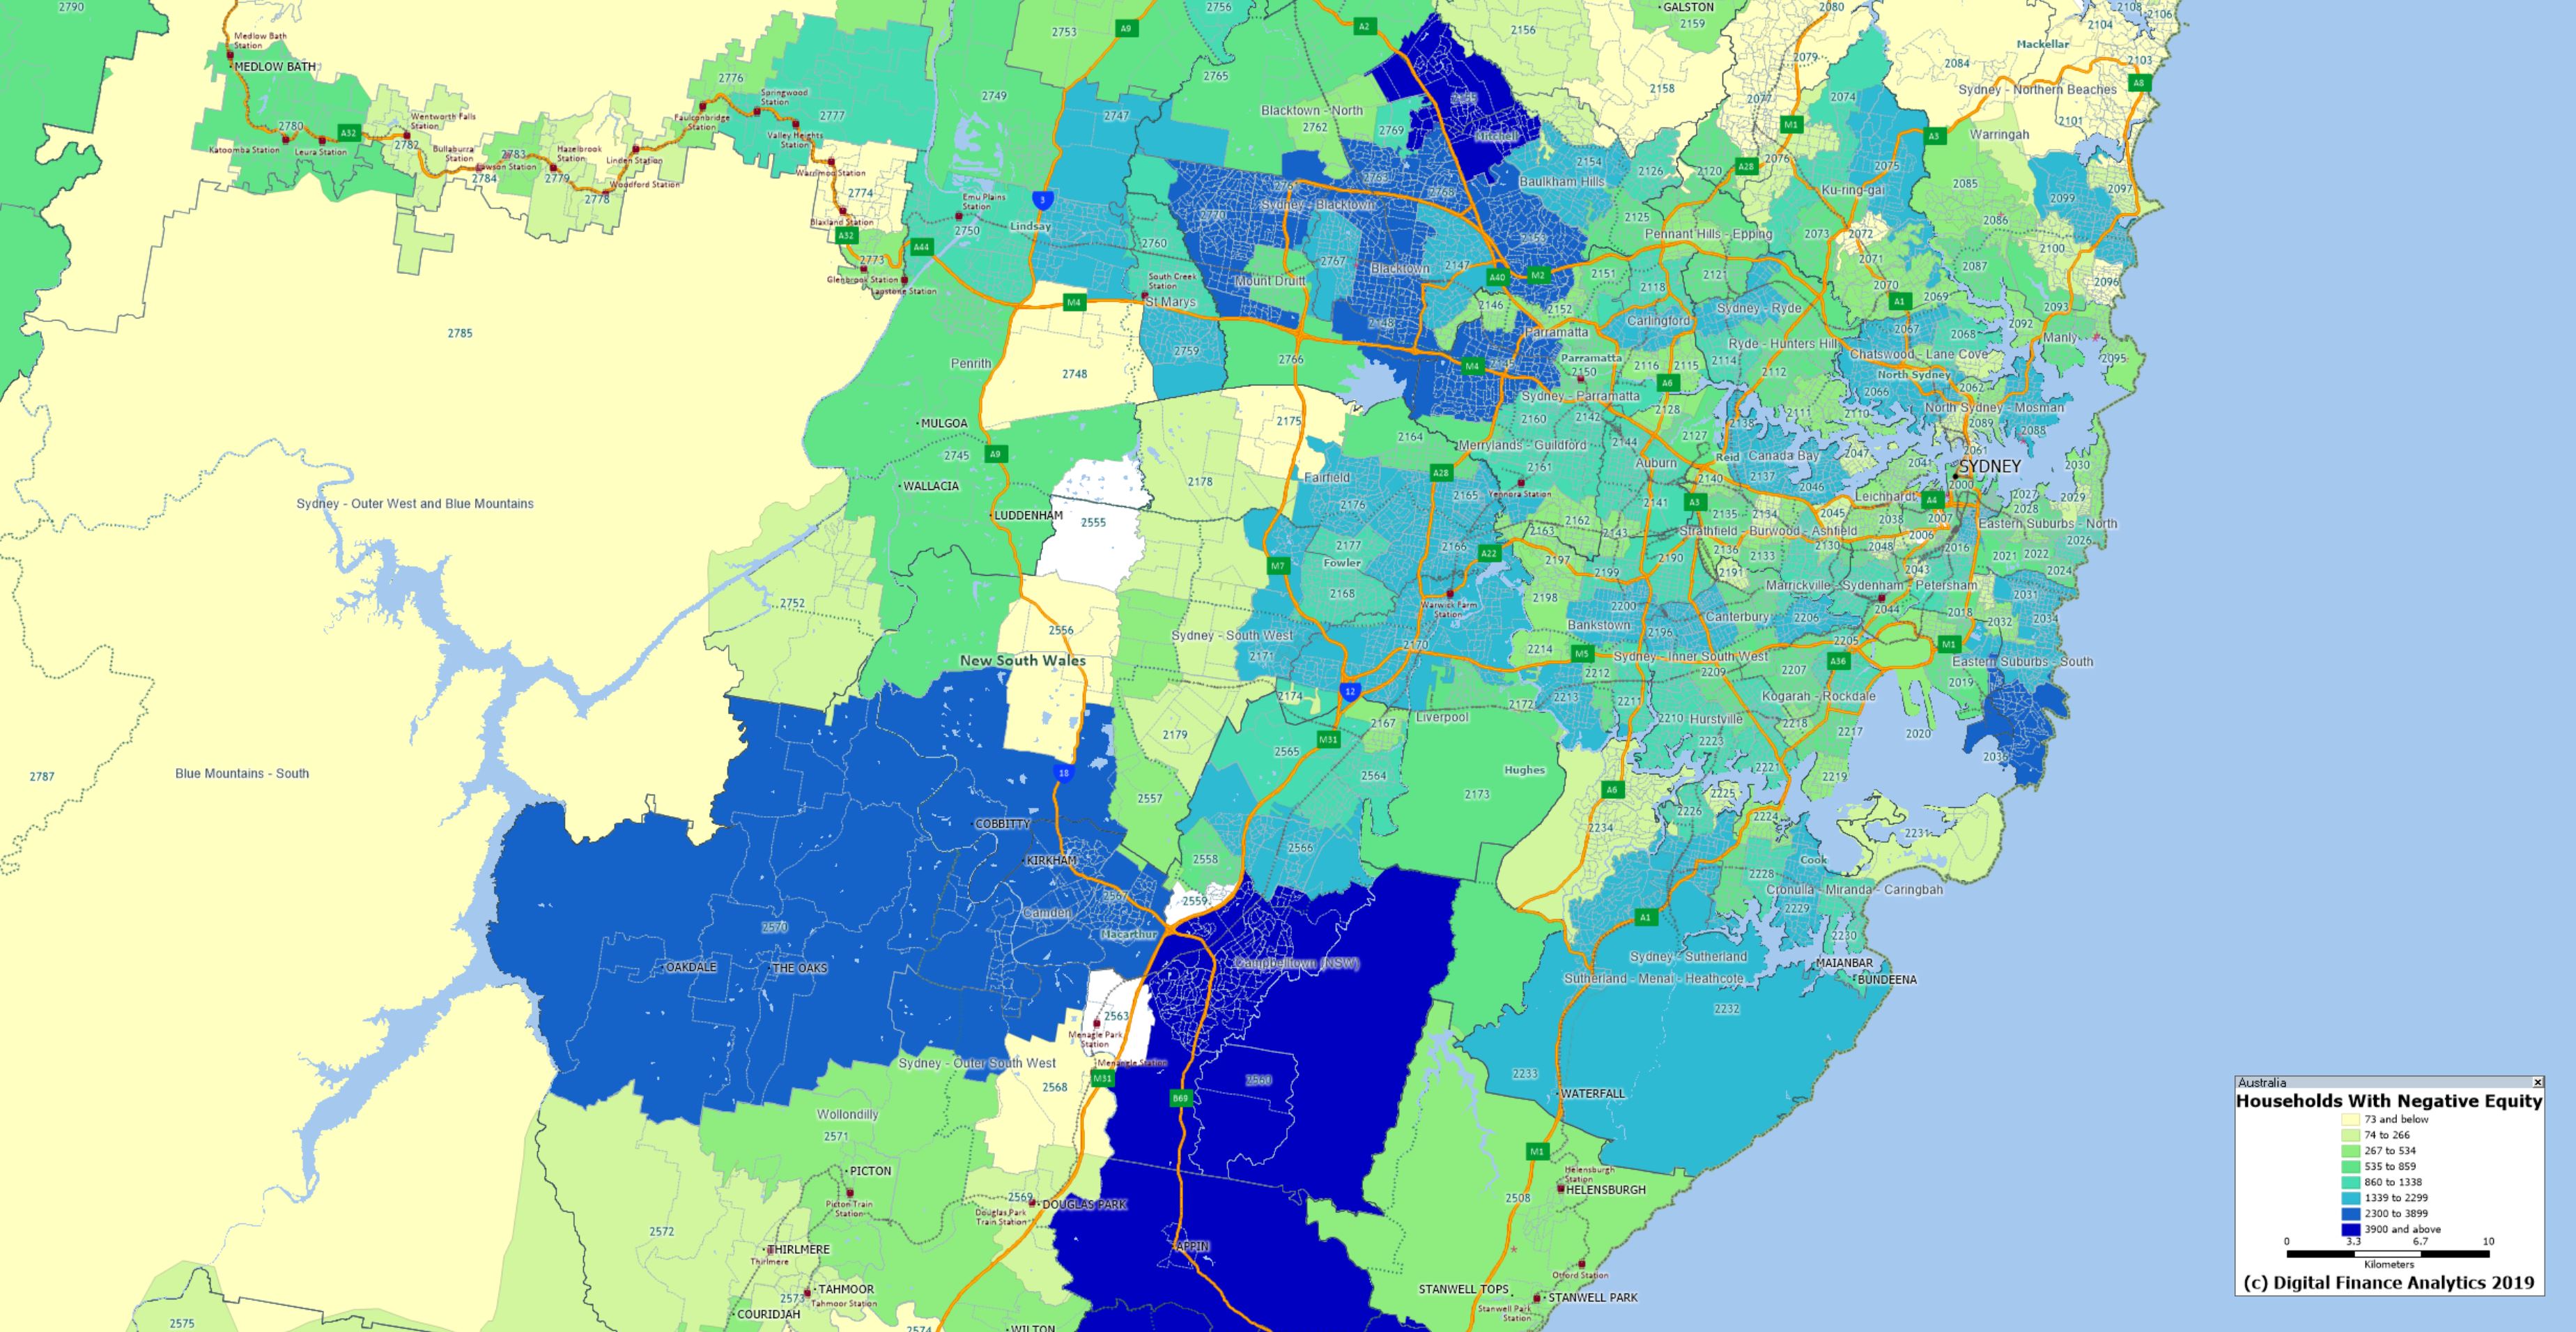
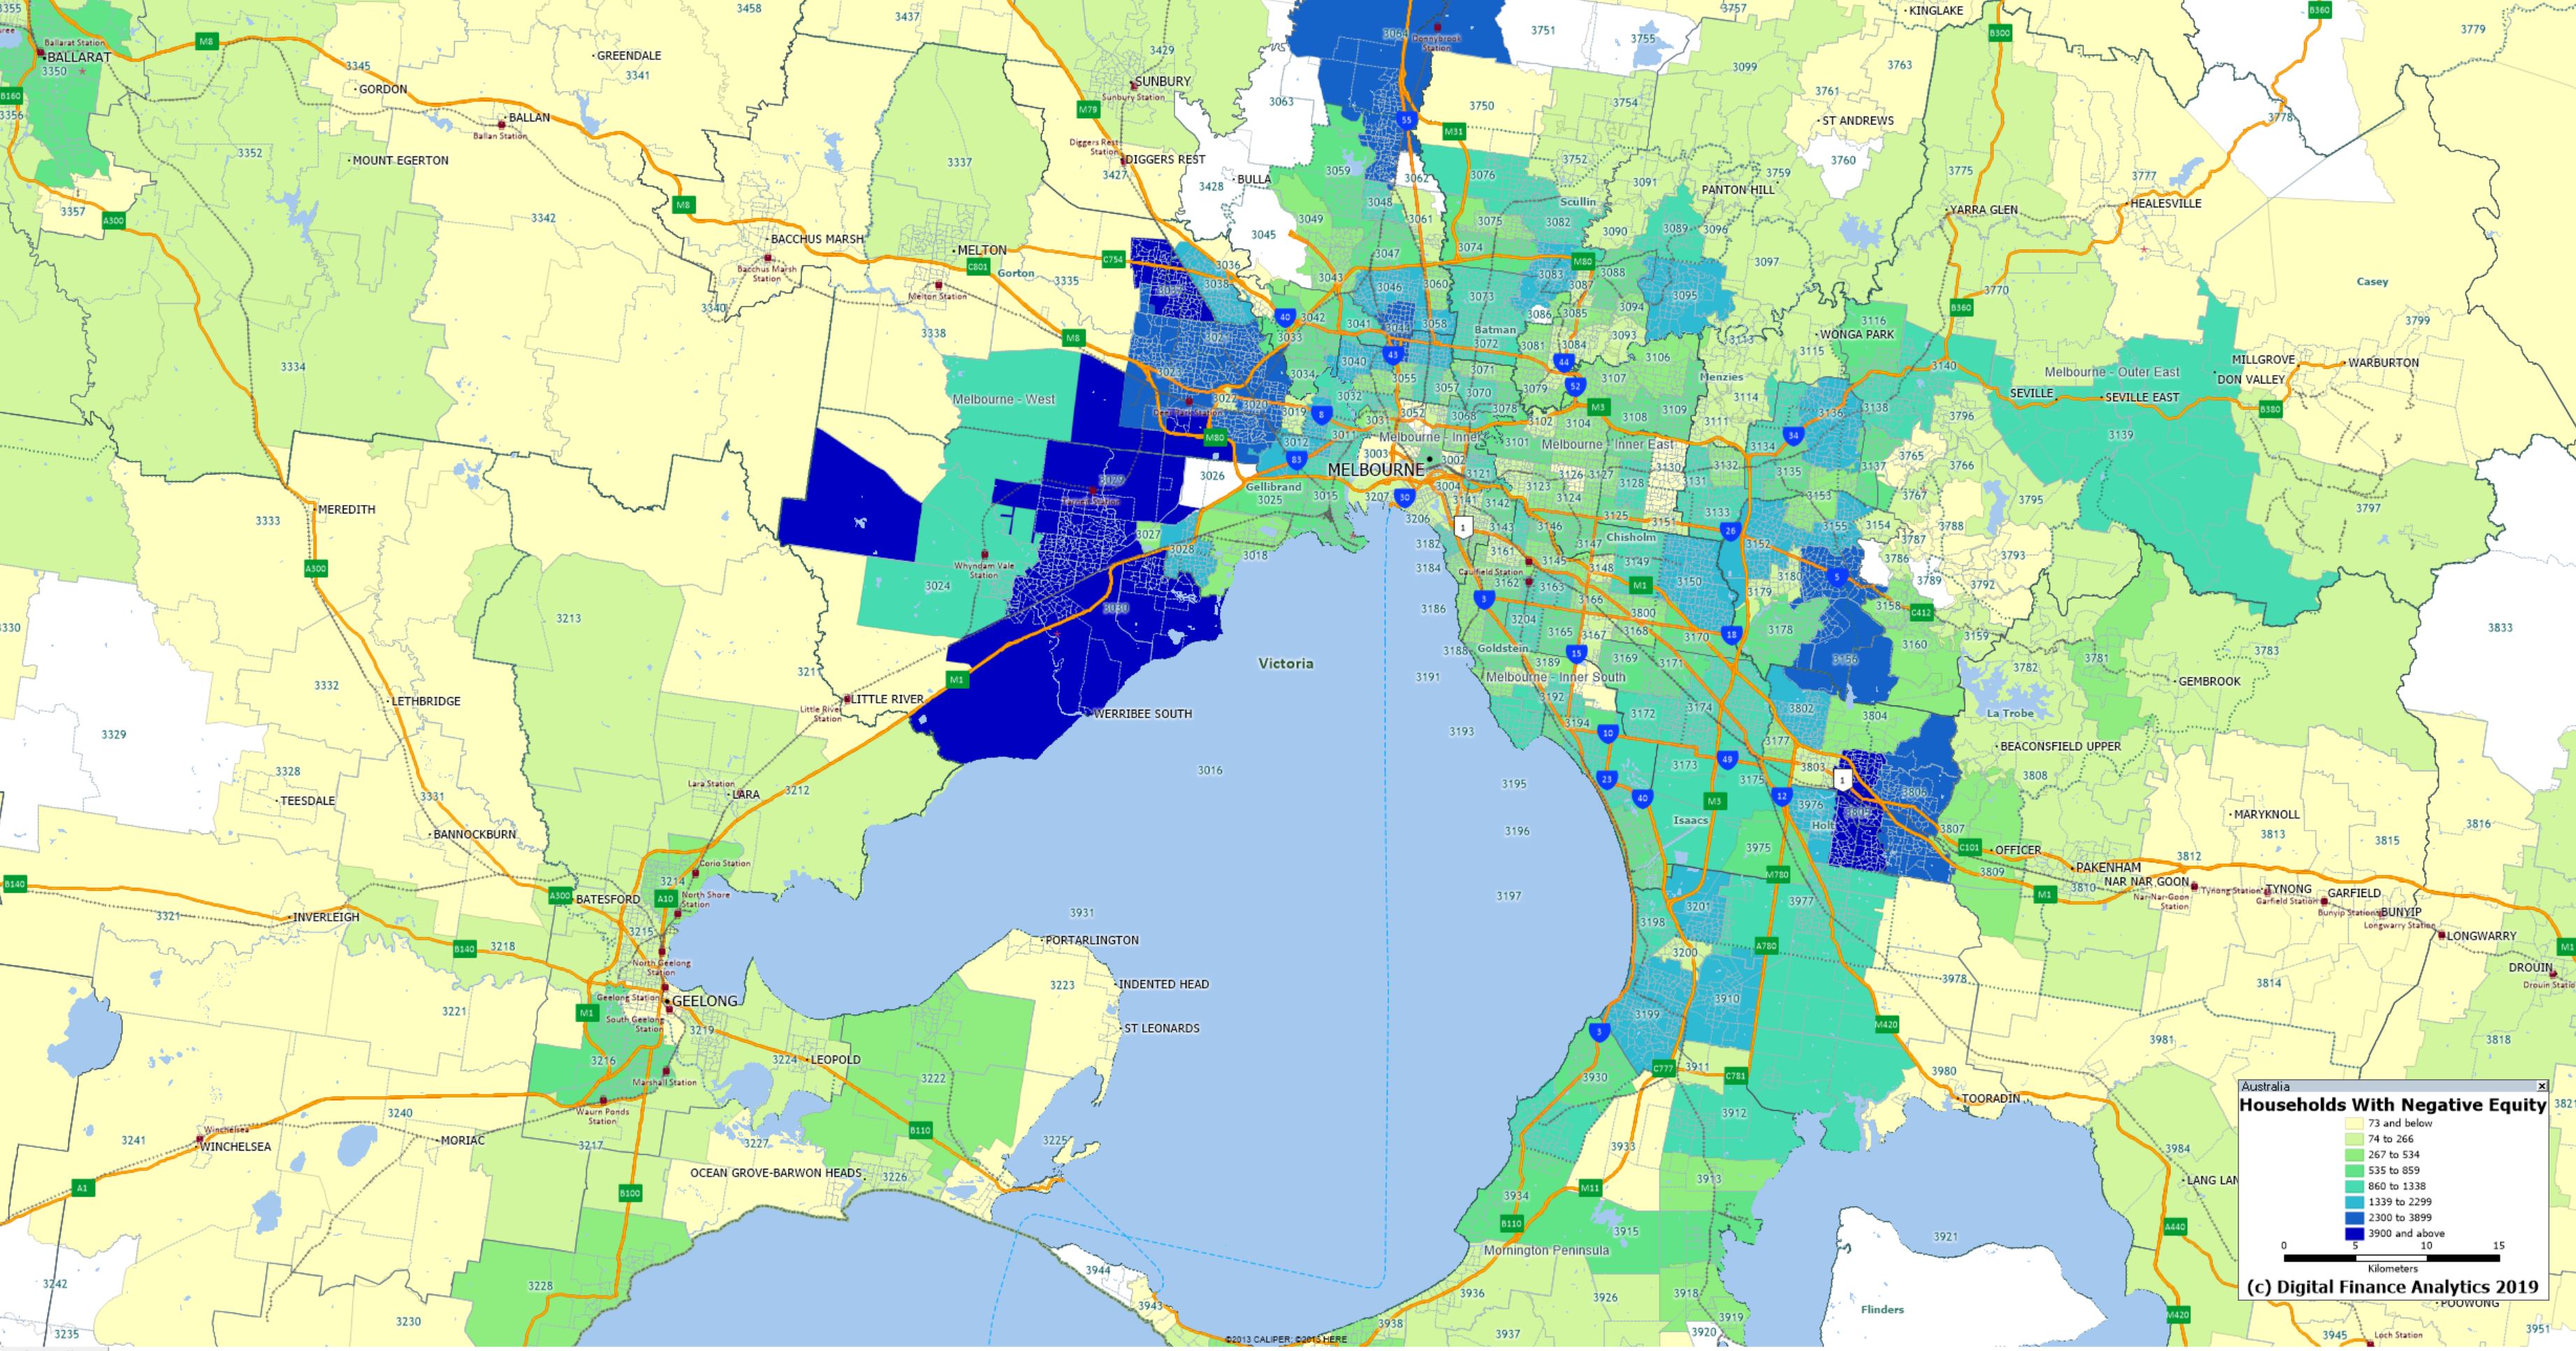
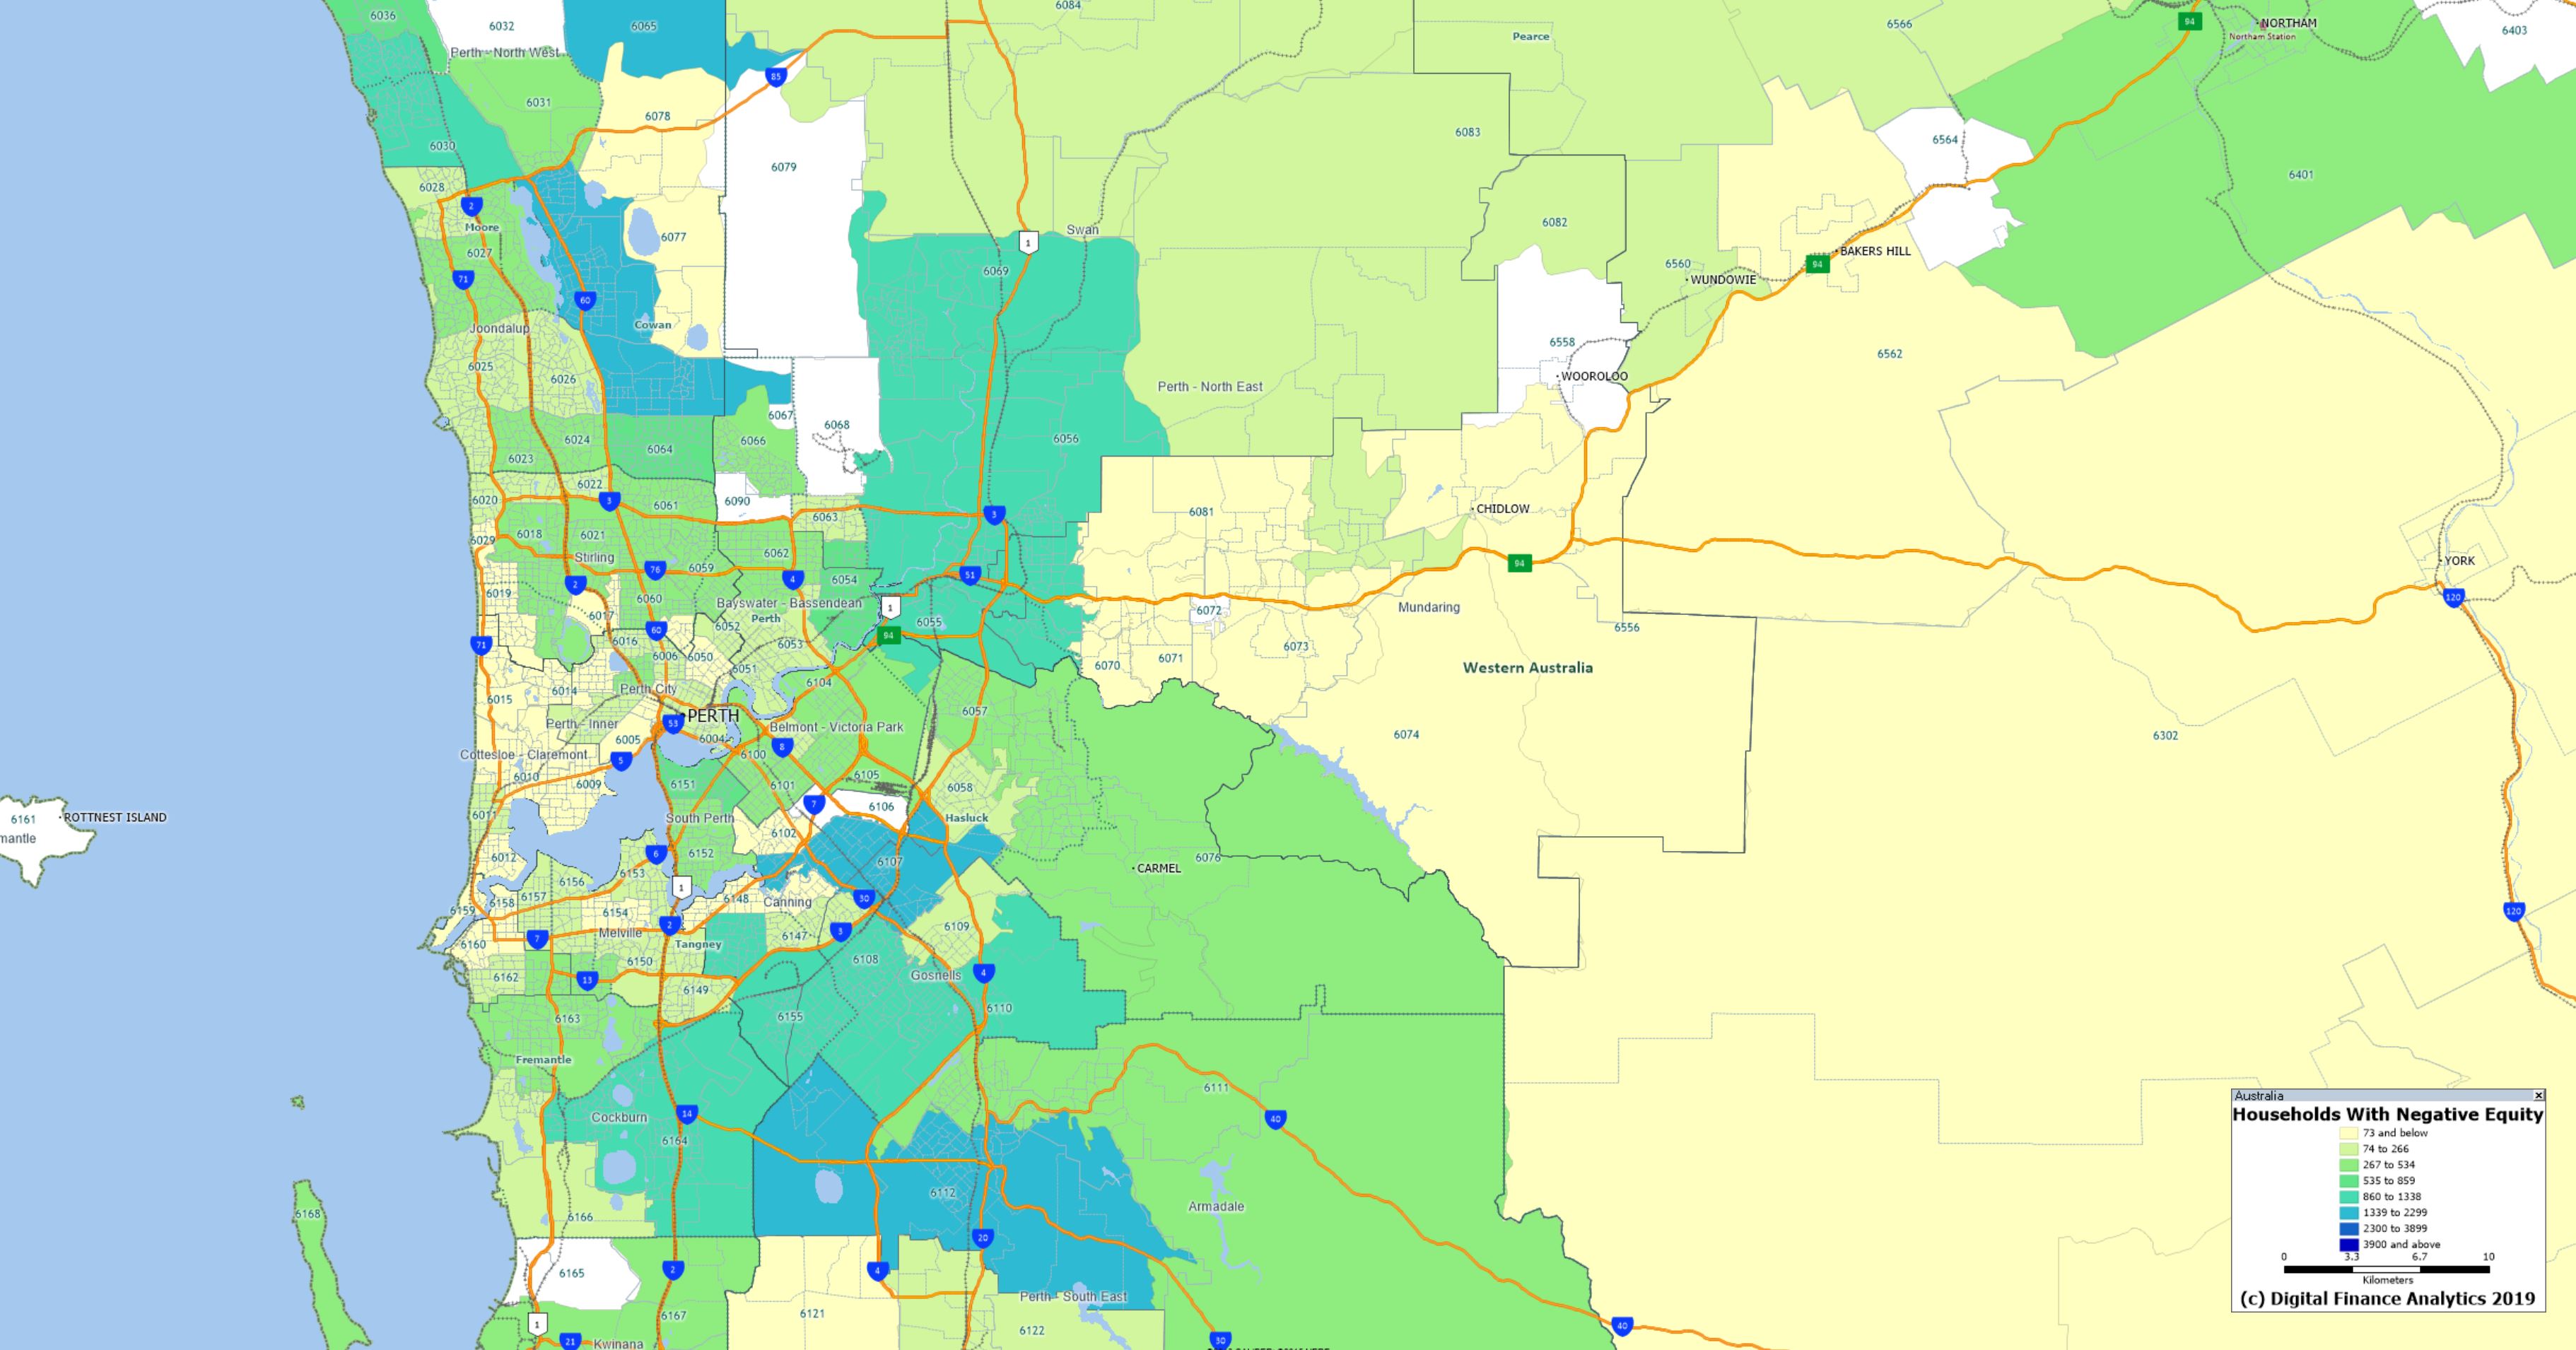
As discussed in my video, this is based on the number of households in each post code recording at least one property in negative equity – where the current mortgage (net of any offset accounts) in greater than the estimated current forced sale value plus sale costs. The analysis is based on results from our 52,000 household surveys nationwide.