
The RBA released their credit aggregates for September today. Overall, lending for housing rose 0.5% to reach another record $1.6 trillion, up $8.6 billion. Within that, owner occupied lending rose 0.6%, up $6.1 billion and investment lending rose 0.4% or $2.5 billion. This is a slightly lower growth rate than a year back (7.5%), but is still strong, well above inflation and wage growth. This means household debts will continue to rise.
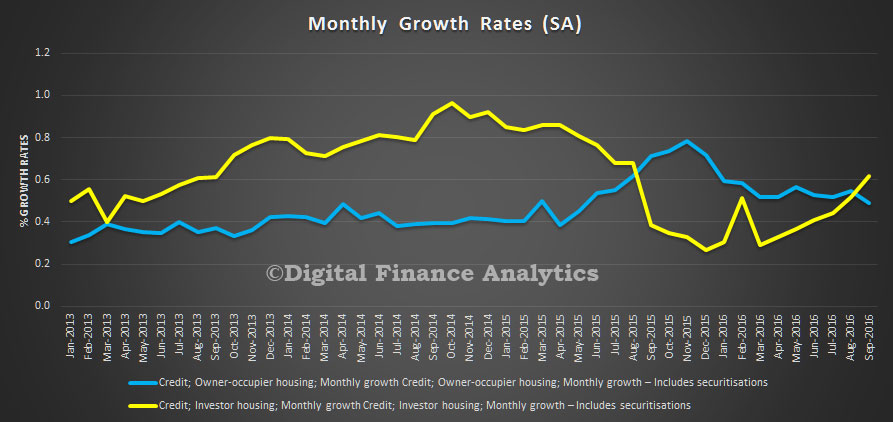
The monthly growth rate for investment mortgages shows a sharp move up, and from March 2016, as banks started to focus on lending to this sector. Lending for owner occupation growth rates fell a little, having peaked at the end of last year.
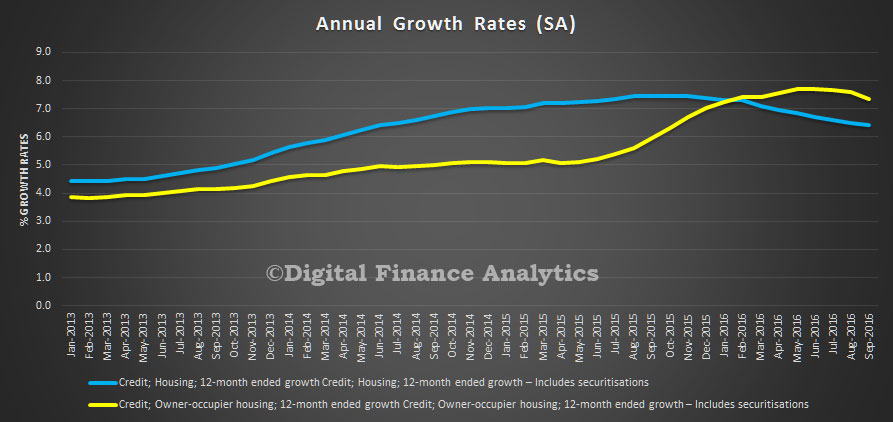
 The annualised analysis shows a tilt down, but if recent trends continue, this will reverse. This is hardly a good indicator that housing lending is under control. Indeed, we saw another high auction clearance rate at the weekend.
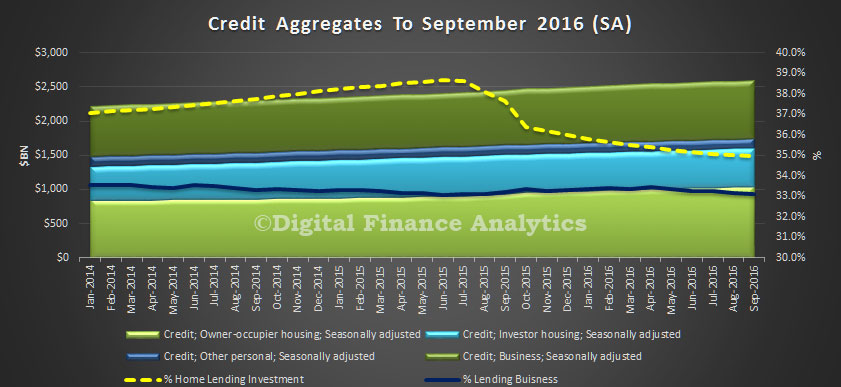
 It is worth noting that there was $1bn of mortgages being switched between owner occupied and investment categories. The proportion of loans for investment purposes is still stitting at 35%. In addition, the proportion of lending to business continues to fall, rising just 0.3% this month, or $2.9 bn. Lending for personal finance fell again, down 0.1%.
 The RBA said:
Following the introduction of an interest rate differential between housing loans to investors and owner-occupiers in mid-2015, a number of borrowers have changed the purpose of their existing loan; the net value of switching of loan purpose from investor to owner-occupier is estimated to have been $45 billion over the period of July 2015 to September 2016, of which $1.0 billion occurred in September 2016. These changes are reflected in the level of owner-occupier and investor credit outstanding. However, growth rates for these series have been adjusted to remove the effect of loan purpose changes.
Note we have used the seasonally adjusted data in our analysis. You can read our analysis of the companion APRA monthly banking stats here.