
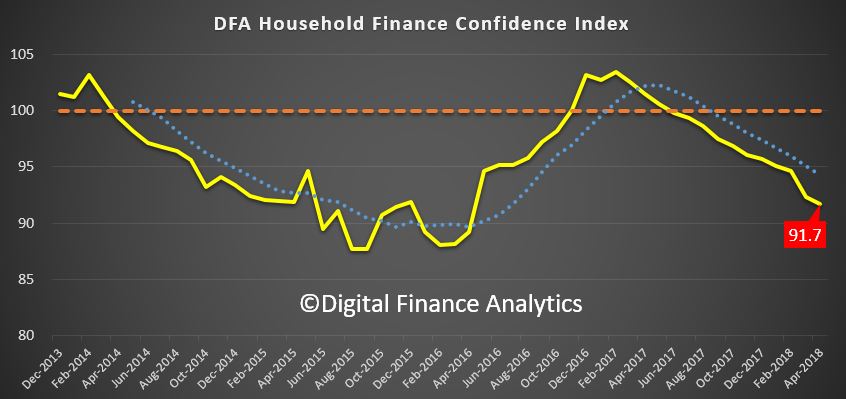
The latest edition of our Household Finance Confidence Index, to the end of April 2018, released today, shows that households remain concerned about their financial situation. This is consistent with rising levels of mortgage stress, as we reported recently.
The index fell to 91.7, down from 92.3 in March. This remains below the neutral 100 setting, and continues the decline since October 2016.
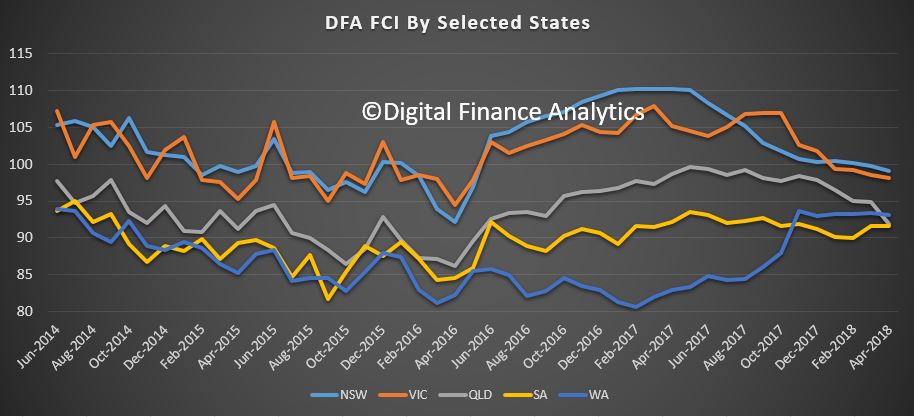
 The largest falls were in the east coast states of NSW, VIC and QLD. There were small rises in SA and TAS, and WA continued to maintain its lower score.
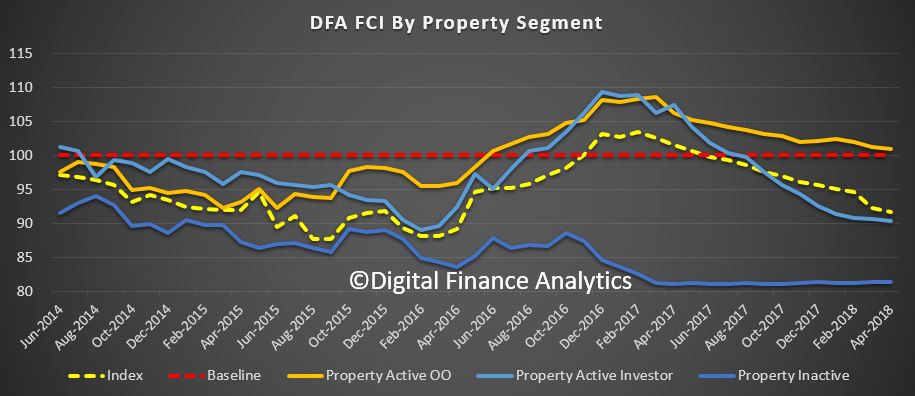
 Analysis by property segment showed that whilst property inactive households continue to languish, there were small falls among owner occupied property active households, who remain just above the neutral setting, while property investors tracked lower again, thanks to tighter lending conditions, the upcoming interest only repayment switch, and the drift down of property values, especially in Sydney. Property owners still remain more confident relative to those renting.
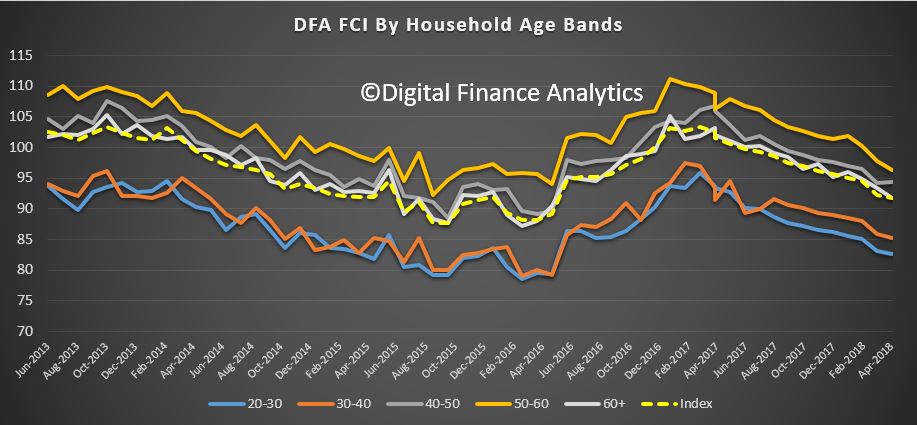
 Looking across the age bands, we see a consistent pattern of falling confidence, with younger households the least confident, driven by job availability, underemployment and flat wages, plus the fact that many do not believe they will ever be able to buy into the property market. Older households, who are more likely to be holding property, remain more confident, relatively speaking.
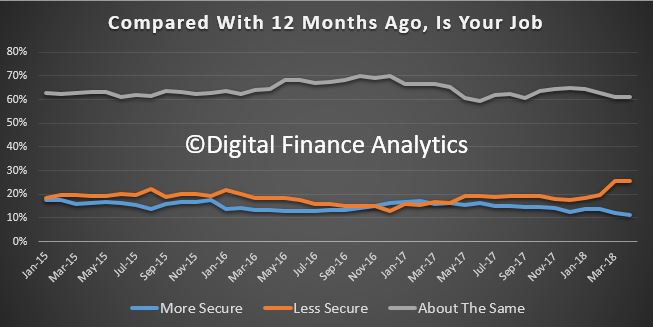
 The index driver scorecard enables us to examine root causes of these shifts in confidence. First for many households job security remains about the same at 61%, but there was a 1% fall in those who felt more confident, and a 1% rise in those feeling less confident. These movements are linked to job availability, and some seasonal factors as the tourist season winds down.
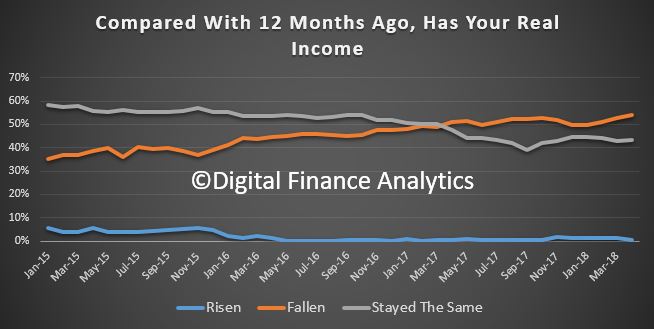
 Turning to household incomes, more than half said their incomes had fallen in real terms, which was 1.4% higher than last month. Only a small number of households reported a real rise in incomes, whilst 44% reported no change. The long term trend of flat incomes is one of the key issues households are facing.
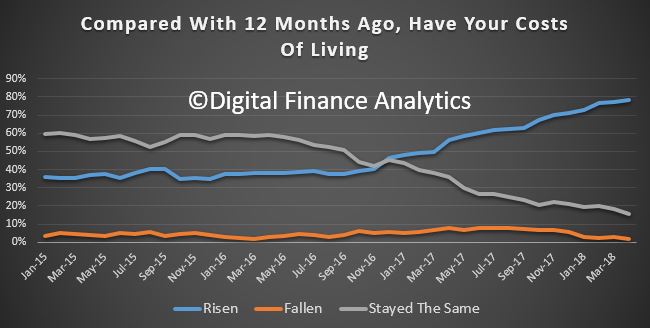
 This is in stark contrast to the rising costs of living. 79% of households reported their costs had risen, up 1.4% compared with last month, 16% reported no change in costs, down 2.5%, and just 1.7% said their costs of living had fallen. Looking across categories, the costs of electricity, school fees, health care Costs and fuel all registered.
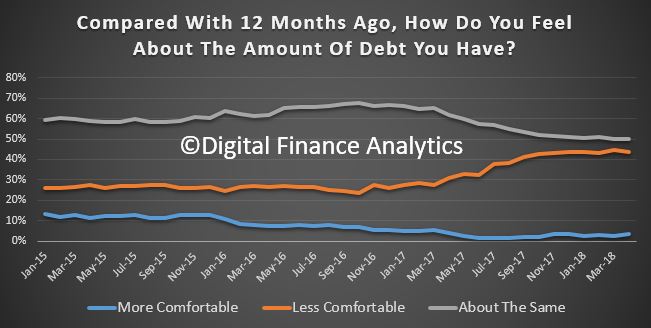
 Turning to debt, we see a continued rise in those households concerned about their levels of debt. Just 3% are more comfortable than a year ago, 50% about the same, and 44% less comfortable. Households referred to the changes in mortgage rates – with some higher costs still working though, and the problem some had in finding a better loan to switch to as part of a refinancing transaction. Interest only property investors were significantly more concerned than a month ago. In addition more households are putting costs on credit cards to manage their finances or accessed other forms of personal credit.
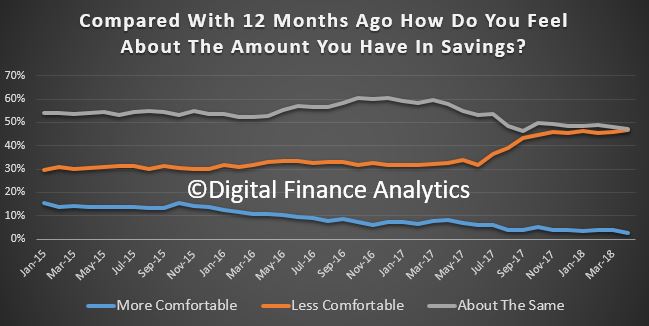
 Looking at savings, 47% of households were less comfortable with the savings they hold – up 1% and many are raiding these savings to maintain their cash flows. The number who were more comfortable fell 1%, thanks to lower rates on many bank deposits. Those who were about the same – 50% – benefitted mainly from recent positive stock market movements.
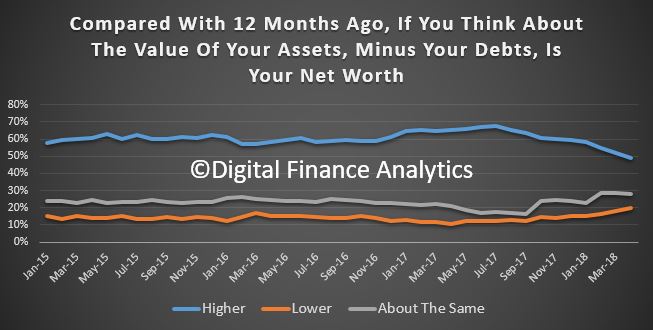
 So, finally, the proportion of households who see their net worth higher at 50% is down 2.5%, reflecting falls in Sydney property prices, while 20% reported higher net worth, mainly thanks to property rises in SA and TAS, and positive stock market movements.
 So to conclude, we continue to see little on the horizon to suggest that household financial confidence will improve. Currently, wages growth will remain contained, and home prices are likely to slide further, while costs of living pressures continue to grow.
Whilst banks have reduced their investor mortgage interest rates to attract new borrowers, we believe there will also be more pressure on mortgage interest rates as funding costs rise, and lower rates on deposits as banks trim these rates to protect their net margins. In the last reporting round, the banks were highlighting pressure on their margins as the back-book pricing benefit from last year ebbs away.

By way of background, these results are derived from our household surveys, averaged across Australia. We have 52,000 households in our sample at any one time. We include detailed questions covering various aspects of a household’s financial footprint. The index measures how households are feeling about their financial health. To calculate the index we ask questions which cover a number of different dimensions. We start by asking households how confident they are feeling about their job security, whether their real income has risen or fallen in the past year, their view on their costs of living over the same period, whether they have increased their loans and other outstanding debts including credit cards and whether they are saving more than last year. Finally we ask about their overall change in net worth over the past 12 months – by net worth we mean net assets less outstanding debts.
We will update the index next month.