
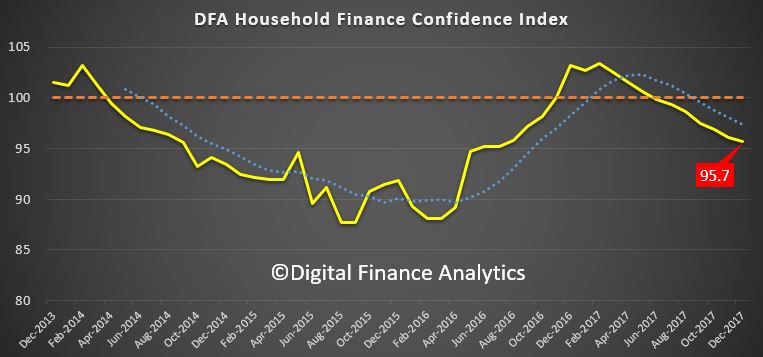
The latest edition of the Digital Finance Analytics Household Financial Security Confidence Index, to December 2017 shows another fall, down from 96.1 last month to 95.7 this time, and remains below the neutral measure of 100.
The trend continues to drift south as flat incomes, big debt and now falling home prices all impact.
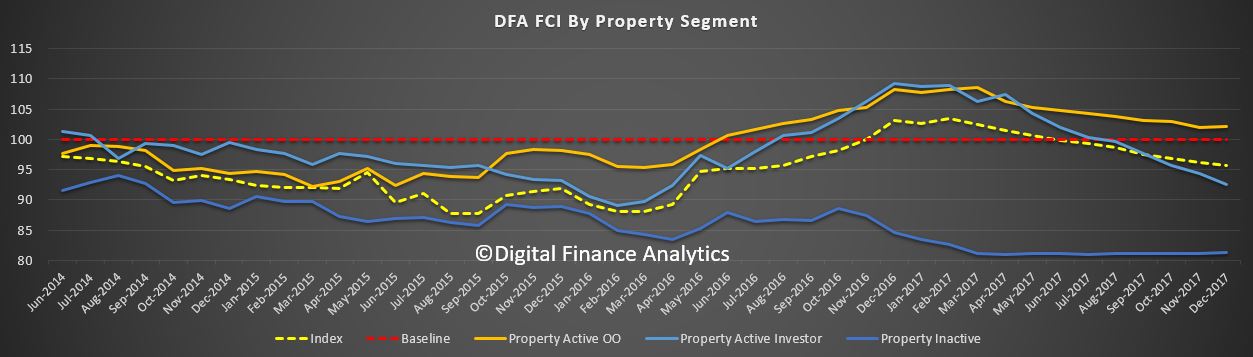
 Analysis of households by their property owning status reveals that property investors are in particular turning sour, as flat net rental incomes, and rising interest rates hit many, at a time when property capital growth is stalling. Owner occupied households are faring a little better, thanks to a range of ultra cheap mortgage rates on offer at the moment, but they are also concerned about price momentum. Those without property interests remain the least confident, as the costs of renting outstrip income growth, and more are slipping into rental stress.
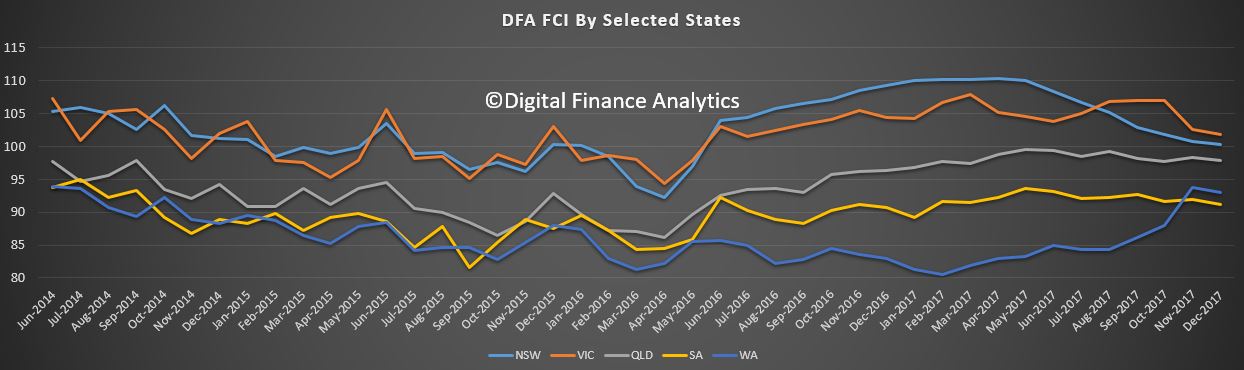
 Looking across the states, they all slipped a little, with NSW now well behind VIC (we think the Victorian market is about 6 months behind Sydney, so will drift lower ahead). WA has not improved this time, suggesting that those talking up the market in the west may be over optimistic.
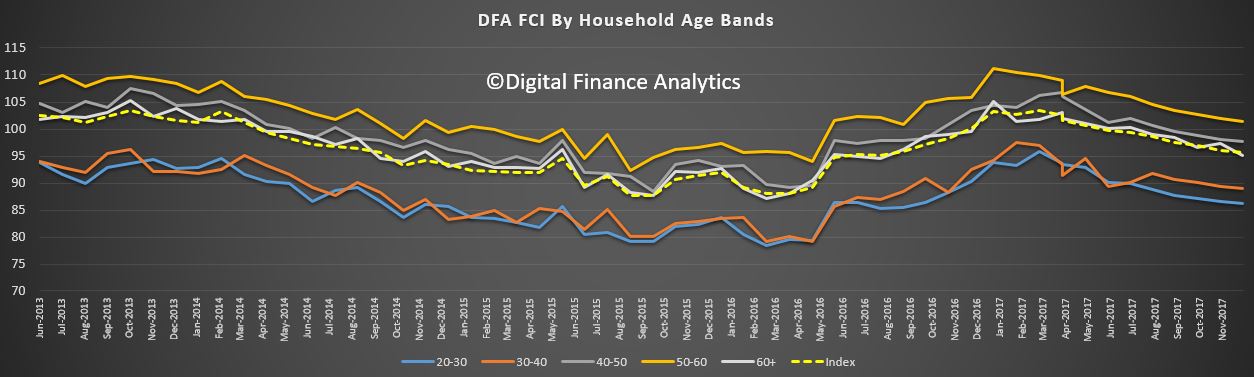
 Across the age groups, young households are most concerned about their financial position, but every age group shows a small fall this month – perhaps thanks to the Christmas binge (though we think credit card debt will not rise that much this year) and retail stats may be lower than expected.
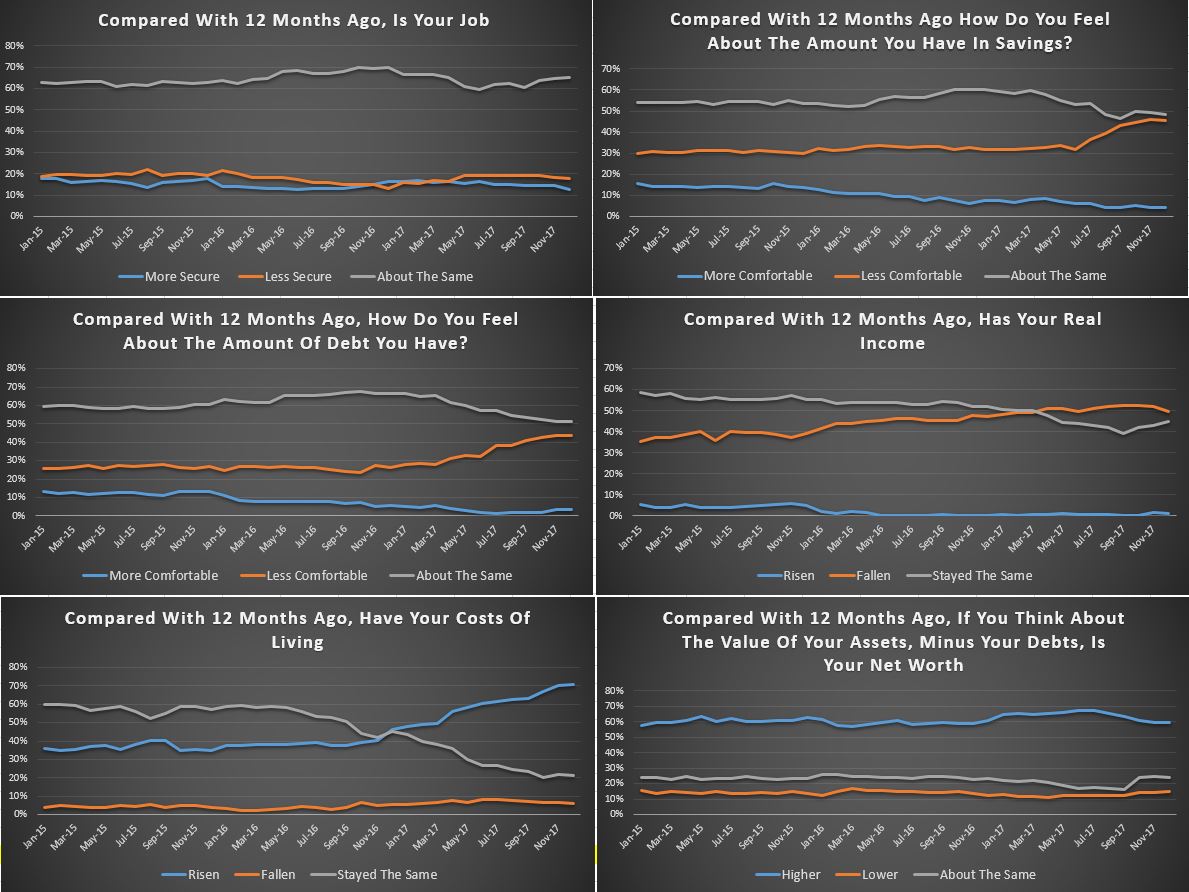
 Looking in detail at the scorecard, which shows the elements which drive the index; job security is pretty stable, but savings are being raided by many to support their finances, while rates on bank deposits continue to drift lower. Households are becoming increasingly uncomfortable with the level of debt they hold (they should at a ratio of 2:1, debt to income). Income continues to fall in real terms and costs of living are rising (child care costs and rising fuel costs are concerning many). We also see a slide in net worth, as home prices, especially in the Sydney region decline. This despite high stock market prices at the moment.
 We cannot see any circuit breakers in the mix ahead, so we expect the falling trend to continue into autumn.

By way of background, these results are derived from our household surveys, averaged across Australia. We have 52,000 households in our sample at any one time. We include detailed questions covering various aspects of a household’s financial footprint. The index measures how households are feeling about their financial health. To calculate the index we ask questions which cover a number of different dimensions. We start by asking households how confident they are feeling about their job security, whether their real income has risen or fallen in the past year, their view on their costs of living over the same period, whether they have increased their loans and other outstanding debts including credit cards and whether they are saving more than last year. Finally we ask about their overall change in net worth over the past 12 months – by net worth we mean net assets less outstanding debts.
We will update the results again next month.