
The latest APRA data showing ADI Property Exposures to June 2017 gives us a read on the mix of business by lender type. The new business data is the most relevant in monitoring current market changes. But we look at the loan stock data first. Home lending grew at 7.3% past 12 months, significantly above inflation and wage growth, underscoring continued household indebtedness. The debt monster continues to grow!
Overall, the ADIs’ residential term loans to households were $1.54 trillion as at 30 June 2017, an increase of $105.2 billion (7.3 per cent) on 30 June 2016. Owner-occupied loans were $1,006.2 billion (65.3 per cent), an increase of $75.8 billion (8.1 per cent) from 30 June 2016; and investor loans were $535.7 billion (34.7 per cent), an increase of $29.4 billion (5.8 per cent) from 30 June 2016.
Looking at new loans, ADIs with greater than $1 billion of residential term loans approved $384.0 billion of new loans in the year ending 30 June 2017. This is an increase of $12.0 billion (3.2 per cent) on the year ending 30 June 2016. Of these new loan approvals: Owner-occupied loan approvals were $249.9 billion (65.1 per cent), a decrease of $1.1 billion (0.5 per cent) from the year ending 30 June 2016 and Investment loan approvals were $134.1 billion (34.9 per cent), an increase of $13.2 billion (10.9 per cent) from the year ending 30 June 2016.
Now, APRA warns they are using different metrics to monitor IO loans:
The data used by APRA to monitor ADIs’ new interest-only lending is not the same as the source data for the statistics in this publication. First, APRA monitors ADIs’ new interest-only lending using data on loans funded; statistics in this publication show loans approved. Loans approved is a broader definition than loans funded; loans approved may not necessarily be funded. Second, APRA monitors new interest-only loans funded by all ADIs; interest-only mortgage statistics in this publication are based on data reported by 32 ADIs with over $1bn in residential term loans.
We think APRA should be transparent about their IO loans data, as we cannot see what is occurring. They have not explained WHY they are mixing the two measurement methods and why they do not reveal the true picture. Also of course IO loans for non-banks are not included in their statistics. So, again we get a partial view.
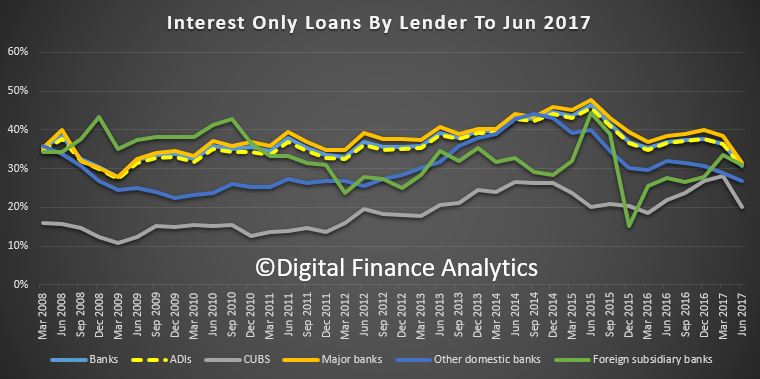
That said, we see a significant drop in the relative number of IO loans written since they intervened in the market. All lender categories show a fall. The average across ADI’s is still above 30%.
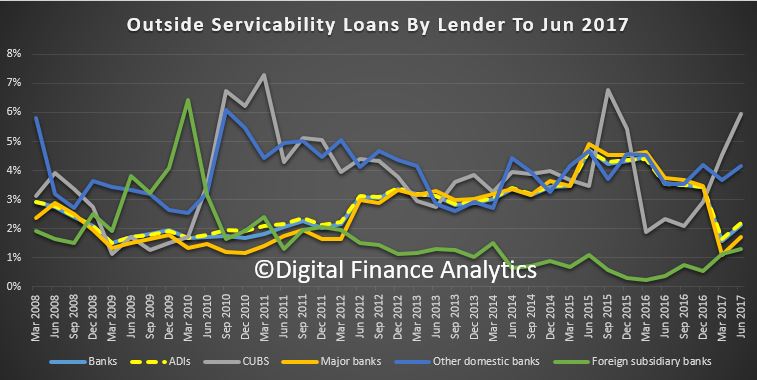
 Another indicator is the proportion of loans approved outside serviceability, the proportion of loans in the category has risen. 6% of CUBS (combined Credit Unions and Building Societies) were outside normal criteria. This may be an indicator of higher risks, when compared to the lower rates among other lenders.
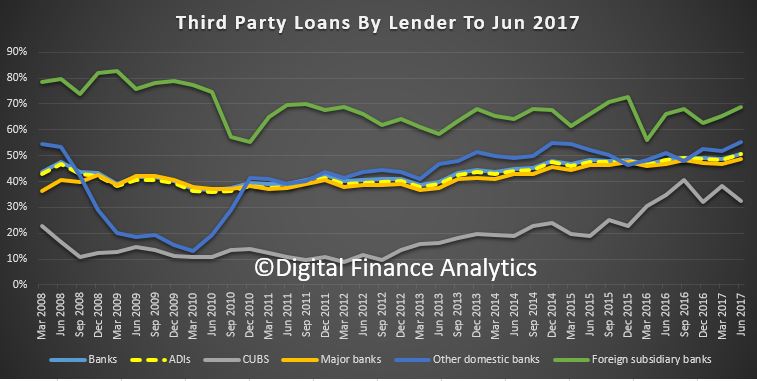
 The proportion of loans via brokers remains pretty strong, with foreign subsidiaries sitting at around 70%, compared with the major banks at 48%. Other domestic banks are a little higher, whilst CUBS are lower.
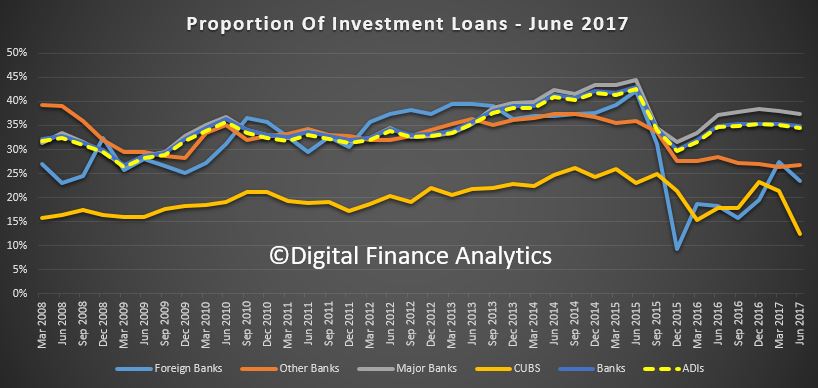
 Major Banks are lending more investor home loans (37.3%), compared with market at 34.5%.
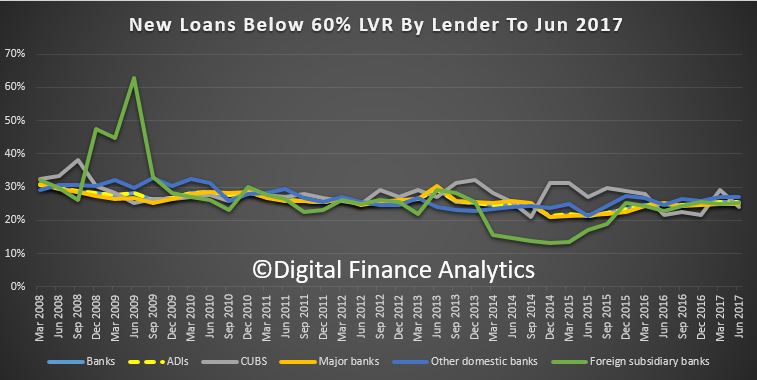
 Turning to the LVR bands for new borrowing, the proportion below LVR 60% remains relatively stable, but has risen a little.
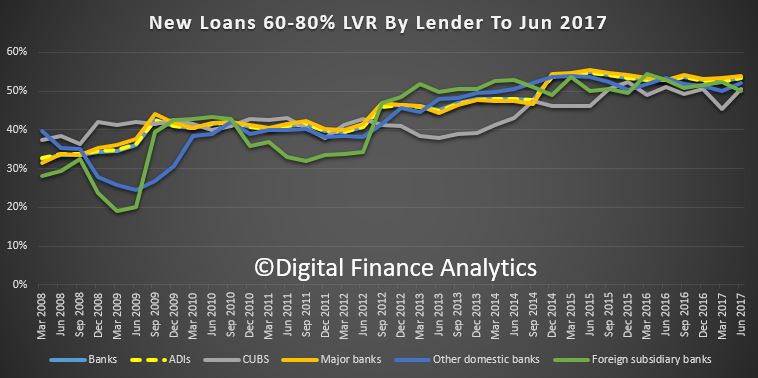
 Around half of all new loans, across most lenders are in the LVR 60-80% range, and has risen a little.
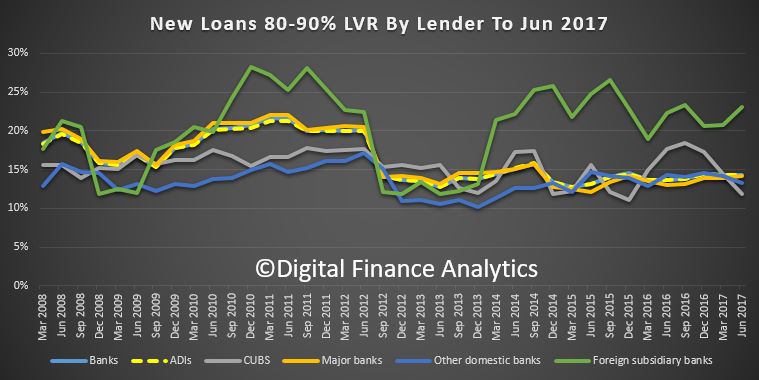
 We see a rise in 80-90% LVR loans from the foreign banks, a fall in CUBS and a relatively stable picture across the other lenders.
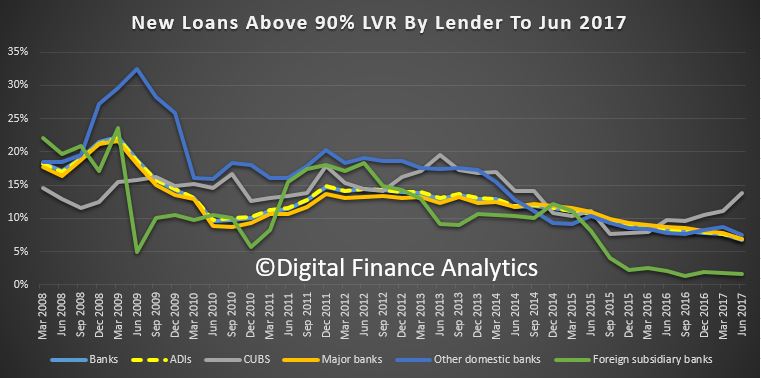
 Higher LVR loans, above 90% are down slightly, apart from CUBS (though small volumes).
 APRA also made a change this time by merging Credit Union and Building Society in a single set of tables.
As of the June 2017 edition of the Quarterly ADI Property Exposures publication, the standalone building societies tables (tables 3a, 3b, and 3c in previous editions) and the standalone credit unions tables (tables 4a, 4b, and 4c in previous editions) will be discontinued and replaced by the combined credit unions and building societies tables
One thought on “IO Mortgages On The Decline, But Loans Outside Normal Serviceability Rises”