
After I posted yesterday on the rise of the Bank of Mum and Dad, this chart has caused quite a stir. A number of people have questioned the data saying it could not possibly be correct (without supporting facts I might add).
So lets look in more detail at the chart.
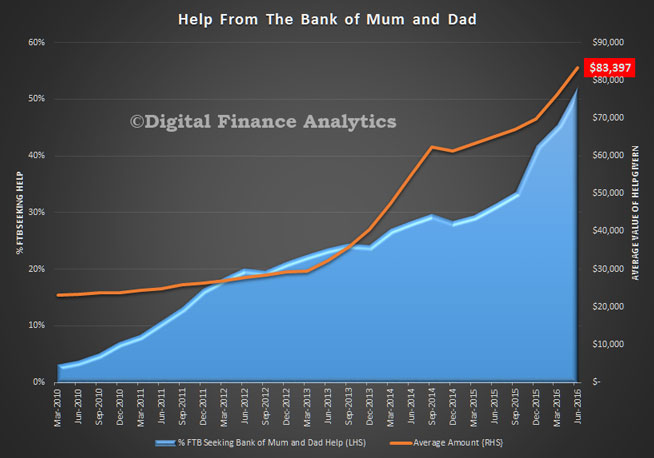 First, the proportion of FTB needing help from the Bank of Mum and Dad have risen from ~5% 6 years ago, to ~50% now. A number of things have changed. First most of the FTB grants which were available in 2010 have dissipated. Second, home prices are rising much faster than income. Third FTB are desperate to get into the market – either for OO, or as an investment as they see prices running away despite high debt. Banks have tightened their lending criteria. So more are looking to family to help. We have been tracking this rising trend over the years. It has accelerated in the past year or so.
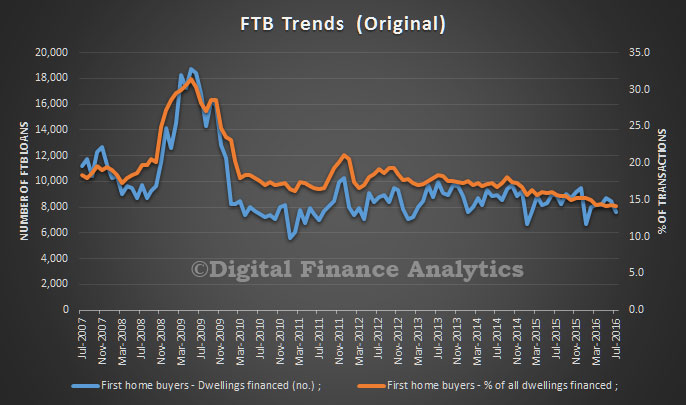 Something else to bear in mind is that in 2009-2010, the volume of FTB loans being written was higher more than 30% of the market. So the number of FTB in 2010 getting help would be higher for a lower percentage. I think this has been overlooked by those complaining about the post. The data is based on those who have transacted.
Next, the average loan from the Bank of Mum and Dad to those who had access to this source of funds six years ago was ~$30k, today it is ~$88k. This reflects the massive rises in property prices in most states in the past few years. The average dwelling price is $623,000 now, according to the ABS. This rise in capital has also created the opportunity for more families to extract capital from their existing home to help the next generation. In addition, banks have tightened their underwriting criteria recently. As a result, FTB need bigger deposits. Finally, larger prices mean larger transaction fees (and bigger lenders mortgage insurance fees).
These two forces are working together, but you cannot, as some have done, simply multiplied the two elements together. You will get a silly and meaningless number.
The data is the data, and the method has not changed over the period. So we stand by the analysis.
3 thoughts on “Is The Bank of Mum and Dad Data Right?”