
The RBA statistical tables were released just before Christmas, and it included E2 – Selected Household Ratios. This chart of the data tells the story – the ratio of debt to income deteriorated again (no surprise given the 6%+ growth in mortgage debt, and the ~2% income growth). This got hardly any coverage, until now. Since then mortgage debt is up again, so the ratio will probably cross the 200 point Rubicon next quarter.
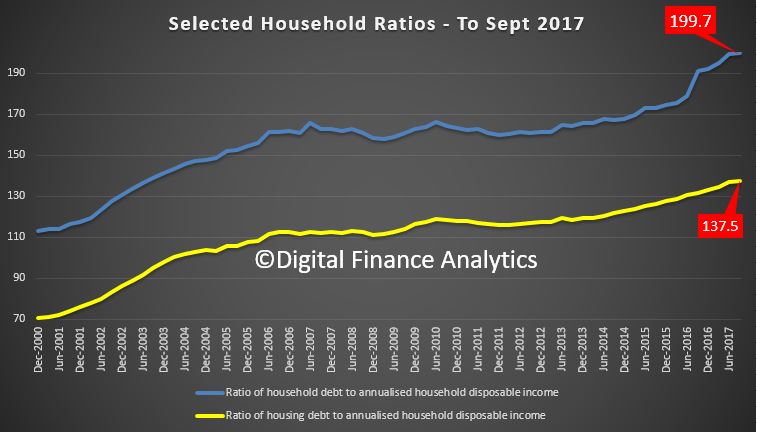 The ratio of total debt to income is now an astronomical 199.7, and housing debt 137.5. Both are at all time records, and underscores the deep problem we have with high debt. [Note: the chart scale does not start from zero]
Granted in the current low interest rate environment repayments are just about manageable (for some), thanks to the cash rate cuts the RBA made but even a small rise will put significant pressure on households. And rates will rise.
Highly relevant given our earlier post about [US] household spending being the critical economic growth driver, Australia is no different.
The current settings will lead to many years of strain for many households. We are backed into a corner, with no easy way to exit.