
APRA released their quarterly property exposure statistics yesterday, to September 2018, alongside the quarterly performance statistics which we will discuss in a separate post. Worth pausing to say this is aggregated data, so we cannot get a feel for individual banks, though a cross sector view does provide some context. Worth also saying they warn us not to use this data to assess the state of the market (which begs the question, then why publish this data?). More opaque behaviour from the Regulator.
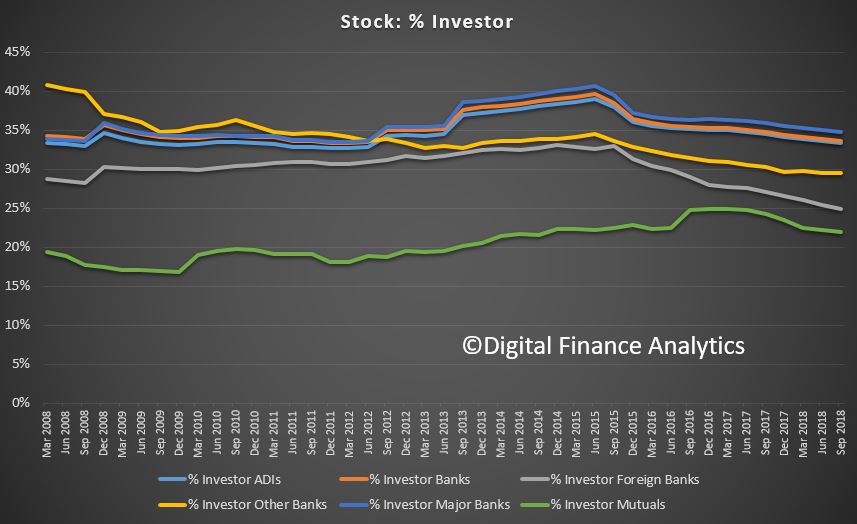
We will start with the loan stock data. Total loans are around $1.6 trillion. As we know the growth in investor loans has slowed, and the trend lines also reflect some reclassification of loans which went on in recent times. But overall, mortgage stock continues to grow, even if the rate of growth – the credit impulse is slowing.

As a result the share of loans for property investment, relative to all loans is falling now. However the major banks still retain their top spot with around 35% of their portfolios in investor lending. We see a more significant fall in Foreign Banks and Mutuals, relative to the Major banks. Regional banks are in the middle ground.
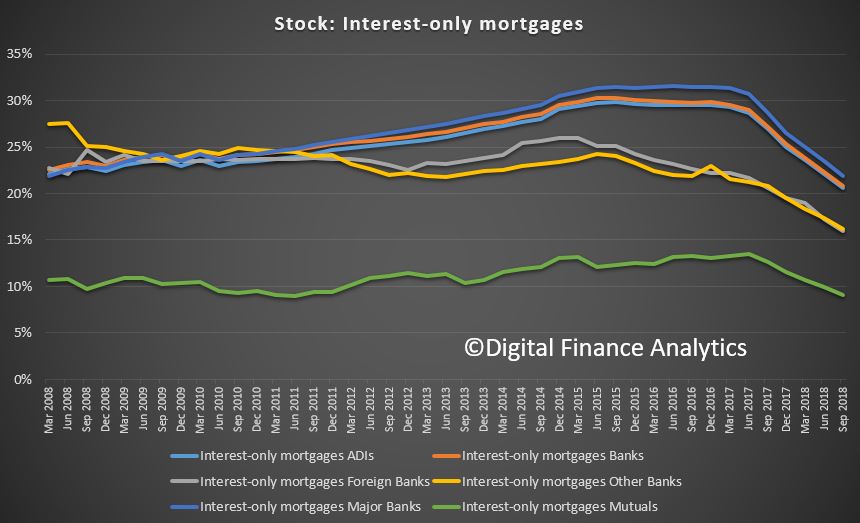
Looking at interest only loan stock, we see a consistent fall, with the Major Banks still close to 20%, down from around 30% in 2015, and Mutuals holding less than 10% of interest only loans by stock.
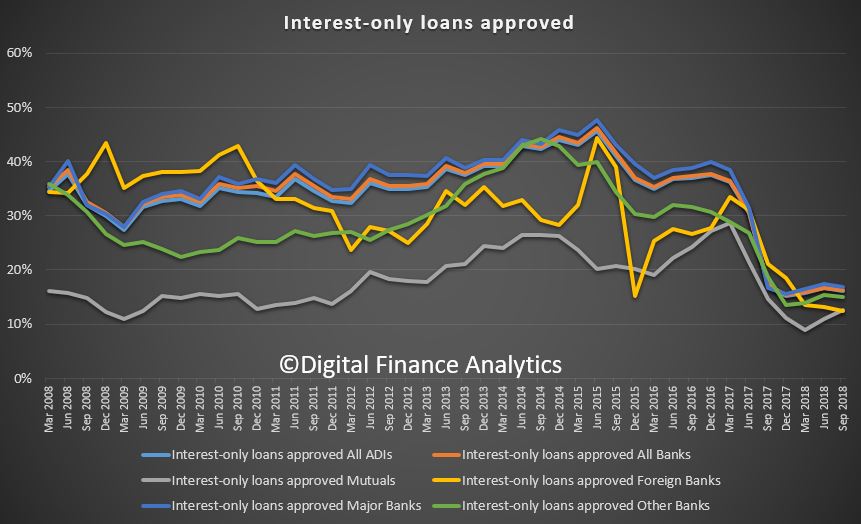
But perhaps the more interesting analysis is to be found in the flow of new loans data. For example, the flow of new interest only loans. We see the proportion of new loans around 10%, though a small rise from the Mutual sector. Major Banks are writing the largest proportion, but way down from more than 40% in 2015, to around 16% now. So you can say that APRA has succeeded in taming the IO beast, even if it was 5 years too late!
Next we turn to investment loans which are down a bit from the pre-APRA intervention post June 2015, but the major banks are still writing around 30% of loans as investment loans – so let s be clear – people are still borrowing! Also we see a rise in investment loans from “other banks”.

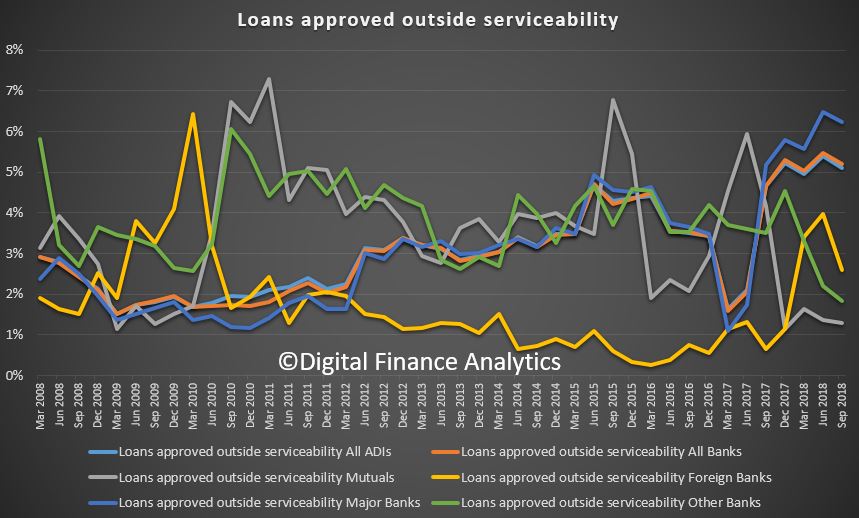
The killer slide is the loans written outside serviceability guidelines. Around 6% of loans written by the major banks are via overrides, where the bank reviews standard criteria and “breaks their own rules”. Back in 2017, it went as low as 1%. Now of course we know that lending criteria have been tightened, but I find this high rate of overrides concerning. This means we are still seeing risk building in the system (despite the falls in home prices).
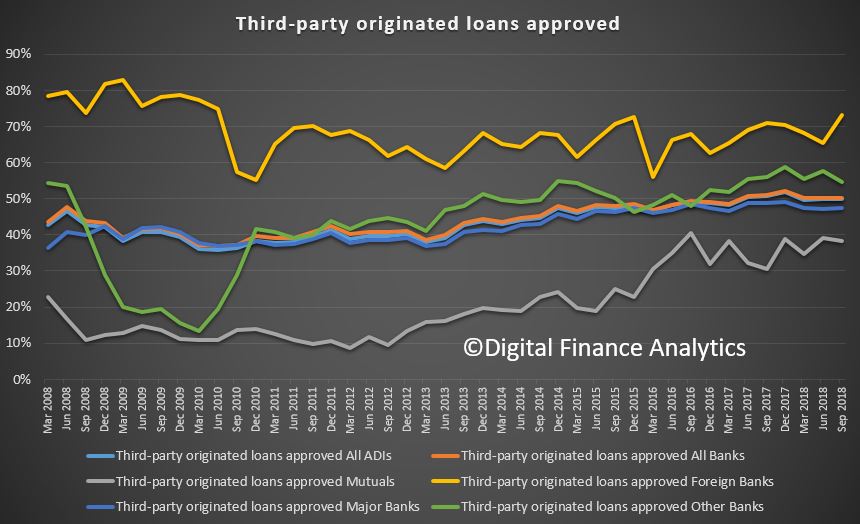
We also see that Mortgage Brokers are still originating a considerable proportion of the book. Overall about half of all loans (by value) are from third party channels, though with Foreign Banks at the top of the pack with more than 70% via Brokers, and Mutuals below 40%.
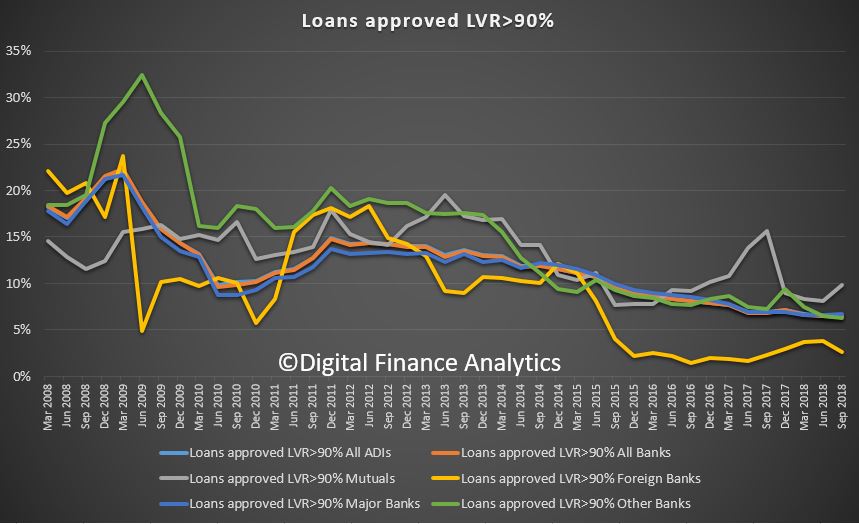
Finally, we can look at the LVR (loan to value) mix, highly relevant given falling prices, as we discussed in a recent post. The share of 90% plus LVR loans is sitting below 10%, though we note a peak from the Mutual sector as they chase business.
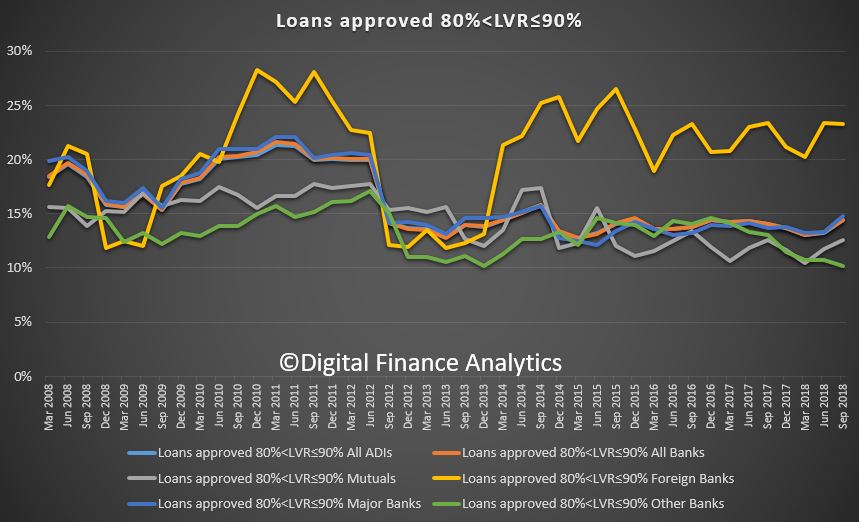
Loans approved between 80 and 90 per cent LVR are on the rise, with Foreign Banks leading the way, and Major Banks and Mutuals also participating. This partly reflects falling property values, meaning the initial LVR tends to be higher. Not a good sign, given the prospect of further falls ahead. Many of these borrowers will have Lenders Mortgage Insurance, which protects the Bank in the case of a default (not the borrower).
The 60 to 80 percent bands remain pretty static.
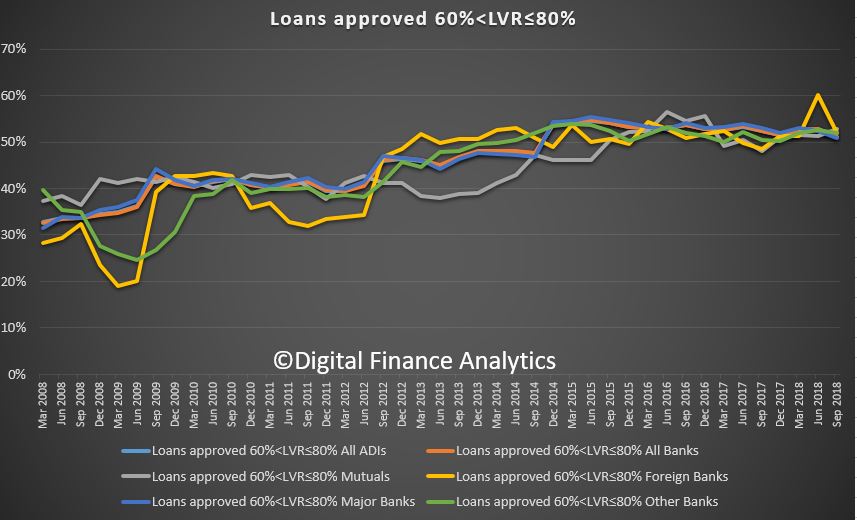
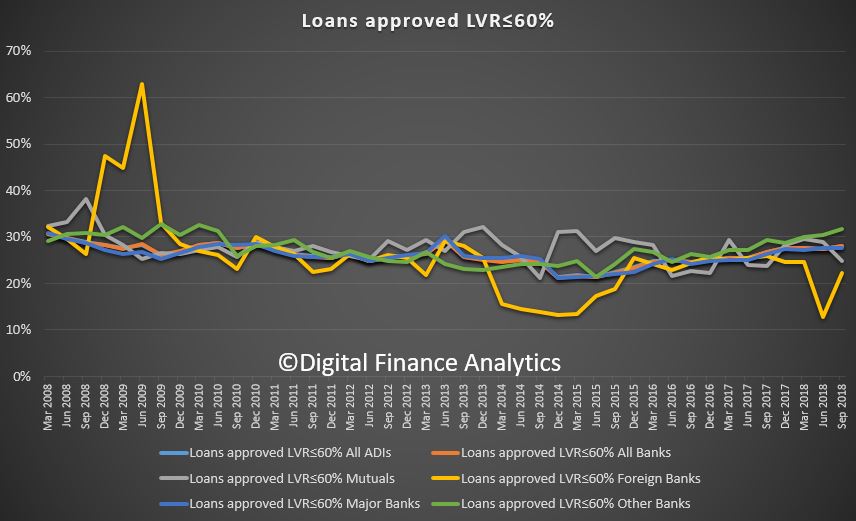
And there is a small rise in the sub 60% LVR loans. This will reflect some loans being refinanced.
So to conclude, while APRA’s measures are having an effect, there are still signs of risky behaviour from lenders who are desperate to write business, because mortgage lending is a critical profit driver for them. However, the tighter underwriting standards are still allowing more loans to be written at higher loan to value ratios and outside standard serviceability. These warning flags should be heeded.
And worth observing there is nothing reported at all on loan to income ratios, probably the most critical dimensions to monitor in a higher risk environment. This is a shameful gap in the data, and should be addressed.