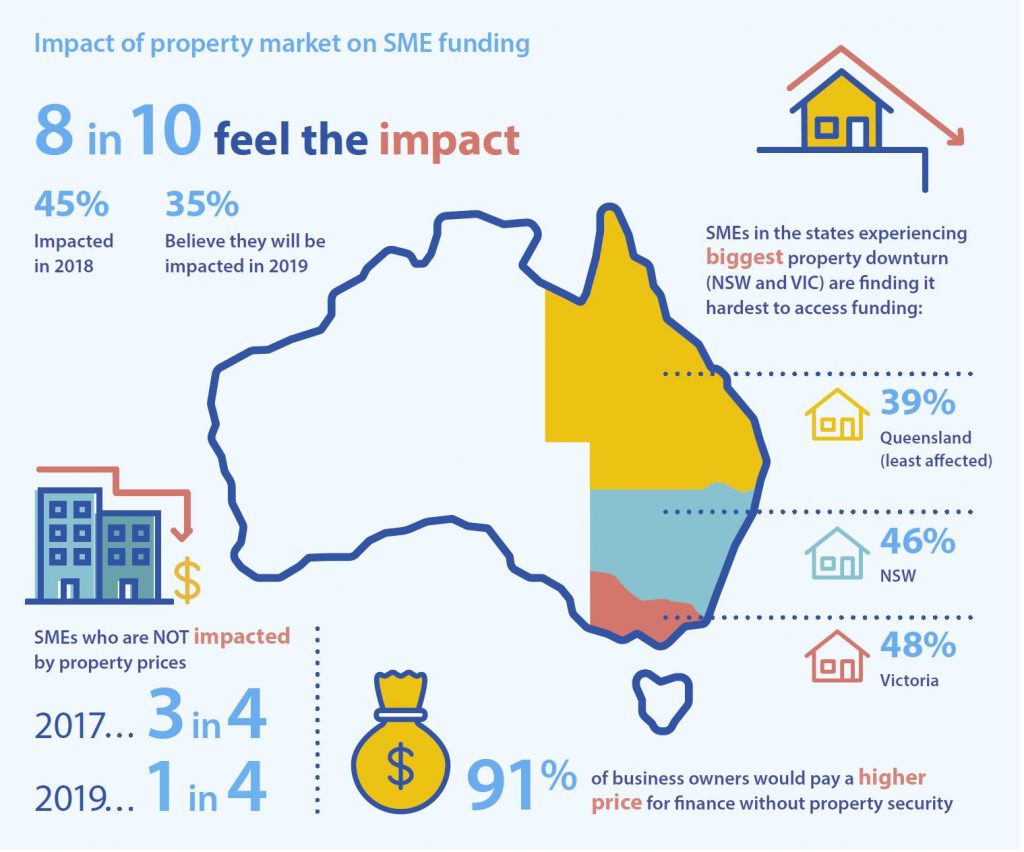
Almost half the SMEs (44.5%) say property market conditions are already making it harder for them to access business funding, likely due to softening house prices in major markets, according to the latest Scottish Pacific Business Finance report, based on research by East & Partners who interviewed 1,257 SME businesses with annual revenues of A$1-20 million over a seven-week period ending 18 January 2019.
Of course this is a relatively narrow segment of the SME market, as many will have significantly lower turnover.
The report said that a further 35% haven’t yet felt the impact, but fully expect the housing price correction and broader property market conditions including slowing loan approvals will have a significant impact on their borrowing capacity.
When property market impact was last assessed in September 2017, three out of four SMEs said property prices were having no direct impact on their businesses. This round, only one in five SMEs said they had not yet seen a direct impact.
This minority of non-affected SMEs perhaps reflects how broad the base of Australia’s small business sector is, with more than two million enterprises across a wide range of industries and regional markets.
Property prices are having more impact on SMEs in Victoria and NSW (affecting 48% and 46% respectively), with Queensland small businesses (39%) the most buffered.
Declining or no-change SMEs are being hit harder by property market movements, with 54% of non-growth SMEs already impacted (compared to 36% of growth SMEs).
For these non-growth SMEs, finances are already stretched thin and they are feeling “when it rains it pours”. These are the businesses that currently need the most support to get through tough market conditions.
More than 91% of SMEs would be prepared to pay a higher rate to obtain finance if they didn’t have to provide real estate security. This overwhelming sentiment is voiced at a time when a sharp correction in residential property prices is affecting capital cities, coupled with falling building approval data and predictions by analysts such as Core Logic and UBS of tough market conditions still to come.
Of the nine out of 10 business owners who say they would be willing to pay a higher rate for finance if they could avoid using property as security, almost two-thirds (65%) indicated they ‘definitely’ would be willing, and more than a quarter (26%) said ‘probably’. Fewer than 1% of SMEs ‘definitely’ would not consider higher rates in place of borrowing against the family home, and just over 1.5% said it would be ‘unlikely’.
According to the Productivity Commission’s draft report into Australian financial system competition, a third to a half of Australian SME loan value is reliant on property security. For the major banks, 35% of their
small business lending (by loan value) is secured by real estate. For banks outside the majors this figure is higher, at almost 47%.
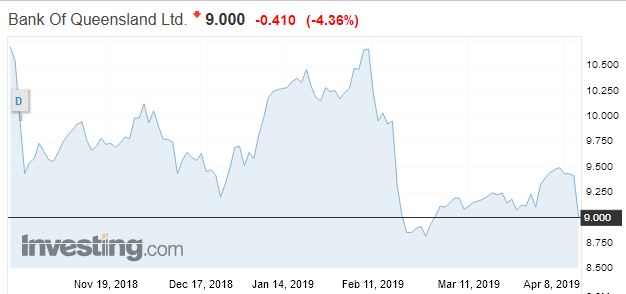
The 2019 half year results from BOQ today really underscores the pressures on the banks – especially regional ones – as home lending slows, and competition for the remaining business rises. And they see similar pressures ahead.
Banking is no longer the cash generating machine it use to be. Expect more loan repricing ahead to try and stablise the business. Their shares were lower. The dividend was cut.
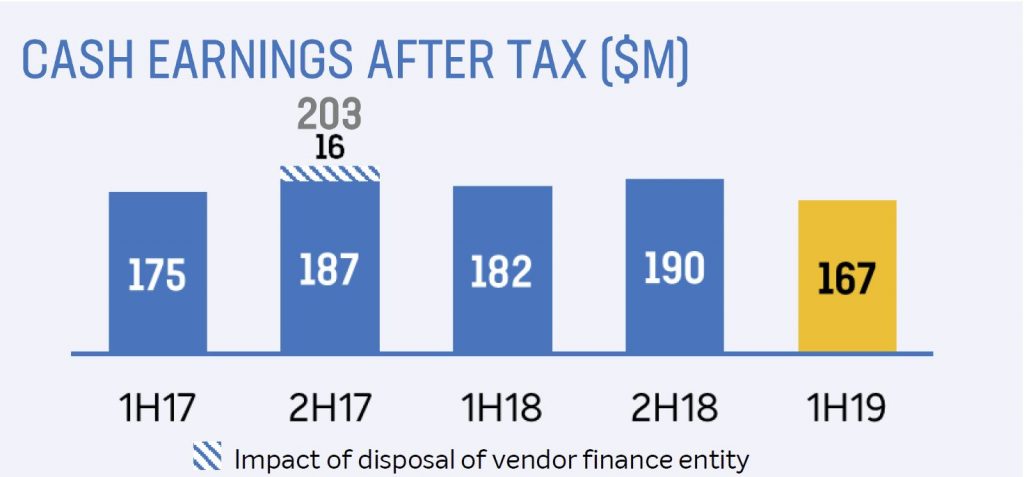
Their cash earnings after tax of $167 million, down 8% compared with 1H18, and 12% down on 2H18. This was pretty much as expected.
Their statutory net profit after tax of $156 million, down 10% on 1H18, or 4% down on 2H18.
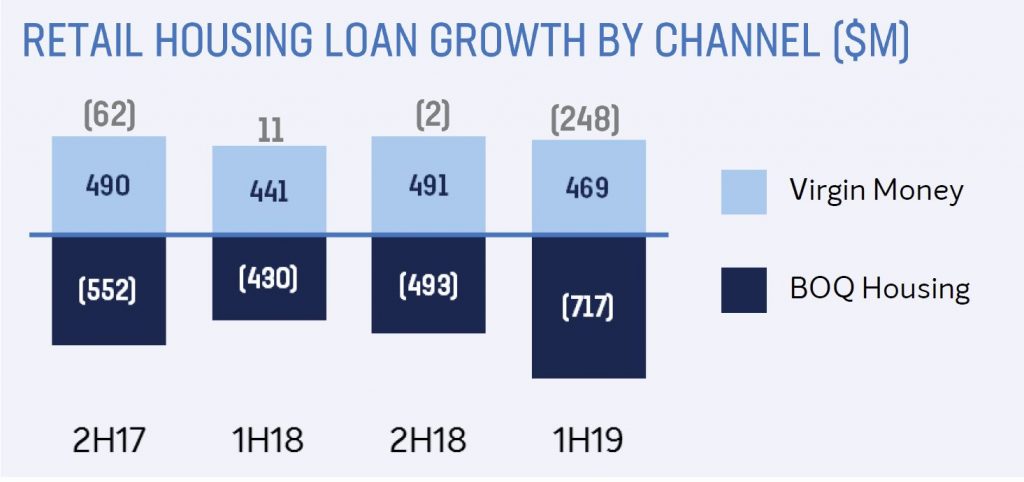
Gross loan growth was 2% in a slowing market, with housing growth through Virgin Money and BOQ Specialist, offset by contraction in branch network.
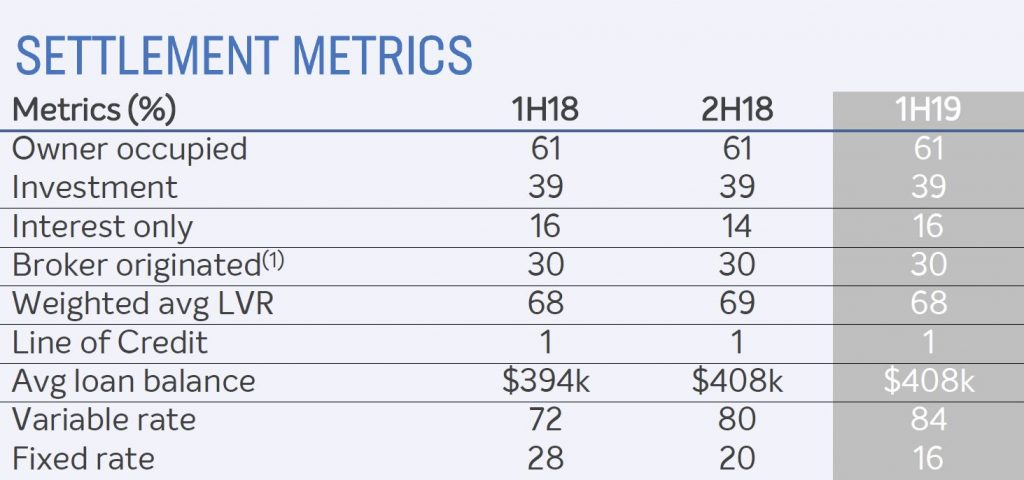
Home lending settlements included 39% investment lending (higher than the current industry average), 30% via brokers, and 16% interest only lending.
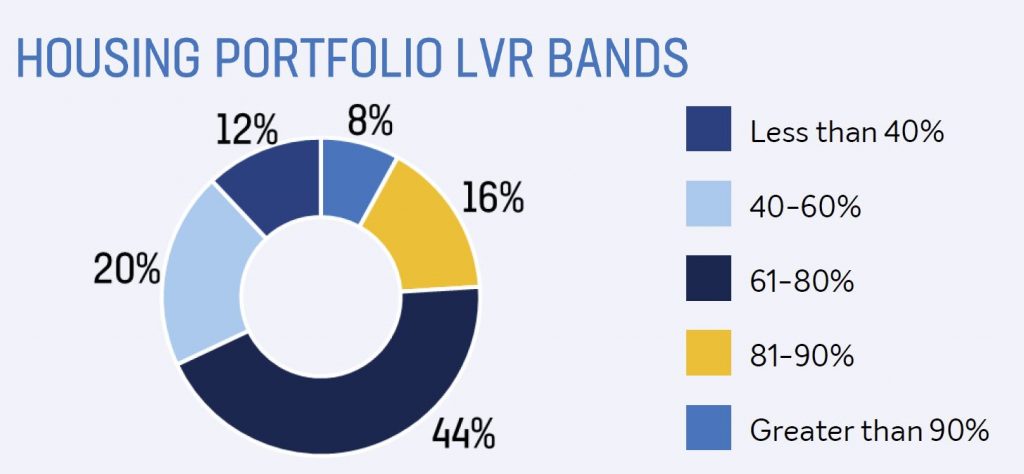
Home Lending LVR’s included 24% above 81% LVR in portfolio. Could become a problem is home prices go on falling.
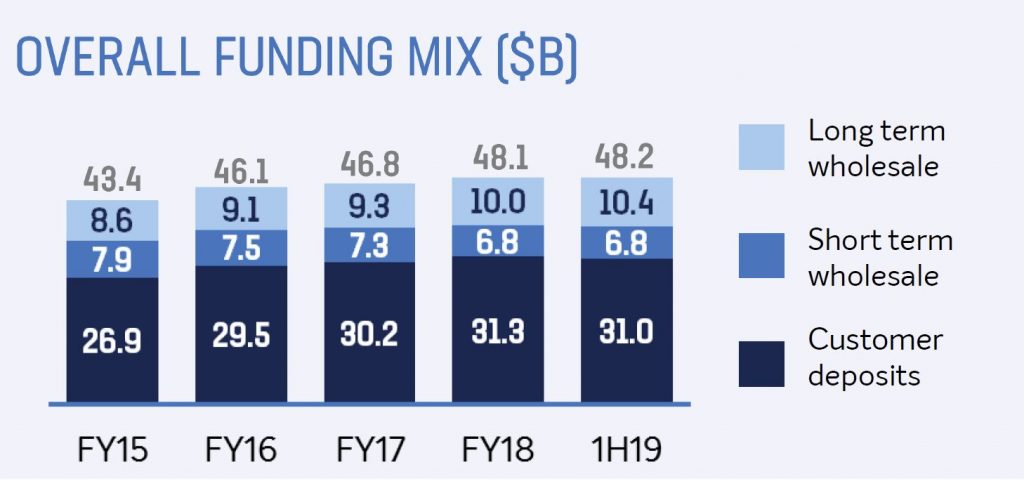
Customer deposits contracted, driven by a reduction in higher cost Term deposits, with a deposit to loan ratio of 68%
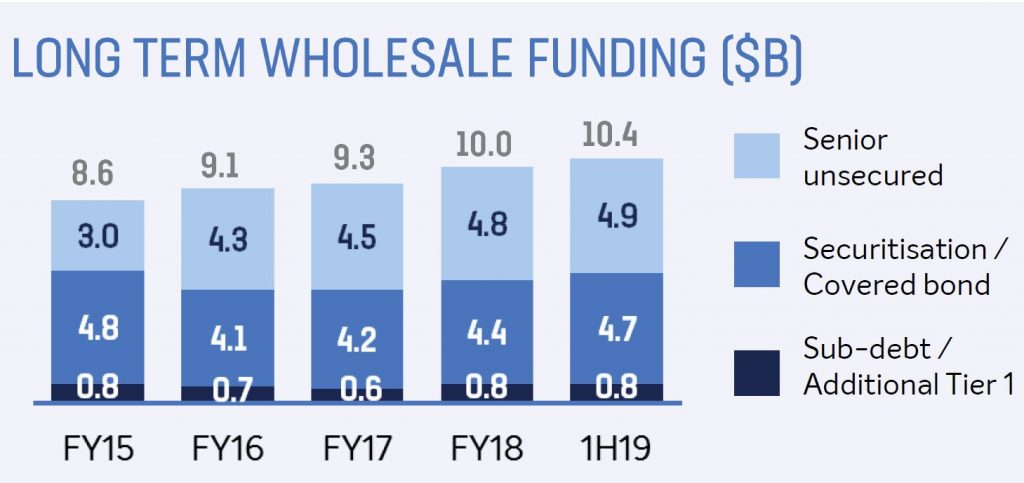
They took advantage of more favourable conditions for long term wholesale issuance
Net interest income was $215m, down 5% compared with 1H18 for the retail banks, and $216m, up 4% for the business bank.
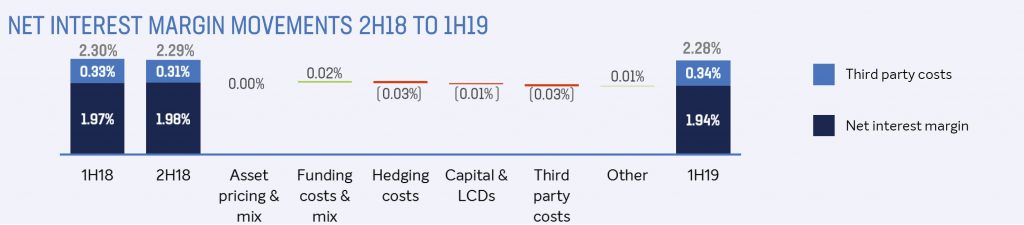
Net Interest Margin was down 4 basis points to 1.94%
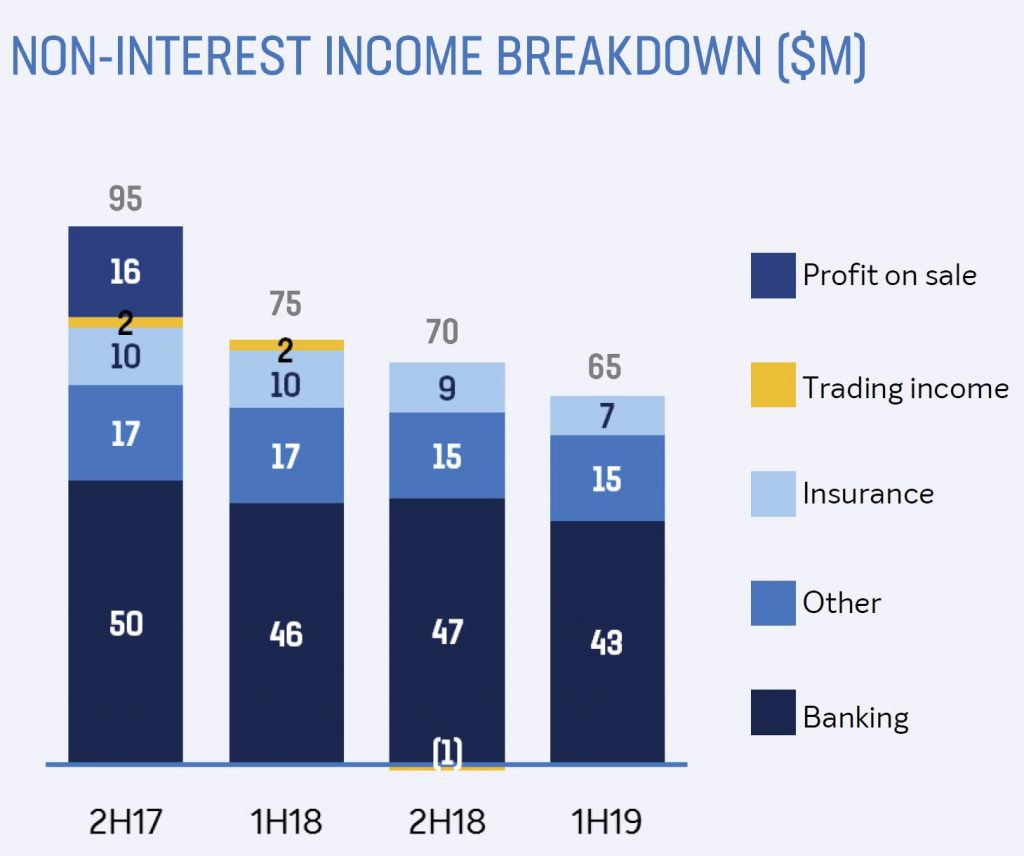
Non interest income was lower at $65m compared with $75m 1H18.
Their cost to income ratio was up 190 bps to 49.5%; They expect amortisation to increase with ongoing investment, plus rising regulatory & compliance costs expected going forward. In fact BOQ took a further $3m below the line for regulatory and compliance spend and $1m for legacy costs.
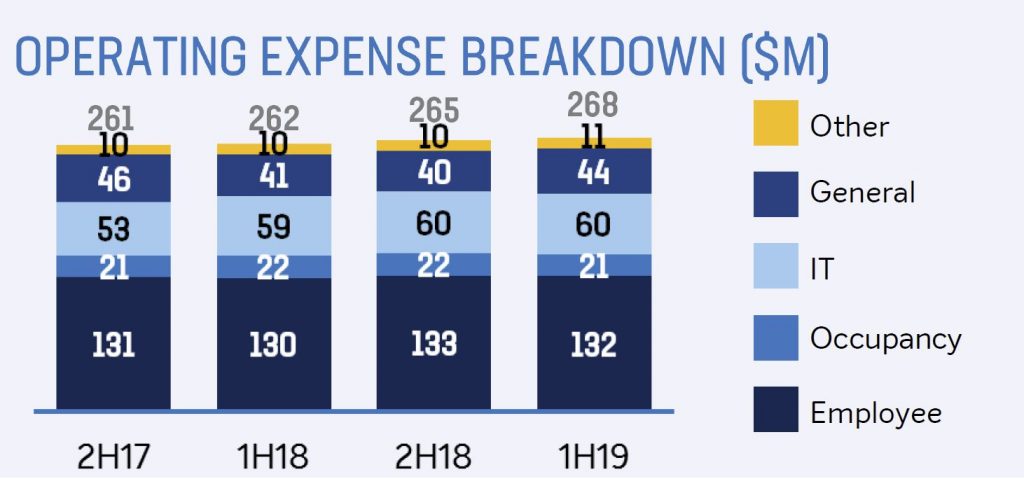
Operating expense growth was 2% to $268m and they expect higher costs ahead, with an additional $10m for regulatory costs.
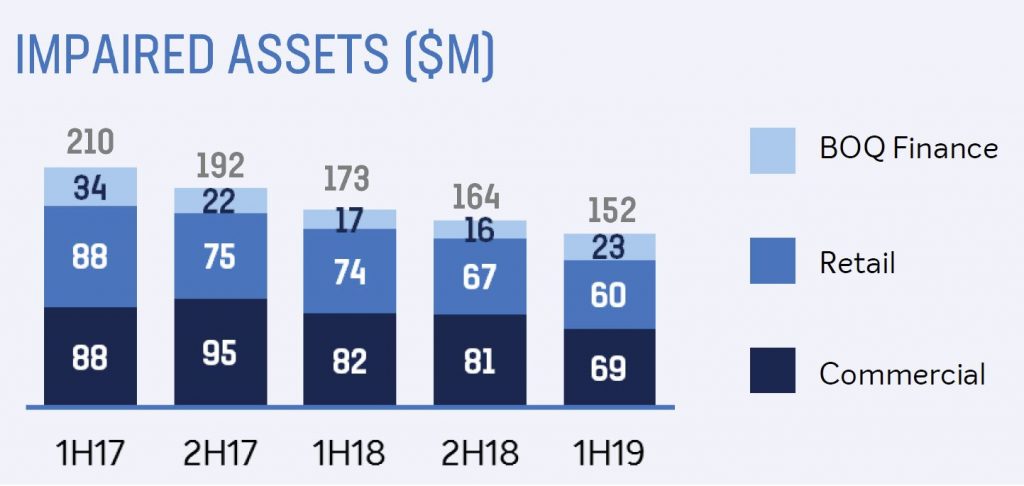
Impaired assets were down to $152m 1H19.
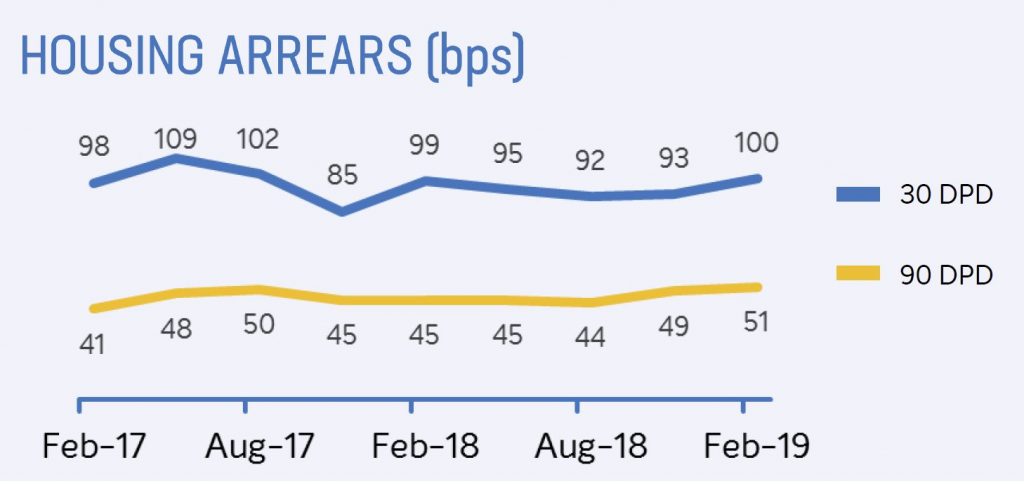
They reported a loan impairment expense of $30 million or 13 basis points of gross loans. There was an uptick in housing arrears.
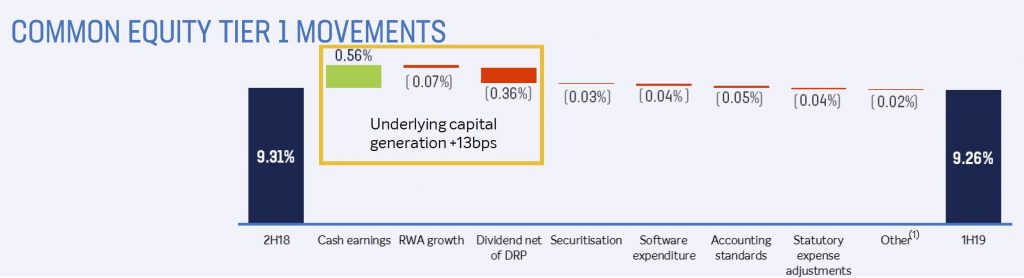
Common Equity Tier 1 (CET1) capital ratio of 9.26%, down from 9.31% 2H18.
The basic earnings per share down 10% to 41.8 cents on 1H18, but 13% down on 2H18.
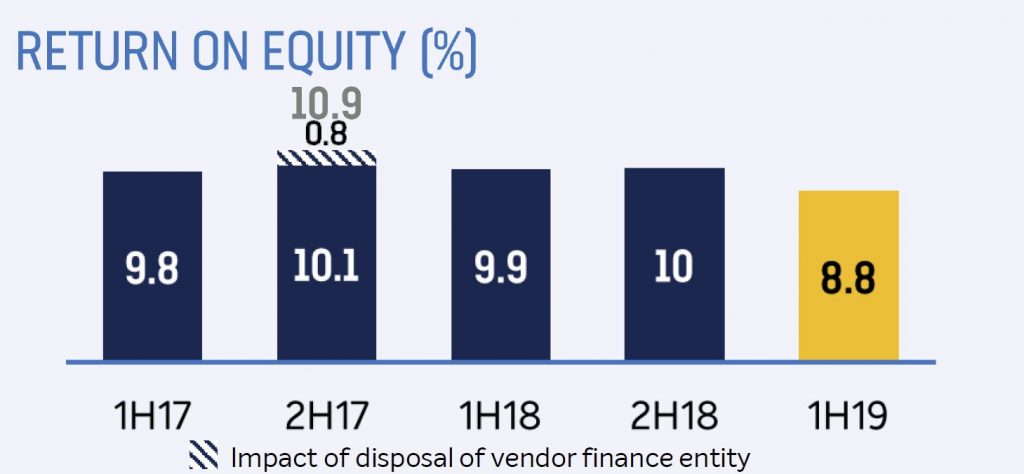
Their return on average ordinary equity was down 110 bps to 8.8%
The fully franked interim dividend was 34 cents per ordinary share, down from 38 cents.
Drawing from his direct experience in the market, mortgage broker and financial adviser Chris Bates and I discuss the latest issues and consider the impact of negative gearing reform.
Chris can be found at www.wealthful.com.au & www.theelephantintheroom.com.au plus via LinkedIn: https://www.linkedin.com/in/christopherbates
ASIC has released KordaMentha Forensic’s final report on CBA’s advice compensation program under its additional licence conditions.
CBA has offered approximately $9.3 million to customers whose advice has been reviewed as a result of the licence conditions imposed by ASIC in August 2014.
ASIC had imposed additional conditions on the Australian financial
services (AFS) licences of CBA’s Commonwealth Financial Planning Ltd and
Financial Wisdom Ltd with the consent of the licensees in August 2014,
and appointed KordaMentha Forensic as the independent expert to monitor
the licensees’ compliance with the additional licence conditions.
ASIC took this action because the licensees did not apply review and
remediation processes consistently to customers of 15 financial
advisers, disadvantaging some customers. The additional licence
conditions required that CBA offer compensation for inappropriate advice
that caused financial loss (where applicable) and offer affected
customers up to $5,000 to get independent advice from an accountant,
financial adviser or lawyer.
KordaMentha Forensic has produced five reports since the licence conditions took effect. In the first report, the Comparison Report, KordaMentha
Forensic identified inconsistencies in treatment of clients and
required the licensees to correct the inconsistencies for approximately
2,740 customers.
In the second report, the Identification Report,
KordaMentha Forensic found that the licensees had taken reasonable
steps in 2012 to identify which clients of the 15 advisers had to be
included in the compensation program.
KordaMentha Forensic also found that the licensees had taken
reasonable steps to identify other potentially high-risk advisers, but
that the licensees had not adequately reviewed advice given by 17 of
those advisers. To address this, KordaMentha Forensic prescribed the
scope of the additional reviews (of the 17 advisers) that the licensees
had to undertake.
KordaMentha then produced three additional reports describing the
licensees’ compliance with the conditions, the additional steps that the
licensees were required to take, and the compensation outcomes. Compliance Report Parts 1 & 2 assessed
the steps taken by the licensees to communicate with and compensate
(where applicable) customers of 15 former advisers for advice provided
between 2003 and 2012.
Compliance Report Part 3 described
the licensees’ review of the 17 potentially high-risk advisers and
KordaMentha Forensic’s conclusion that the licensees should apply the
compensation program to customers of five of those advisers.
In the final report, Compliance Report Part 4,
published today, KordaMentha Forensic covers the last of CBA’s advice
compensation program under the licence conditions. The report states
that CBA has offered a further $2.3 million to 232 clients of the five
advisers. This is in addition to:
$4.95 million (including interest) offered to customers of different
advisers under the licence conditions (reported in KordaMentha
Forensic’s Compliance Report Parts 1 & 2);
$1.9 million (including interest) offered to additional customers as
a result of CBA’s review outside the licence conditions. The need for
these reviews was identified during the licence conditions process.
This means that CBA has offered approximately $9.3 million to
customers whose advice has been reviewed as a result of the licence
conditions imposed by ASIC in August 2014.
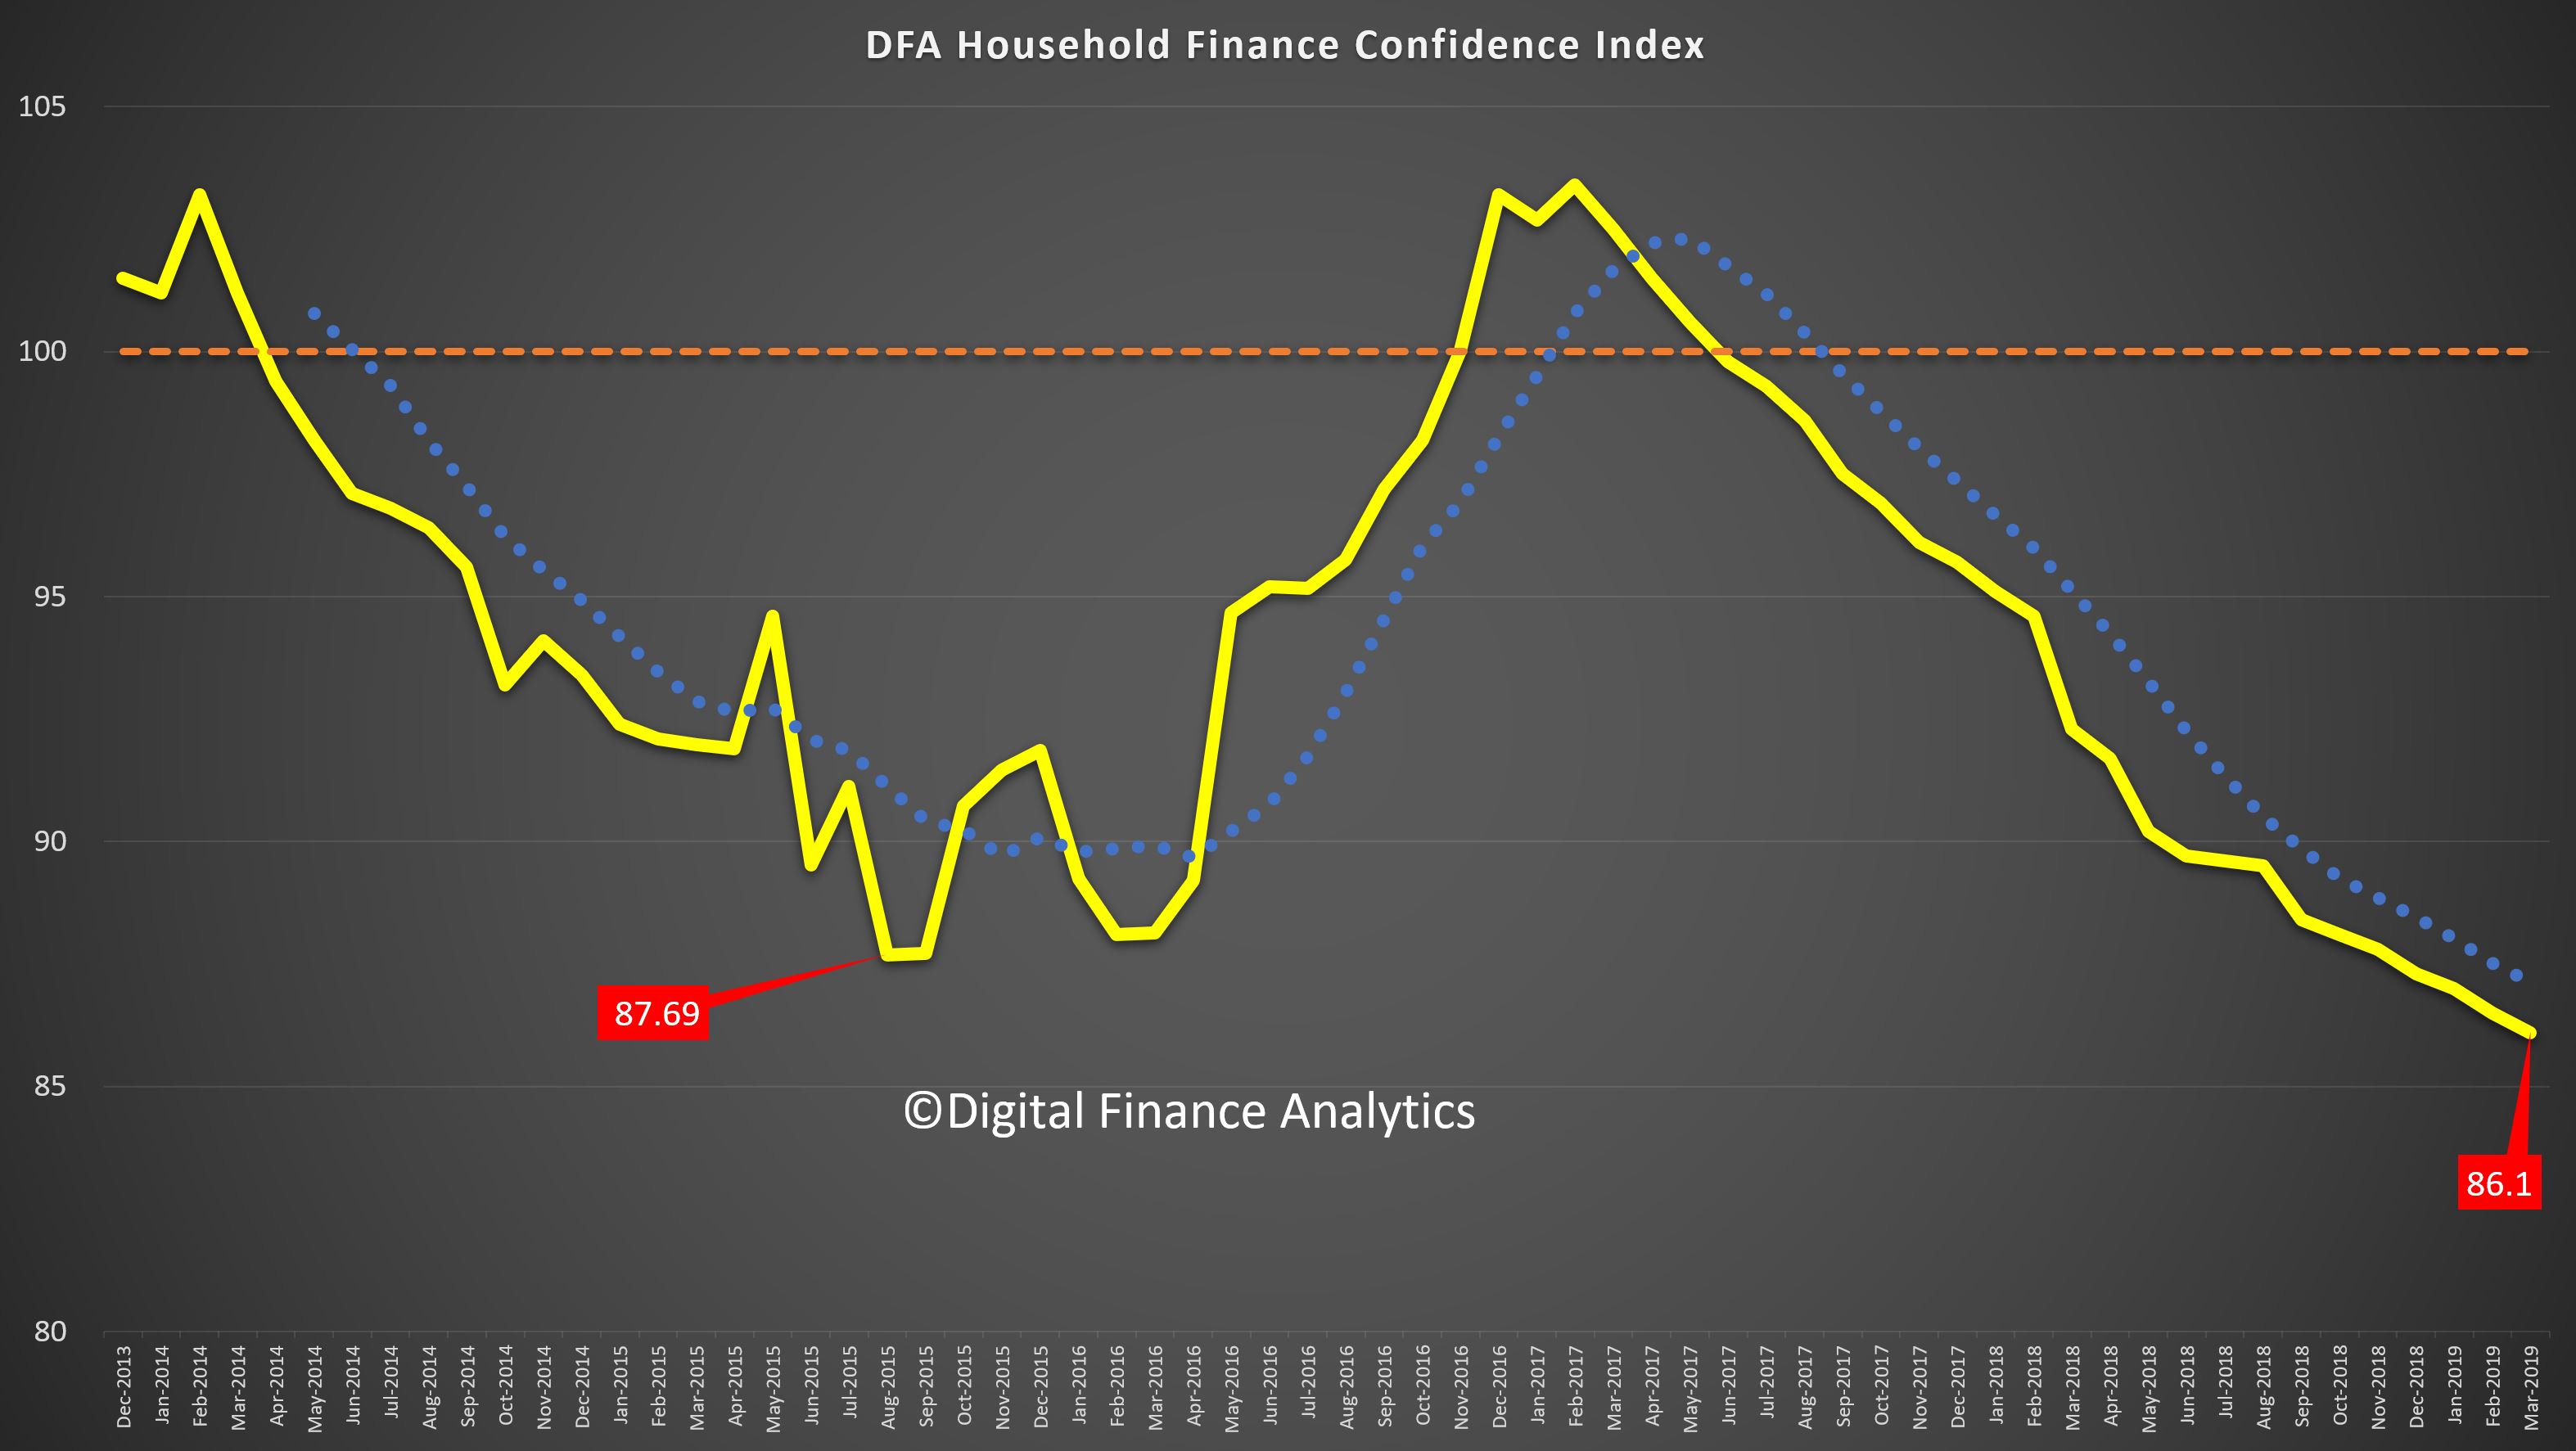
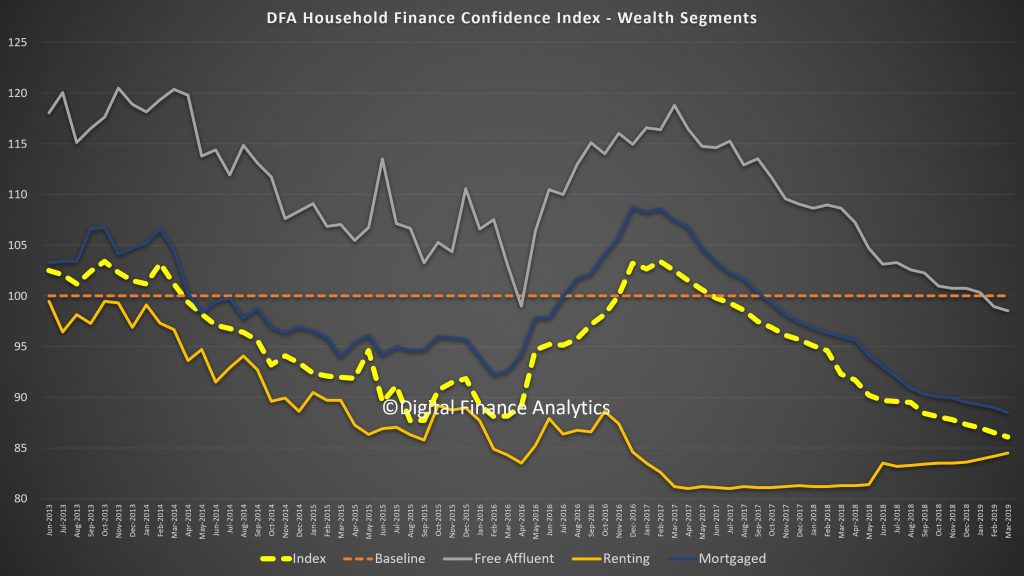
DFA has released the March 2019 Household Financial Confidence Index, which is based on our rolling 52,000 household surveys.
The index reached a new low this past month as the weight of issues on many household’s shoulders pile up. The index fell to 86.1, well below the 100 neutral setting.
This video discusses our findings.
But in essence, all household segments, using our wealth lens, now sit below neutral, with those households with mortgages continuing to track lower, together with those who own property but are mortgage free. In fact the only segment showing a rise is the renting cohort, who see their rents in some centres (especially Sydney) on the decline. We find more among the Free Affluent segment, which is more aligned to the incumbent government, questioning their economic management.
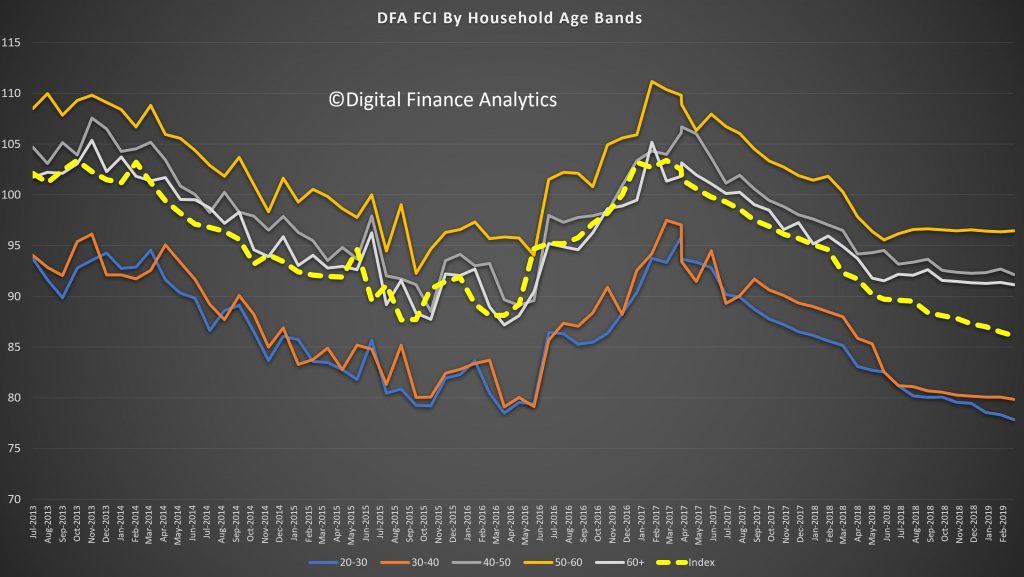
Across the age bands, younger households are more negative, and this highlights some of the inter-generational tensions which we suspect will be played up in the yet to be announced election campaign. In fact, households in the 50-60 year band are most confident (thanks to lower mortgages, bigger savings and controlled costs).
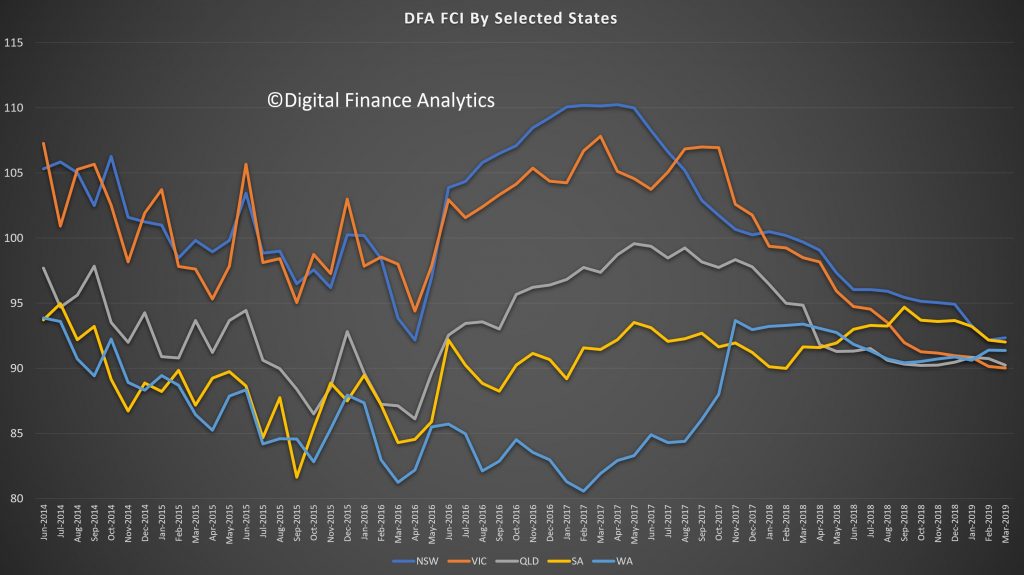
We also see the state indices have consolidated below the neutral setting, as the confidence from households in NSW and VIC are eroded. Much of this is connected with falling home prices.
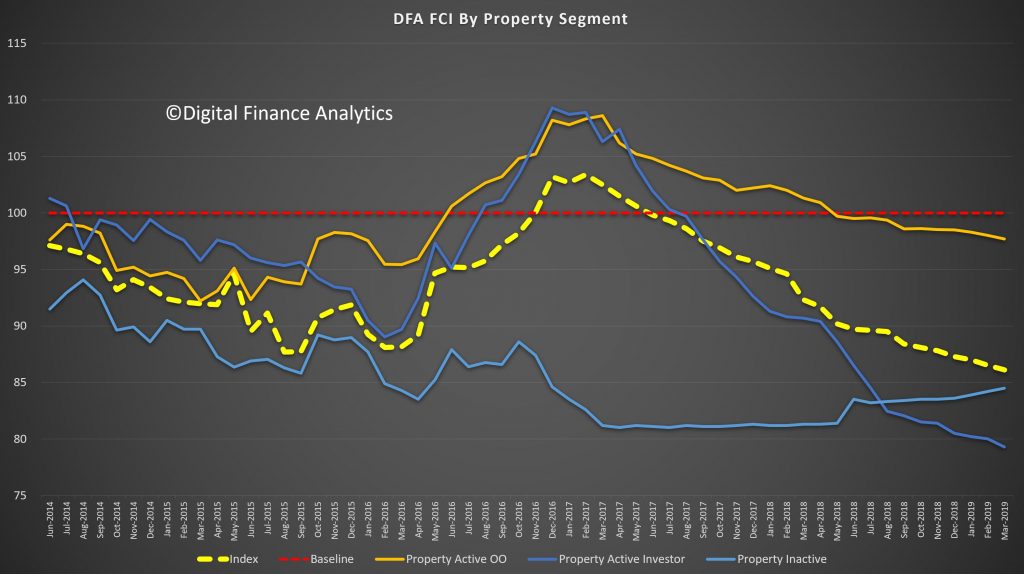
Across our property segmentation, property investors remain the most concerned, with falling home prices, the switch from interest only lending, lower net rental yields and the risks from changes to negative gearing and capital gains all playing in. On the other hand renters are finding some less expensive rentals now, and greater supply. Owner Occupied households are more positive, but still below neutral. This may mark the end of the great property-owning bonanza, at least for now.
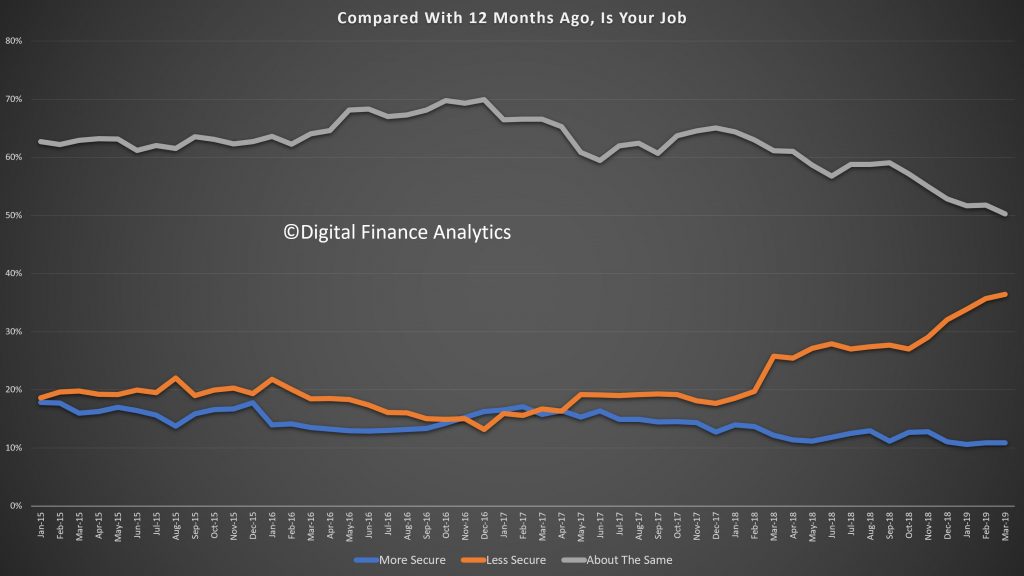
Looking across the moving parts of the index, more households are feeling insecure about their job prospects, thanks to pressure in the construction, retail and real estate sectors.
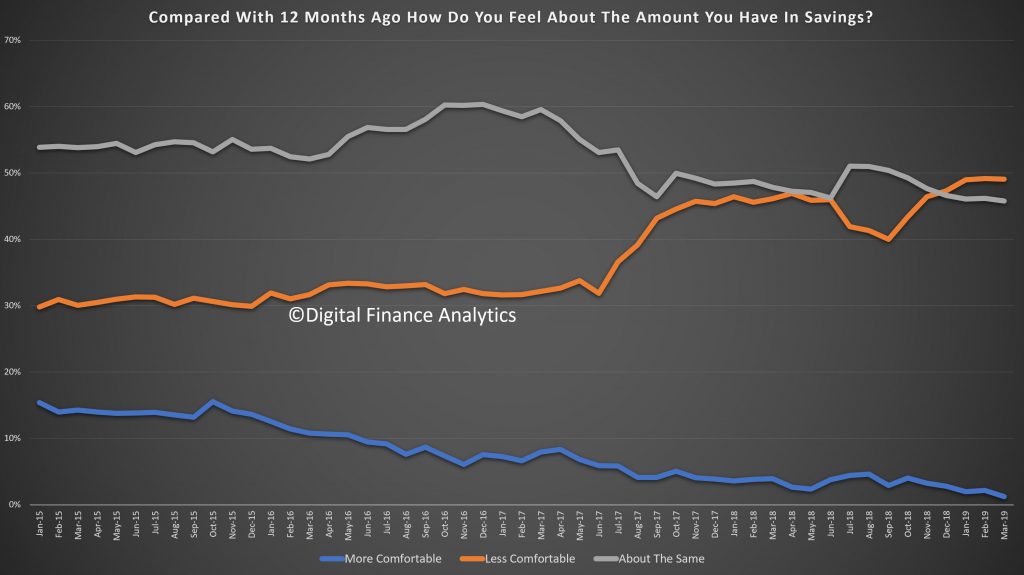
Savings are under pressure from first continued low bank deposit rates, and second, the need to raid savings to keep the household budget in balance. Share values did improve in the month, which offset some of the gloom.
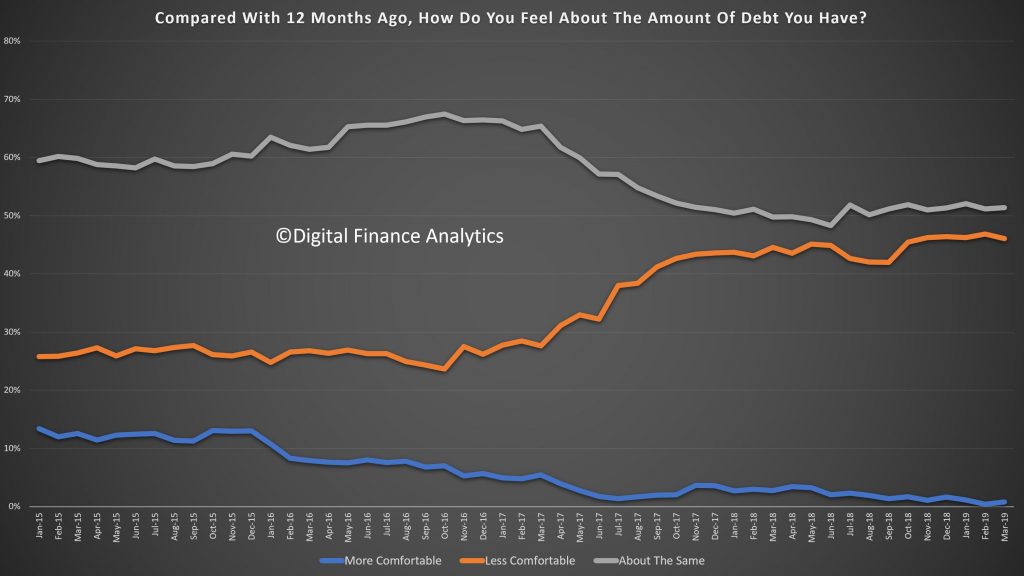
Households are felling the pressure of the high debt (and as the IMF recently showed not just among affluent households). Just under half are now less comfortable with their debt than a year ago, a trend which started to rise in early 2017.
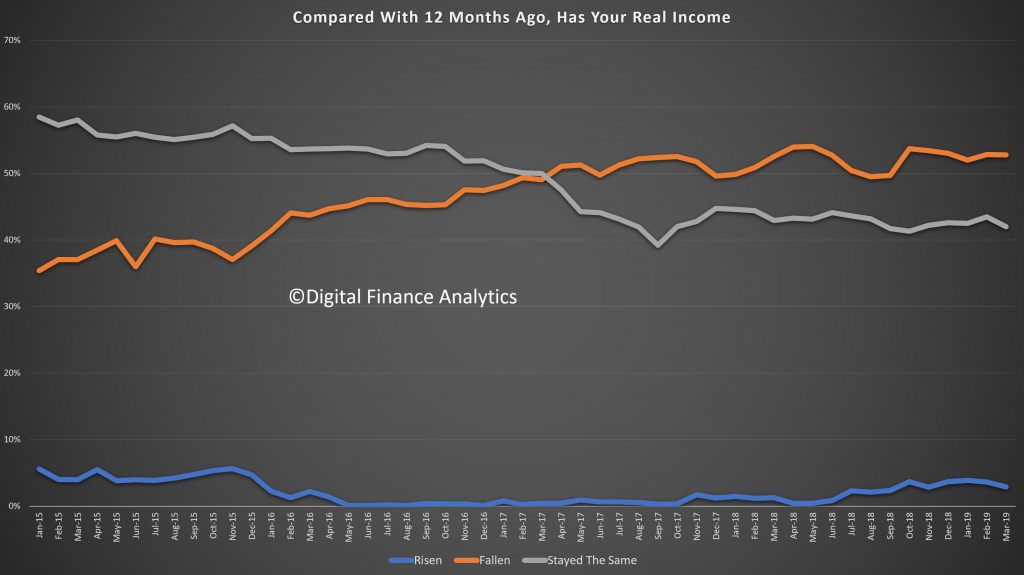
Incomes, in real terms, remain under pressure, with those in the public sector experiencing small rises, but many in the private still in negative territory. More than half say, in real terms, incomes have fallen over the past year.
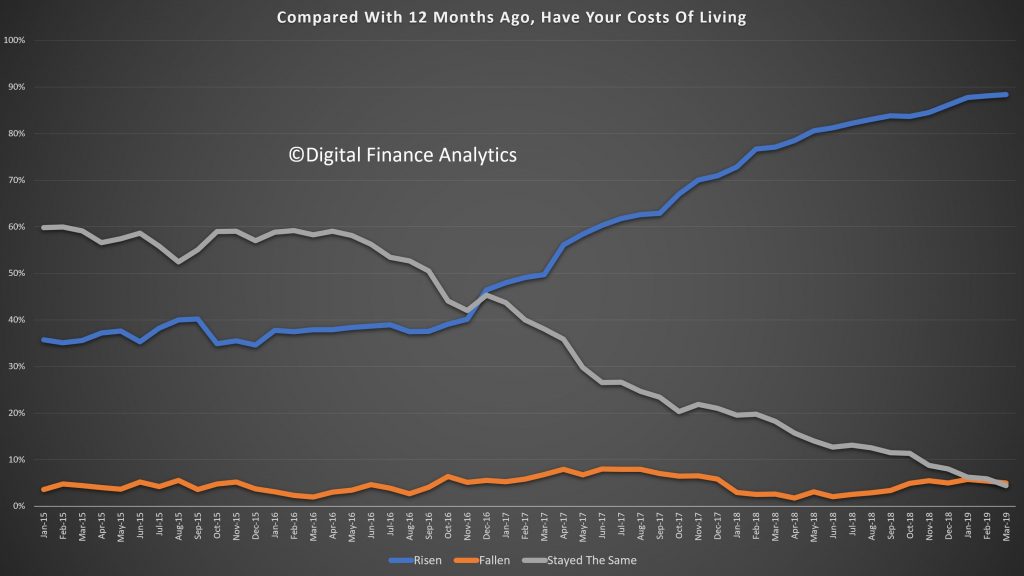
Costs continue to rise, with power prices, healthcare, health insurance, and child care all registering. Plus we are seeing more fallout from the drought which is also impacting some food costs. Nearly 90% of households said their costs are higher than a year ago.
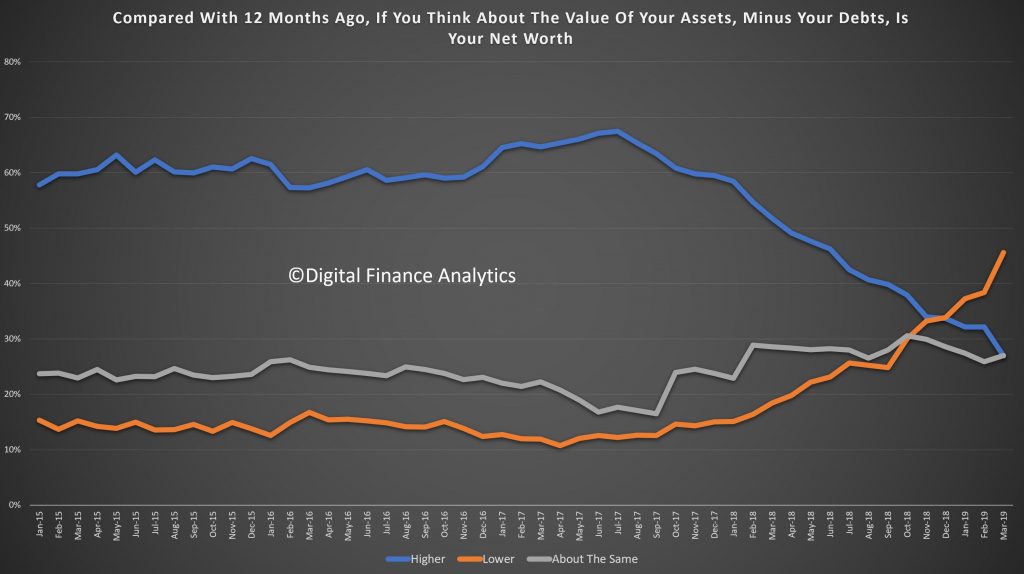
Finally, we put this all together in our assessment of net worth (assets minus loans etc). 45% of households say their net worth is lower, reflecting falls in the property sector, some lower share prices, and diminishing savings. Not a good look in the run up to an election!
There is little evidence of anything which will change the momentum. Rate cuts and handouts to households may provide some short-term relief, but the economic settings are not correct to reverse the trend. So expect more bad news ahead.
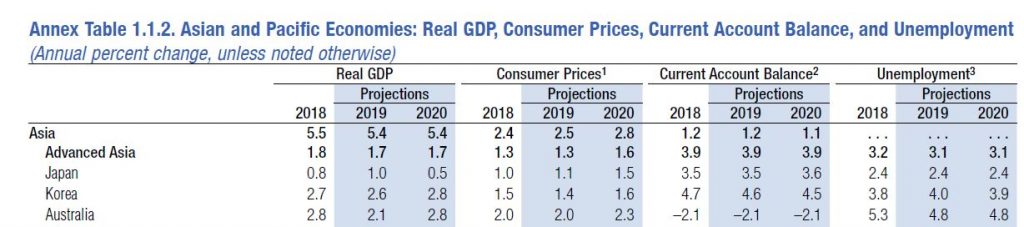
The latest World Economic Outlook warns of slower growth though sees a possible acceleration later in the year (thanks to the Fed’s recent change in tune!).
Australian growth is forecast to fall to 2.1% in 2019, with CPI at 2% and unemployment at 4.8%. In 2020, GDP is forecast at 2.8%, CPI 2.3% and unemployment at 4.8%.
One year ago economic activity was accelerating in almost all regions of the world and the global economy was projected to grow at 3.9 percent in 2018 and 2019.
One year later, much has changed: the escalation of US–China trade tensions, macroeconomic stress in Argentina and Turkey, disruptions to the auto sector in Germany, tighter credit policies in China, and financial tightening alongside the normalization of monetary policy in the larger advanced economies have all contributed to a significantly weakened global expansion, especially in the second half of 2018. With this weakness expected to persist into the first half of 2019, the World Economic Outlook (WEO) projects a decline in growth in 2019 for 70 percent of the global economy. Global growth, which peaked at close to 4 percent in 2017, softened to 3.6 percent in 2018, and is projected to decline further to 3.3 percent in 2019. Although a 3.3 percent global expansion is still reasonable, the outlook for many countries is very challenging, with considerable uncertainties in the short term, especially as advanced economy growth rates converge toward their modest long-term potential.
While 2019 started out on a weak footing, a pickup is expected in the second half of the year. This pickup is supported by significant policy accommodation by major economies, made possible by the absence of inflationary pressures despite closing output gaps. The US Federal Reserve, in response to rising global risks, paused interest rate increases and signaled no increases for the rest of the year. The European Central Bank, the Bank of Japan, and the Bank of England have all shifted to a more accommodative stance. China has ramped up its fiscal and monetary stimulus to counter the negative effect of trade tariffs. Furthermore, the
outlook for US–China trade tensions has improved as the prospects of a trade agreement take shape. These policy responses have helped reverse the tightening of financial conditions to varying degrees across countries.
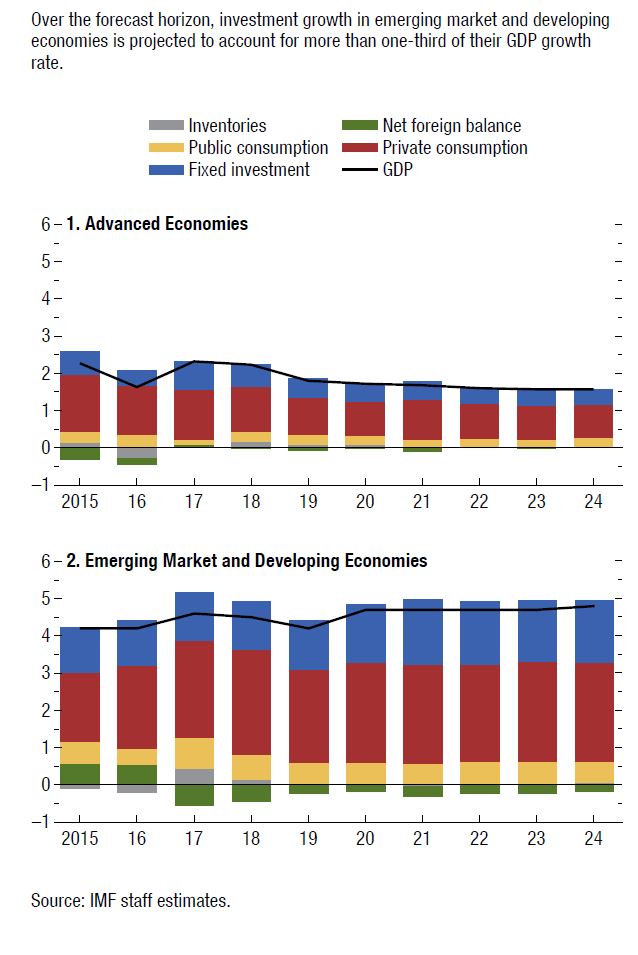
Emerging markets have experienced a resumption in portfolio flows, a decline in sovereign borrowing costs, and a strengthening of their currencies relative to the dollar. While the improvement in financial markets has been rapid, those in the real economy have yet to materialize. Measures of industrial production and investment remain weak for most advanced and emerging economies, and global trade has yet to recover. With improvements expected in the second half of 2019, global economic growth in 2020 is projected to return to 3.6 percent. This return is predicated on a rebound in Argentina and Turkey and some improvement in a set of other stressed emerging market and developing economies, and therefore subject to considerable uncertainty. Beyond 2020 growth will stabilize at around 3½ percent, bolstered mainly by growth in China and India and their increasing weights in world income. Growth in advanced economies will continue to slow gradually as the impact of US fiscal stimulus fades and growth tends toward the modest potential for the group, given ageing trends and low productivity growth. Growth in emerging market and developing economies will stabilize at around 5 percent, though with considerable variance between countries as subdued commodity prices and civil strife weaken prospects for some.
While the overall outlook remains benign, there are many downside risks. There is an uneasy truce on trade policy, as tensions could flare up again and play out in other areas (such as the auto industry) with large disruptions to global supply chains. Growth in China may surprise on the downside, and the risks surrounding Brexit remain heightened. In the face of significant financial vulnerabilities associated with large private and public sector debt in several countries, including sovereign-bank doom loop risks (for example, in Italy), there could be a rapid change in financial conditions owing to, for example, a risk-off episode or a no-deal Brexit.
With weak expansion projected for important parts of the world, a realization of these downside risks could dramatically worsen the outlook. This would take place at a time when conventional monetary and fiscal space is limited as a policy response. It is therefore imperative that costly policy mistakes are avoided. Policymakers need to work cooperatively to help ensure that policy uncertainty doesn’t weaken investment. Fiscal policy will need to manage trade-offs between supporting demand and ensuring that public debt remains on a sustainable path, and the optimal mix will depend on country-specific circumstances. Financial sector policies must address vulnerabilities proactively by deploying macroprudential tools. Low-income commodity exporters should diversify away from commodities given the subdued outlook for commodity prices. Monetary policy should remain data dependent, be well communicated, and ensure that inflation expectations remain anchored.
Across all economies, the imperative is to take actions that boost potential output, improve inclusiveness, and strengthen resilience. A social dialogue across all stakeholders to address inequality and political discontent will benefit economies. There is a need for greater multilateral cooperation to resolve trade conflicts, to address climate change and risks from cybersecurity, and to improve the effectiveness of international taxation.
[…] we have concluded that [the] nature and extent [of problems] are
significant and concerning. The problems have led to diminishing public
confidence that the building and construction industry can deliver
compliant, safe buildings which will perform to the expected standards
over the long term.
The cost of replacing combustible panels at the Lacrosse Apartments in Melbourne, which caught fire in 2014, will be at least A$5.7 million, plus A$6 million or so in consequential damages.
The total cost of replacing combustible panels across Australia is
unknown at this point, but is likely to run to billions of dollars.
The Shergold-Weir report
identifies a catalogue of other problems, including water leaks,
structurally unsound roof construction and poorly constructed
fire-resisting elements. Faults appear to be widespread.
A 2012 study by UNSW City Futures
surveyed 1,020 strata owners across New South Wales and found 72% of
respondents (85% in buildings built since 2000) knew of at least one
significant defect in their complex. Fixing these problems will cost
billions more.
Regulatory failures are not only “diminishing public confidence”,
they have a direct impact on the hip pockets of many Australians who own
a residential apartment. In short, building defects resulting from lax
regulation are a multi-billion dollar disaster.
How could authorities let this happen?
A web of regulations and standards enacted by governments cover
construction in Australia, but this regulation is centred on the National Construction Code (NCC). The Australian Building Codes Board
(ABCB), a body controlled by the Building Ministers’ Forum, manages the
NCC. The ABCB board comprises appointed representatives from the
Commonwealth plus all the states and territories and a few industry
groups.
It is such a complicated system that it is hard to identify any
government, organisation or person that is directly responsible for its
performance.
The NCC is supposed to create “benefits to society that outweigh
costs” but it appears the ABCB may have been more focused on the need to
“consider the competitive effects of regulation” and “not be
unnecessarily restrictive”. (Introduction to the NCC Volume 1; ABCB)
Ministers agreed in principle to a national ban on the unsafe use of
combustible ACPs (aluminium composite panels) in new construction,
subject to a cost/benefit analysis being undertaken on the proposed ban,
including impacts on the supply chain, potential impacts on the
building industry, any unintended consequences, and a proposed timeline
for implementation. Ministers will further consider this at their next
meeting [in May this year].
This suggests the ministers are more concerned about possible impacts
on the panel suppliers and the building industry than the consumer. The
earliest a ban can take effect is in May. In the meantime, anecdotal
evidence suggests buildings are still being clad in combustible ACP.
Thanks to the journalist Michael Bleby, we know governments and the ABCB failed to act in 2010
when presented with evidence that combustible ACP was not only a
danger, but was also being widely used on tall residential buildings.
Bleby quoted ABCB general manager Neil Savery as saying neither his
organisation, nor any of the states, was aware that builders were using
the product incorrectly.
We also know that panel manufacturers, including the Australian
supplier of Alucobond, actively lobbied building ministers. At the July
2011 BMF meeting, the ACT representative effectively vetoed an ABCB
proposal to issue an advisory note on the use of combustible ACP.
We are entitled to ask why the ABCB and its staff, or the downstream
regulators and their staff, did not know about serious fire problems
with ACP that the technical press identified as long ago as 2000.
The answer will be of particular interest to residents of tall apartment
buildings clad in these panels, all of whom are now living with an
active threat to their safety.
Consumers are owed better protection
While both Labor and Coalition governments have worked to improve
consumer protection for people buying consumer goods, their record on
housing, particularly apartments, is awful. While a consumer can be
reasonably sure of getting restitution if they buy a faulty fridge, no such certainty exists if they buy a faulty house or apartment.
At the moment, the NCC does not have any focus on providing
protection for buyers of houses or apartments. There are few
requirements for the durability of components and astonishingly weak
requirements for waterproofing. Under the NCC and its attached
Australian Standards, particularly AS 4654.1 and 2-2012, a waterproof
membrane could last, in practice, five minutes or 50 years.
Given the magnitude of the economic loss, it would be appropriate for
the BMF and ABCB board to publicly admit they have failed. Since their
appointments in November 2017 and January 2013 respectively, neither
ABCB chair John Fahey nor Savery as general manager has remedied the
situation. The Shergold-Weir report has not been implemented and the
combustible cladding issues remain unresolved. It would be reasonable
for Fahey to step down and for Savery to consider his future.
The next federal government should consider what further action
should be taken, particularly in relation to individuals on the BMF and
within the ABCB involved in the 2010-2011 decision not to issue the
proposed advisory note on the use of ACP. Since the ABCB does not
publish minutes and none of its deliberations are in the public domain
no one knows what actually happened or who did what.
The new board should consider moving residential apartment buildings
(Class 2 buildings in the NCC classification) from Volume 2 of the NCC
to Volume 1, which controls detached and semi-detached housing. Volume 1
should then have as its overriding objective the protection of
consumers.
The downstream regulators should focus on requiring builders to
deliver residential buildings with no serious faults and providing
simple mechanisms for redress if they don’t.
Surely this is not too much to ask.
Author: Geoff Hanmer, Adjunct Lecturer in Architecture, UNSW
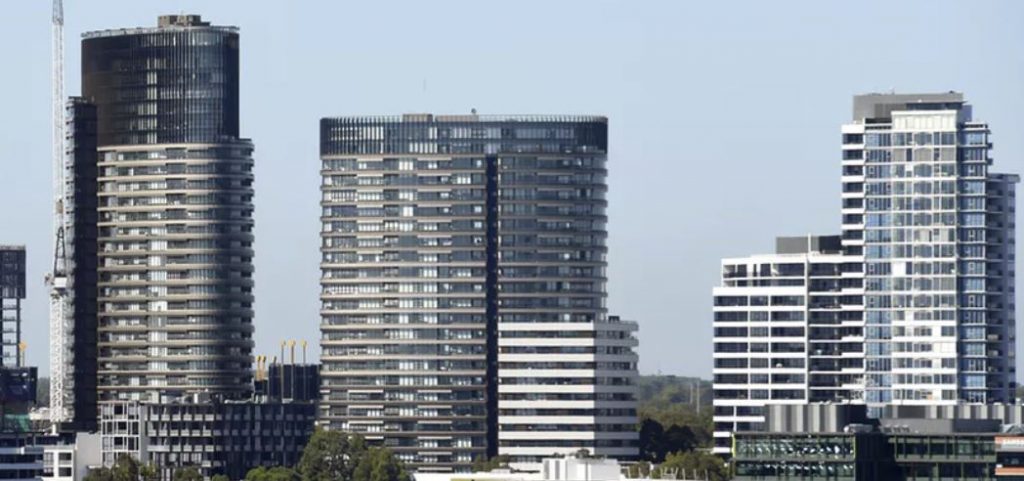
Across the eight capital cities, house values are set to decline 7.7% in 2019, a sharper correction than apartments which are forecast to see a 4.3% hit, says Moody’s. Via Property Observer.
House prices have declined over 9% since their peak in late 2017,
while apartment values are down around 6% from the peak, according to
CoreLogic.
House values in Sydney declined 5.5% in 2018 and are forecast to fall
a further 9.3% in 2019. Apartment values are set to decline 5.9% in
2019.
Melbourne’s house price decline has been more accelerated than
Sydney’s, and its sharp downturn is reflected in the forecast for its
house values in 2019.
Moody’s suggest values will decline 11.4% across Great Melbourne, with apartments to fall 5%.
The worst is over for Brisbane, according to Moody’s, with house values to see a correction in 2019.
There will be strength in East Brisbane, offset by declines elsewhere.
There’s also good news for the Brisbane apartment market, Moody’s forecast. Values are tipped to recover 0.9% in 2019.
It’s not such good news for Perth, where house values are like to decline 7.6% in 2019.
Adelaide’s housing market will continue its stable run, with house values forecast to rise 1% in 2019 after a 1.9% gain in 2018.
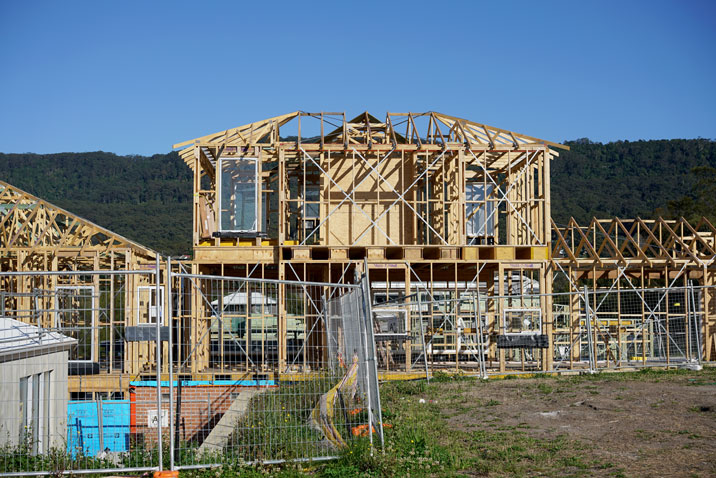
After a three-year cycle of industry comment, review and revision, May 1 marks the adoption of a new National Construction Code (NCC). Overseen by the Australian Building Codes Board
(ABCB), the code is the nation’s defining operational document of
building regulatory provisions, standards and performance levels. Its mission statement
is to provide the minimum necessary requirements for safety and health,
amenity, accessibility and sustainability in the design, construction,
performance and liveability of new buildings.
Widespread use of non-compliant building materials, and specifically
combustible cladding, has been foremost in the minds of regulators.
Three years ago, after the Lacrosse fire in Melbourne Docklands, the ABCB amended the existing code. This crucial revision has been carried forward into the new code.
Investigations into the highly publicised, structurally unsound Opal
tower in Sydney found the design – namely the connections between the
beams and the columns on level 10 and level 4, the two floors with
significant damage — indicated “factors of safety lower than required by standards”.
Just two months ago when the new code was released in preview form,
we learnt that a significant number of approved CodeMarks used to
certify compliance for a range of building materials are under recall.
The Australian Institute of Building Surveyors posted urgent advice:
“We are in the process of making enquiries with the ABCB and Building
Ministers to find out when they were made aware that these certificates
were withdrawn and what the implications for members will be […] and
owners of properties that have been constructed using these products.”
Fire safety concerns are driving changes in the code. The new NCC has
extended the provision of fire sprinklers to lower-rise residential
buildings, generally 4-8 storeys. However, non-sprinkler protection is
still permitted where other fire safety measures meet the deemed minimum
acceptable standard.
Comfort and health
The code includes new heating and cooling load limits. However,
requirements for overall residential energy efficiency have not been
increased. The 6-star minimum introduced in the 2010 NCC remains.
The code has just begun to respond to the problem of dwellings that are being constructed to comply but which perform very poorly in the peaks of summer and winter and against international minimum standards.
The change in the code deals with only the very worst houses – no more
than 5% of designs with the highest heating loads and 5% with the
highest cooling loads.
It’s a concern that the climate files used to assess housing thermal
performance use 40-year-old BOM data. Off the back of record hot and dry
summers, readers in such places as Adelaide and Perth might be
surprised to learn the ABCB designates their climate as “the mildest region”.
A building that is not six stars can be built under the new code. In fact, it may have no stars!
Lamentably, there has been no national evidenced-based evaluation
(let alone international comparison) of the measured effectiveness of
the 6-star standard. CSIRO did carry out a limited evaluation of the older 5-star standard (dating back to 2005). An evaluation for commercial buildings is available from the ABCB website.
Accessibility and liveability
Volume 2 of the NCC covers housing and here it is business as usual, although the ABCB has released an options paper on proposals that might be part of future codes. Accessible housing is treated as a discrete project. Advocates for code changes in this area, such as the Australian Network for Universal Housing Design (ANUHD), have written to the ABCB expressing disappointment.
A Regulation Impact Assessment on the costs and benefits of applying a
minimum accessibility standard to all new housing has yet to see the
light of day.
These proposals or “options” talk of silver and gold levels of design
(there is no third-prize bronze option for liveable housing). Codes of
good practice in accessible design have for decades recommended such
measures.
It’s all about performance
Some argue that deep-seated problems have developed from a code that
favours innovation and cost reduction over consumer protection. There is
a cloud over the industry and over some provisions – or should we say
safeguards and compliance?
Safety should not be a matter of good luck or depend on an accidental
selection of a particular building material or system. New buildings
born of this new code are hardly likely to differ measurably from their
troublesome older siblings. The anxiety for insurers, regulators and
building owners continues.
The National Construction Code adopts a performance-based approach to
building regulation, but don’t expect the sales consultant to know the U-value
of the windows, whether the doors are hung to allow for disabled
access, or if the cleat on your tie beam is to Australian standards.
Anyone can propose changes to the NCC. The form is on the website. Consultants will be hired to model costs and benefits.
Regulatory reforms introduced through the ABCB over the past 20 years have produced an estimated annual national economic benefit of A$1.1 billion.
That’s a lot of money! The owners of failing residential buildings
could do with some of that cash to cover losses and legal fees.
Author: Dr Timothy O’Leary, Lecturer in Construction and Property, University of Melbourne