Auction Clearance Rates Slide As Listings Rise

According to Corelogic, last week, the combined capital cities returned a final auction clearance rate of 62 per cent across 790 auctions, with both clearance rate and volumes recording lower than last year when 68.8 per cent of the 881 auctions cleared.

The two strongest auction markets in terms of clearance rate last week were Melbourne and Adelaide, with both cities recording a 70.2 per cent rate of clearance. Followed by Canberra (62.2 per cent) and Sydney (57.1 per cent), while Brisbane, Perth and Tasmania all recorded clearance rates at or below 50 per cent.

It is expected that auction volumes will returned to normal levels in the coming weeks and a true reading of auction market conditions can be established.

Outside of the capital city markets, Geelong returned a final clearance rate of 88.9 per cent across 20 auctions. While the Gold Coast recorded the highest volume of auctions with 96 held, however only 46.9 per cent were successful.

NAB waives customer confidentiality clauses for Royal Commission

NAB has waived customer confidentiality clauses which otherwise may have silenced customers wishing to give evidence to the Financial Services Royal Commission. Well done NAB!

 Sharon Cook, NAB’s Chief Legal and Commercial Counsel says:

If any of our customers want to make a submission to the Royal Commission we encourage them to do so and we will waive any confidentiality obligations they have agreed to when resolving an issue with NAB.

We are doing this because it is important to us that we support customers being heard by the Royal Commission.

We have also communicated to our people we fully support them making a submission to the Royal Commission if they would like to.

The other majors have taken a similar stance, though some are a little coy about whether staff may also speak out!

Mandatory Comprehensive Credit Reporting Draft Bill Released

The Treasury has released draft legislation to require the big four banks to participate fully in the credit reporting system by 1 July 2018.   They say this measure will give lenders access to a deeper, richer set of data enabling them to better assess a borrower’s true credit position and their ability to pay a loan.

We note that there is no explicit consumer protection in this bill, relating to potential inaccuracies of data going into a credit record. This is, in our view a significant gap, especially as the proposed bulk uploading will require large volumes of data to be transferred.

It does however smaller lenders to access information which up to now they could not, so creating a more level playing field.  Consumers may benefit, but they should also beware of the implications of the proposals.

The Government is seeking views on the exposure draft legislation and accompanying explanatory materials, which implements this measure. Closing date for submissions: 23 February 2018

The Bill amends the Credit Act to mandate a comprehensive credit reporting regime such that from 1 July 2018 large ADIs and their subsidiaries must provide comprehensive credit information on open and active consumer credit accounts to certain credit reporting bodies. It also expands ASIC’s powers so it can monitor compliance with the mandatory regime. The Bill also imposes requirements on the location where a credit reporting body must store data.

Since March 2014, the Privacy Act has allowed credit providers and credit reporting bodies to use and disclose ‘positive credit information’ or ‘comprehensive credit information’ about a consumer.

This includes information about the number of credit accounts a person holds, the maximum amount of credit available to a person and repayment history information.

Prior to March 2014, the information that could be shared was limited to ‘negative information’. This includes details of a person’s overdue payments, defaults, bankruptcy or court judgments against that person.

However, the Privacy Act does not mandate the disclosure of comprehensive credit information by credit providers to credit reporting bodies.

The 2014 Murray Inquiry and the Productivity Commission Inquiry into Data Availability and Use recommended that the Government mandate comprehensive credit reporting in the absence of voluntary participation. Comprehensive credit reporting is expected to enable credit providers to better establish a consumer’s credit worthiness and lead to a more competitive and efficient credit market.

In the 2017-18 Budget, the Government committed to mandating a comprehensive credit reporting regime if credit providers did not meet a threshold of 40 per cent of data reporting by the end of 2017.

On 2 November 2017 the Treasurer announced that he would introduce legislation for a mandatory regime as it was clear the 40 per cent target would not be met.

The Bill amends the Credit Act to establish a mandatory comprehensive credit reporting regime which will apply from 1 July 2018. The amendments do not require or allow disclosure, use or collection of credit information beyond what is already permitted under the Privacy Act and Privacy Code.

Currently, Australia’s credit reporting system is characterised by an information asymmetry. A consumer has more information about his or her credit risk than the credit provider. This can result in mis-pricing and mis-allocation of credit.

The Bill seeks to correct this information asymmetry. It lets credit providers obtain a comprehensive view of a consumer’s financial situation, enabling a provider to better meet its responsible lending obligations and price credit according to a consumer’s credit history.

The Government expects that the mandatory regime will also benefit consumers. Consumers will have better access to consumer credit, with reliable individuals able to seek more competitive rates when purchasing credit. Consumers that are looking to enter the housing market will be better able to demonstrate their credit worthiness. Consumers that possess a poor credit rating will also be able demonstrate their credit worthiness through future consistency and reliability.

The mandatory regime applies to ‘eligible licensees’ which initially will be large ADIs and their subsidiaries that hold an Australian credit licence. An ADI is considered large where its total resident assets are greater than $100 billion. Other credit providers will be subject to the regime if they are prescribed in regulations.

Eligible licensees are required to supply credit information on 50 per cent of their active and open credit accounts by 28 September 2018. The information on the remaining open and active credit accounts, including those that open after 1 July 2018, will need to be supplied by 28 September 2019.

The bulk supply of information must be given to all credit reporting bodies the eligible licensee had a contract with on 2 November 2017. In this way the credit provider has an established relationship with the credit reporting body and will have an agreement in place on the handling of data to ensure it remains confidential and secure.

Following the bulk supply of information, large ADIs and their affected subsidiaries must, on a monthly basis, keep the information supplied accurate and up-to-date, including by supplying information on accounts that have subsequently opened. This information must be supplied to credit reporting bodies the credit provider continues to have a contract with.

Credit providers that are not subject to the mandatory regime will be able to access credit information supplied under the regime by voluntarily supplying comprehensive credit information to a credit reporting body or becoming a signatory to the PRDE.

The security and privacy of a consumer’s credit information will be preserved and protected. The Bill relies on the existing protections established by the Privacy Act and Privacy Code and the oversight of the Australian Information Commissioner. The Bill also places a new obligation on credit reporting bodies on where data is stored. In addition, the Bill places an obligation on credit providers to be satisfied with the security arrangements of the CRBs prior to supplying information.

ASIC will be responsible for monitoring compliance with the mandatory regime. It has new powers to collect information and require audits to confirm the supply requirements are being met. ASIC will also have the ability to expand the content to be supplied under the mandatory regime and prescribe the technical standards for the format of the information.

The Treasurer will also receive statements from large ADIs, their affected subsidiaries and credit reporting bodies to demonstrate that the initial bulk supply requirements, as well as the ongoing supply requirements, have been met.

The mandatory comprehensive credit regime, implemented by this Bill, recognises that industry stakeholders have already taken a number of steps to support sharing comprehensive credit information. This includes the PRDE and supporting ARCA Technical Standards.

The mandatory regime includes the ‘principles of reciprocity’ and the ‘consistency principle’ that have been developed by industry. To the extent possible, the mandatory comprehensive credit reporting regime operates within the established industry framework but also provides scope for future technological developments.

An independent review of the mandatory regime must be completed by 1 January 2022. The review will table its report in Parliament.


RBNZ Holds Official Cash Rate

The New Zealand Reserve Bank has left the Official Cash Rate (OCR) unchanged at 1.75 percent and released their February 2018 Monetary Policy Statement.

Global economic growth continues to improve.  While global inflation remains subdued, there are some signs of emerging pressures.  Commodity prices have increased, although agricultural prices are relatively soft.  International bond yields have increased since November but remain relatively low.  Equity markets have been strong, although volatility has increased recently.  Monetary policy remains easy in the advanced economies but is gradually becoming less stimulatory.

The exchange rate has firmed since the November Statement, due in large part to a weak US dollar. We assume the trade weighted exchange rate will ease over the projection period.

GDP growth eased over the second half of 2017 but is expected to strengthen, driven by accommodative monetary policy, a high terms of trade, government spending and population growth.

Labour market conditions continue to tighten. Compared to the November Statement, the growth profile is weaker in the near term but stronger in the medium term.

The Bank has revised its November estimates of the impact of government policies on economic activity based on Treasury’s HYEFU.  The net impact of these policies has been revised down in the near term. The Kiwibuild programme contributes to residential investment growth from 2019.

House price inflation has increased somewhat over the past few months but housing credit growth continues to moderate.

The Bank says ” Bank funding costs eased slightly in the second half of 2017. Consistent with the decline in funding costs and a fall in the two-year swap rate, the average two-year mortgage rate has declined by around 15 basis points since June 2017. In contrast, most other mortgage rates have remained relatively stable. Mortgage rates are higher than a year ago across all terms, but remain low relative to history”.

Annual CPI inflation in December was lower than expected at 1.6 percent, due to weakness in manufactured goods prices.

While oil and food prices have recently increased, traded goods inflation is projected to remain subdued through the forecast period. Non-tradable inflation is moderate but expected to increase in line with increasing capacity pressures.  Overall, CPI inflation is forecast to trend upwards towards the midpoint of the target range. Longer-term inflation expectations are well anchored at 2 percent.

Monetary policy will remain accommodative for a considerable period.  Numerous uncertainties remain and policy may need to adjust accordingly.

NAB Q1 2018 Trading Update Shows Margin Pressure

NAB has released their latest trading update, and it makes an interesting comparison with CBA yesterday. CBA reported a significant upswing in net interest margin (NIM) thanks to mortgage book repricing, whereas NAB says overall NIM was down, and excluding Institutional Banking, was flat.

As well as the inpact of the bank levy, NAB has grown their mortgage book faster than CBA, so it seems to highlight NAB trading volume for margin. CBA, on the other hand, in their briefing, acknowledged they may have slowed their mortgage acquisition too much, and will be now ramping up a bit.

Cash earnings declined by 1%, but were 3% up on the prior corresponding period at of $1.65b.  Revenue was up 1% with good growth in Business and Private Banking and Corporate and Institutional (but at lower margin?). Expenses rose 4% due to the increased business investment, and expect 5-8% growth in expenses in FY18, then flatter in F19-20.

Bad and doubtful debts fell 23% to $160m, after lower specific charges, offset by collective provision increases for planned mortgage model changes. Last time they had a change to their collective provision overlays which lifted B&DD.

Asset quality improved, with 90+ days past due and gross impaired assets to gross loans down 3 basis points to 0.67%, thanks mainly to improvements in the New Zealand dairy sector.  Their mortgage book of $327 billion had a 90 day past due of 0.55%, and weight risk ratio of ~31%.

Group CET1 ratio was 10.2%, thanks to lower risk weighted assets and the 1.5% Dividend Reinvestment Plan discount for FY17. They expect to meet APRA’s unquestionable strong target of 10.5% by January 2020. The leverage ratio was 5.4% (APRA basis) compared with 5.5% in Sep 2017. The Liquidity Coverage Ratio was 126% and the Net Stable Funding Ratio was 110%.

Nab said they were on track to make the estimated $1.5 billion increase in business investment, and cost savings of more than $1 billion are still being targeted by end FY20.


AMP Reports Strong Profit Growth

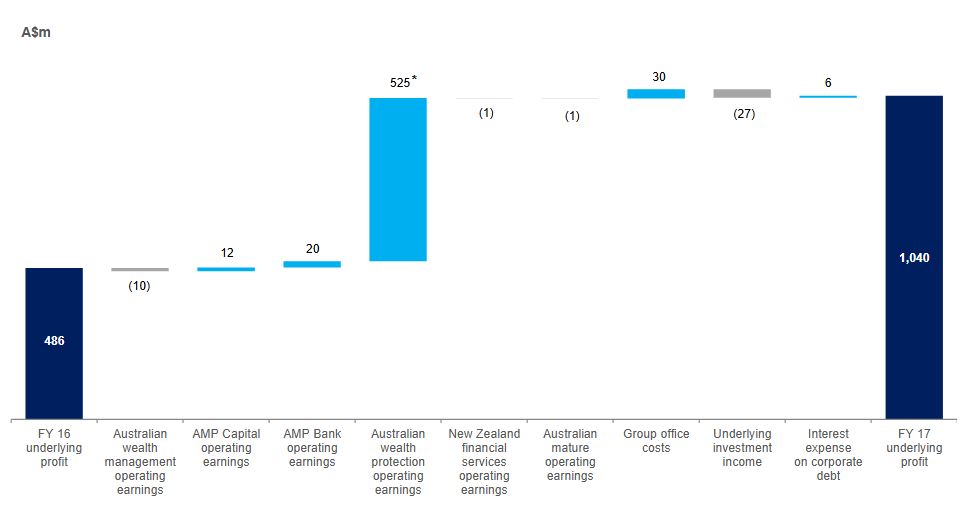
AMP released their FY17 results, and overall the business has improved results compared with last year.  Underlying profit was $1,040 million compared with $486 million last year.  Margin in the AMP Bank rose 3 basis points to 1.70%. Note that in FY 16 Australian wealth protection reported $415 million loss, following strengthening of best estimate assumptions. So the like for like comparison is difficult.

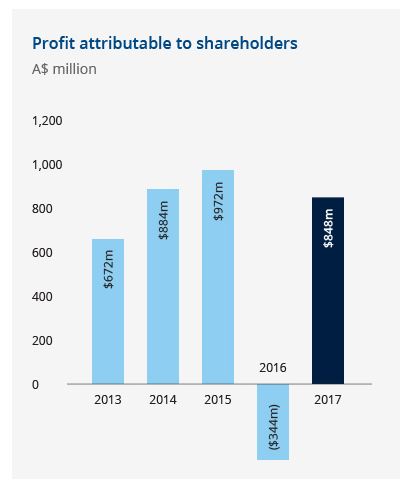
Net profit was $848 million compared with FY 16: -A$344 million.

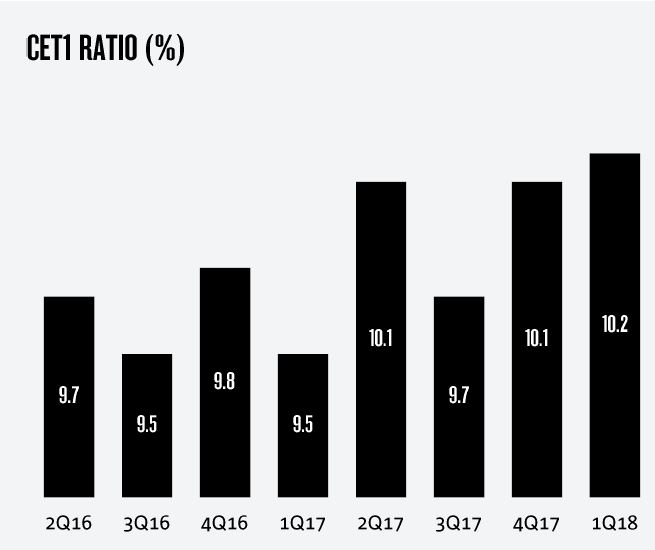
AMP’s capital position remains strong, with level 3 eligible capital resources $2,338 million above minimum regulatory requirements at 31 December 2017, up from $2,195 million at 31 December 2016.

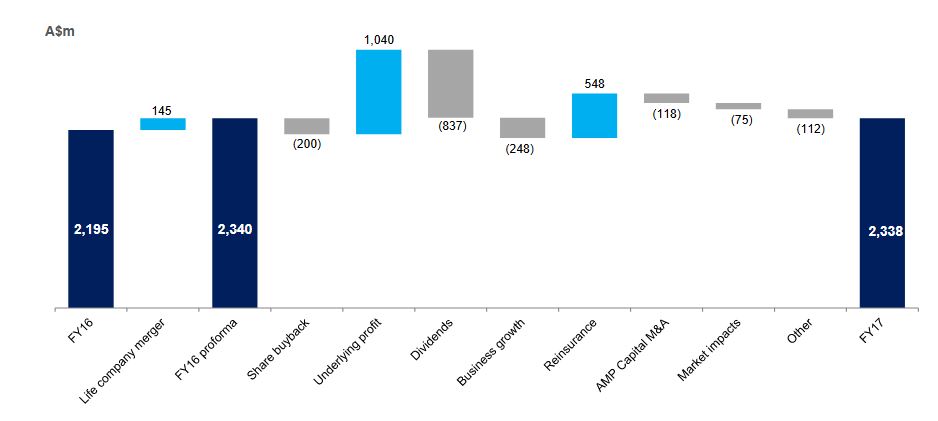
The capital position was strengthened by the second reinsurance program announced at 1H 17. Potential for capital management initiatives will be considered at the conclusion of the portfolio review of AMP’s manage for value businesses. AMP expects to provide a further update at or before its AGM.

The final dividend has been maintained at 14.5 cents a share, franked at 90 per cent. The total FY 17 dividend is 29 cents a share and is within AMP’s stated target range of 70 to 90 per cent of underlying profit.

In 2017, AMP announced a strategy to manage its Australian wealth protection, New Zealand and Mature businesses for value and capital efficiency. The completion of a comprehensive reinsurance program of Australian wealth protection, released circa A$1 billion in capital to the group. Disciplined cost management has driven efficiency in New Zealand and Mature.   To continue to realise value from these businesses, AMP is well progressed with a portfolio review with all alternatives being considered. As a result, AMP is in discussions with a number of interested parties. While the portfolio review is yet to be concluded, AMP expects to provide a further update at or before its AGM.

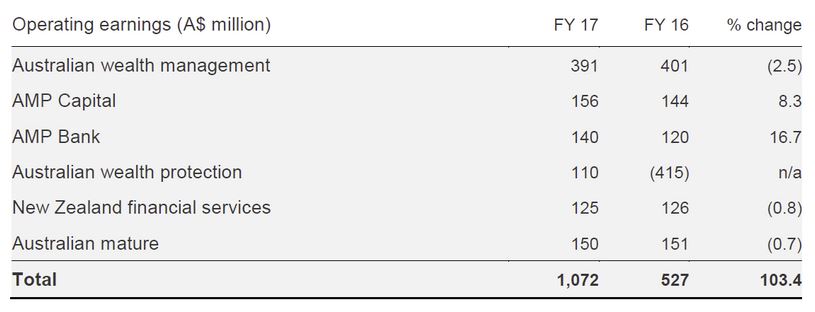
Here are the business unit splits.

Australian wealth management     

Australian wealth management delivered a resilient performance during a period of high margin compression due to final transitions to MySuper. Operating earnings were 2.5 per cent lower at A$391 million. However, strong growth in net cashflows and 10 per cent growth in other revenue from Advice and SMSF demonstrates the underlying growth trajectory of the business.

Net cashflows increased 177 per cent on FY 16 to A$931 million, reflecting significant inflows from discretionary super contributions ahead of 1 July 2017 changes to non-concessional caps. The competitive strength of AMP’s corporate super platform also supported inflows, up A$436 million on FY 16 to A$717 million, with several mandate wins.

North, AMP’s flagship wrap platform, continued to perform with net flows of A$5.7 billion, up 14 per cent on FY 16 and up 28 per cent excluding a one-off significant transfer that occurred in FY 16. Assets under management rose 29 per cent to A$34.9 billion over the same period.

In 2017, AMP paid A$2.5 billion in pensions to support customers in their retirement.

AMP Capital

AMP Capital external net cashflows increased significantly to A$5.5 billion (FY 16: A$967 million), the highest since the establishment of AMP Capital in 2003. Cashflows reflect strong international investor interest in AMP Capital’s fixed income, real estate and infrastructure capabilities. External assets under management fees rose by 6 per cent to A$266 million.

Operating earnings increased 8 per cent on FY 16 to A$156 million driven by growth in fee income and particularly in real assets. Controllable costs increased 5 per cent reflecting investment in real asset capabilities, growth initiatives and international expansion. AMP Capital’s cost to income ratio of 61.5 per cent remains within the full-year target of 60 – 65 per cent.

Direct international institutional clients grew 46 per cent to 291 over the year, with AMP Capital managing A$12 billion in assets on their behalf. During the period, AMP Capital established a partnership with, and purchased a minority stake in, US real estate investor, PCCP. The partnership brings together AMP Capital’s Asian distribution capability with PCCP’s US-based investment expertise.

China Life AMP Asset Management[4] (CLAMP) continues to grow rapidly with AUM increasing 59 per cent to RMB 183.3 billion (A$36 billion) in FY 17, supported by the launch of 25 new products including diversified, equity and fixed income funds. Total AUM for China Life Pension Company, the pensions joint venture in which AMP owns a 19.99 per cent stake, grew 41 per cent to RMB 531 billion (A$104.3 billion).

At 31 December 2017, AMP Capital had A$4.2 billion of committed real asset capital available for investment, up A$700m from 30 June 2017. AMP Capital invested A$5.6 billion in new infrastructure and real estate assets in 2017.

AMP Bank

AMP Bank operating earnings rose 17 per cent to A$140 million (FY 16: A$120 million). Performance was driven by a 14 per cent rise in residential lending to A$18.9 billion underpinned by a conservative credit policy. As expected, loan growth moderated in 2H 17 as the market adjusted to new regulatory requirements.

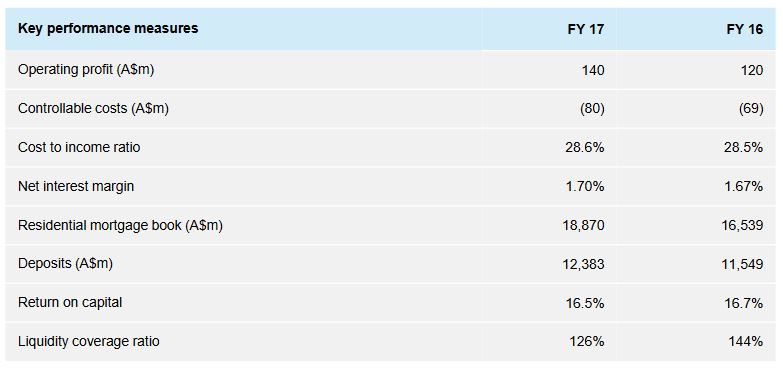
Controllable costs increased in FY 17, reflecting investment in people and technology to support growth, however, the cost to income ratio remained almost flat at 28.6 per cent (FY 16: 28.5 per cent).

Australian wealth protection

Performance in wealth protection stabilised following strengthening of best estimate assumptions and completion of a comprehensive reinsurance program, which occurred in FY 17, effectively reinsuring 65 per cent of AMP’s retail life insurance portfolio. Operating earnings improved to A$110 million in FY 17, with experience largely in line with expectations. Profit margins decreased on FY 16 to A$99 million reflecting the assumption changes and reinsurance program. Focus remains on running an efficient and competitive business while maintaining high levels of customer service. In 2017, AMP paid A$1.1 billion in claims to support customers during their time of need.

New Zealand financial services

Operating earnings, down 1 per cent to A$125 million, reflect the depreciation of the New Zealand dollar relative to the Australian dollar. In NZ$ terms, operating earnings increased 1 per cent to NZ$135 million, driven by higher profit margins and disciplined focus on cost control. AMP New Zealand financial services continues to hold market-leading positions in wealth protection and wealth management, in addition to being one of the largest KiwiSaver providers with NZ$5.1 billion in AUM, an increase of 16 per cent on FY 16.

Australian mature

Operating earnings of A$150 million reflect expected portfolio run-off offset by improved investment markets and favourable annuity experience.

Labor’s 2% cap on private health insurance premium rises won’t fix affordability

From The Conversation.

This week, Opposition Leader Bill Shorten announced a new private health insurance policy the Labor Party will take to the next election. First, Labor will get the Productivity Commission to conduct a full review of the private health insurance system. Second, and more controversially, Shorten promised a short-term 2% cap on premium increases for two years.

The promised cap is in response to consistently high premium increases of around 5% in recent years. In justifying the policy, Shorten said:

… the idea these big insurers are making record profits and yet the premiums keep going up and up, it can’t be sustained.

This announcement has already been greeted with scepticism and fury from the health insurance industry, with industry body Private Healthcare Australia branding the proposal “disastrous”.

As the proposal explicitly targets their profit margins, their response is predictable. However, in this case, they are right to complain. The premium cap policy is a crude measure that is unlikely to improve long-term affordability and may further distort the market in the short term.

Unintended consequences

Price controls introduced by governments usually have good intentions, but often have unintended consequences.

Consider, for example, the proposal to introduce caps on rent increases in the United Kingdom. Rent controls are among the most well-understood policies in economics: they reduce the quality and quantity of housing, leaving renters facing long search times to find housing and poorly maintained properties.

In health insurance, the most likely immediate response to the cap would be for insurers to increase the amount of exclusions – procedures and treatments that aren’t funded – and co-payments associated with policies.

So, while prices are kept low by the cap, consumers are effectively getting less coverage for their money. This would enable insurers to maintain their profit margins, but produce no gain, and further confusion, for consumers.

We already know the number of policies with exclusions, such as hip replacements and childbirth, has grown substantially. Labor’s proposal will probably accelerate the trend.

Long-term pain

Alternatively, as this proposed cap is time-limited, insurers may just put up with the pain of lower margins for a couple of years, with the timeline too short for significant changes to exclusions.

However, there may still be negative long-term impacts. We can look back in history for a clue about the long-term effects of a temporary cap on premiums. In 2000 and 2001, the Howard government implemented an effective “freeze” on private health insurance premium increases.

As can be seen in the graph, average premium increases were below 2% in 2000 (the largest insurer, Medibank Private, had a 0% increase in 2000), and were zero in 2001.

Average private health insurance premium increases in Australia from 2000 to 2018. Author

While consumers in 2000 and 2001 may have gained from lower real-terms premiums, we can see the long-term effects in the years from 2002 to 2005, when premium increases were between 7 and 8%. This is clearly an attempt by health insurance companies to “catch up” on the increases they missed in 2000 and 2001.

So, we may expect history to repeat itself if Labor wins the next election and introduces this policy: premiums will just rise faster in the years following the cap, negating any short-term benefit to consumers.

Why costs are rising

The proposed Productivity Commission review is much more promising in tackling important issues in the market, including lack of competition, confusing exclusions in policies, and its interaction with public funding through Medicare and public hospitals.

However, there is no solution to premium rises way in excess of general inflation if recent trends in healthcare technology and use continue. The number of hospital visits funded by private health insurance is growing strongly, at an average of 5.5% per year over the past five years.

Growth is across all areas of health care, from elective surgery like cataracts (4.9% a year) and hip replacement (5.5% a year) to diagnostic procedures such as endoscopy (4.4% a year) and life-saving cancer treatments like chemotherapy (5.5% a year).

We are paying more for our health insurance because we are using it more. No crude, short-term measures to restrict premium growth will deal with this fact. And good luck to the Productivity Commission in trying to reverse a global trend for higher private health care expenditure.

Author: Peter Sivey, Associate Professor, School of Economics, Finance and Marketing, RMIT University

Financial Stress is Increasing in Australia as Cost of Living Pressures Mount

After the ME Bank Survey, and our Household Finance Confidence Index both showed the financial pain many households are in; now National Australia Bank’s (NAB) latest Consumer Behaviour Survey, shows the degree of anxiety being caused by not only cost of living pressures but also health, job security, retirement funding as well as Australian politics.

From NAB and Business Insider.

Of all the things bothering Australian households in early 2018, nothing surpasses cost of living pressures.

Source: NAB

From the National Australia Bank’s (NAB) latest Consumer Behaviour Survey, it shows the degree of anxiety being caused by not only cost of living pressures but also health, job security, retirement funding as well as Australian politics.

The higher the reading, the more anxious it is making Australians.

Somewhat surprisingly, it was not the gaggle in Canberra that caused the most anxiety for households in the latest survey, but rather persistent concerns surrounding living expenses.

“[The index] was basically unchanged in Q4 2017 at near survey lows with job security causing Australians the least stress, consistent with a strongly improving labour market,” said Alan Oster, NAB Group Chief Economist.

“That said, the cost of living is still weighing most heavily on them, highlighting the disconnect between low levels of economy-wide inflation and consumer focused costs.”

That was reflected in the detail of the latest survey, revealing some alarming statistics as to just how many Australians are struggling at present.

It found around two in five Australians suffered some form of financial hardship over the survey period, especially among lower-income earners.

Over 50% of low income earners reported some form of hardship, with almost one in two 18 to 49-year-olds being effected.

As seen in the chart below, after a steady improvement in late 2016 and early 2017, those reporting financial hardship have increased in recent quarters, coinciding with steep increases in gas and electricity charges for many Australian households.

Source: NAB

“Being unable to pay a bill was the most common cause,” the NAB said, adding this came in at over 20%.

“Not having enough for food and basic necessities was next, impacting one in three low income earners.”

Some 18% of respondents reported not having enough for food and basic necessities in the latest survey.

Source: NAB

Nearly half of those consumers also reported they were “extremely” concerned about their current financial position, nominating paying their utility bills as the biggest impact on their financial position.

Source: NAB

“While consumers told us they were a little less concerned about their household’s current financial position in Q4, being unable to pay a bill — particularly utilities — continues to have by far the biggest impact on those households most concerned about their finances,” Oster said.

With cost of living pressures still creating anxiety among households, the NAB asked respondents how much extra income they would need to alleviate those concerns.

In short, a lot, especially for those in the big capital cities and households with children.

“On average, consumers told us they need an extra $207 a week – or $10,764 per year,” Oster said, adding that “this varied according to where we live, our income, gender and family status”.

“It ranged from $221 in New South Wales and the ACT to $132 in Tasmania, and from $214 in capital cities to $186 in rural areas.

“Consumers with children need $258 and those without $191”.

Source: NAB


While Oster admits that how consumers “feel” doesn’t necessarily correlate with how they really spend, it underlines the point that many Australians think they’re getting squeezed financially.

If it wasn’t already apparent, this likely ensure the next federal election campaign will be centred around alleviating the perceived cost of living pressures facing many Australian households.

7:30 Does Interest Only Loans Problem

A segment on ABC 7:30 discussed the problem faced by many interest only mortgage holders as tighter lending standards bite, forcing some to higher payment P&I loans or to sell.

We discussed this issue some time back, and made an estimation that $60 billion of such loans are likely to fall foul of the tightening.


COBA Welcomes Bipartisan Approach to BEAR

COBA has welcomed the bipartisan approach taken in Federal Parliament to give small and medium banking institutions more time to prepare for the Banking Executive Accountability Regime (BEAR).

Amendments to the Bill moved by the Opposition in the House were supported by the Government and the amended Bill has now passed the Senate. Small and medium banking institutions have until 1 July 2019 to prepare for the BEAR. It will commence for the major banks on 1 July 2018.

“It’s very pleasing that the Government and the Opposition recognise the importance of customer owned banking and the vital role it plays in delivering diversity and competition in retail banking,” COBA CEO Michael Lawrence said.

“To promote a more competitive banking market, it is critically important to minimise regulatory costs on smaller banking institutions.

“Customers ultimately bear the cost of regulatory compliance.

“MPs have also recognised that the regulatory compliance burden is effectively a competitive advantage for the major banks. This is because major banks have vastly greater resources than their smaller competitors to quickly respond to new regulatory obligations.

“More time for small and medium banking institutions to prepare for the BEAR in an orderly way will reduce the cost burden that would otherwise apply.

“I congratulate the Government and the Opposition on this outcome.”