Silvana Tenreyro, External MPC Member, Bank of England, spoke on “The fall in productivity growth: causes and implications” as the 2018 Maurice Peston Lecture.
She explores the problem of low productivity since the GFC, and using UK data shows that the brake on productivity growth is from finance, manufacturing followed by ICT and services. But finance appears to be the number one sector causing the problem. It had the fastest-growing labour productivity of any sector in the run-up to the crisis, at 5% per year. Since 2009, productivity has actually shrunk by 2.1% per year. Indeed, key contributors to the crisis itself – risk illusion and increasing financial-sector leverage – may have increased (correctly measured) pre-crisis productivity growth.
Reading from this, as the finance sector continues to respond to pressure on margins, increased regulation, and lower growth, we think it will continue to be a brake on productivity, and it is possible that the growth of financial activities somehow crowded out the growth in the rest of the economy in a competition for talent and resources. Echoes of our recent discussion on Zombie firms! Relying more on the finance sector for growth looks like a problem.
Here is a summary of the speech.
Though commentators have referred to different measures of productivity, most have focused on aggregate labour productivity, defined as the total value added of the economy divided by the total number of hours worked.
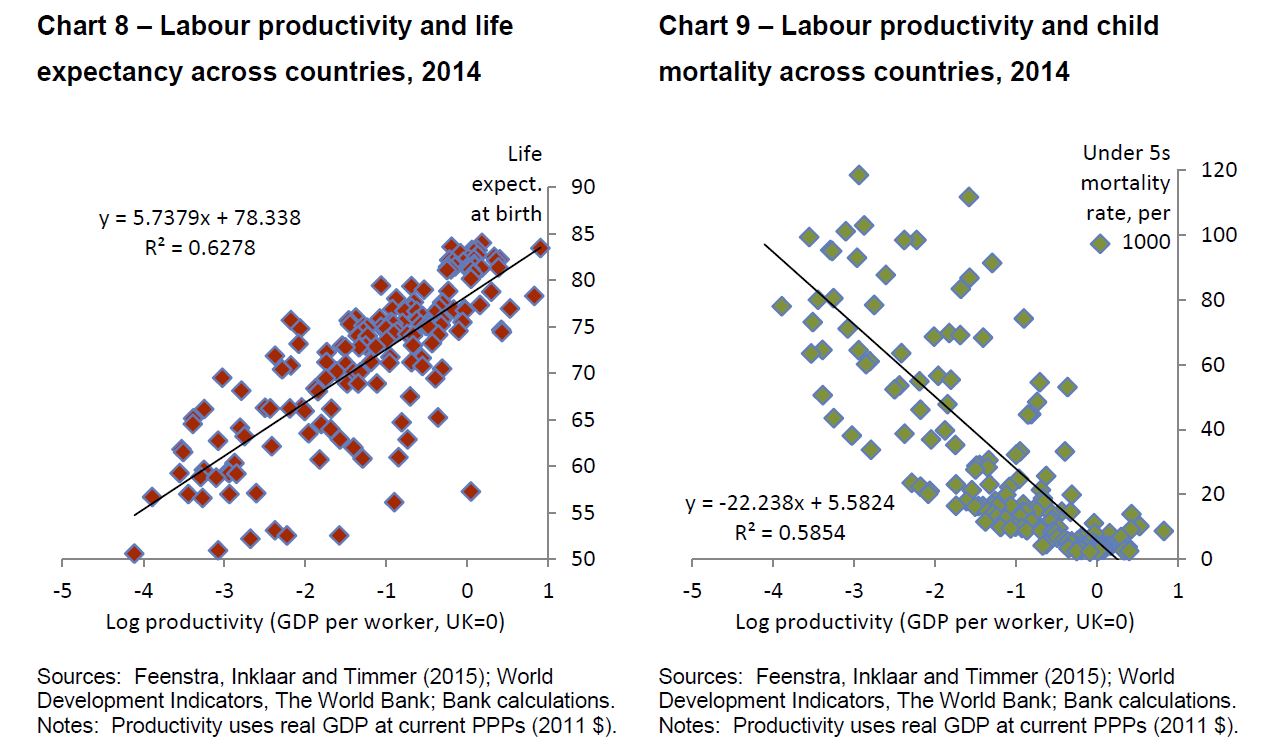
Productivity matters for welfare. Over time and across countries, higher productivity is reliably associated with higher wages, higher consumption levels and improved health indicators.
Productivity is crucial to setting monetary policy. The MPC’s remit sets out a 2% inflation target over an appropriate time horizon with the rationale that inflation stability can lay the foundations for strong and sustainable growth. Productivity growth is the key determinant of how much demand can grow without creating inflation and hence it is a critical input into our forecast and deliberations.
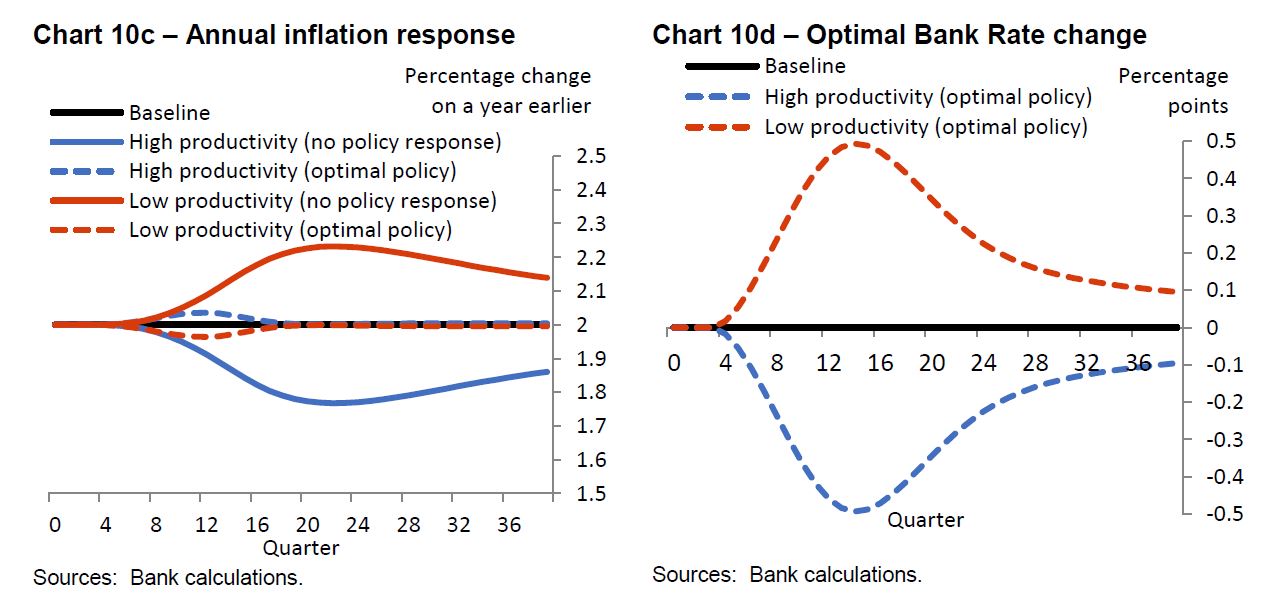
The blue solid lines show a scenario where a 1% growth rate for potential productivity was overly pessimistic. The blue solid lines show a scenario where a 1% growth rate for potential productivity was overly pessimistic.
Over the three decades before the global financial crisis, productivity growth averaged 2.3% per year. Productivity fell in 2008 and 2009 as the financial crisis hit, and, in the seven years since, it has only grown by an average 0.4% per year. As a result, the typical worker in 2016, while still twice as productive as the 1970s, could only produce 1% more than in 2007.
Focusing just on the past half-century, the decade since the crisis looks like an aberration. Productivity growth barely deviated from its 2% trend until 2007 (Chart 2). It is little wonder, therefore – looking at these data – that forecasters (the Bank of England included) consistently predicted that productivity growth would recover to a rate close to its 1970s-2000s average.
Over a longer sweep of history, the past decade is far from unusual. Chart 3 shows annual UK labour productivity growth since 1760. Prior to the 1970s, there were often large shifts in the average growth rate of productivity from one decade to the next. Depending on how you interpret the chart, that could be a good-news or a bad-news story.
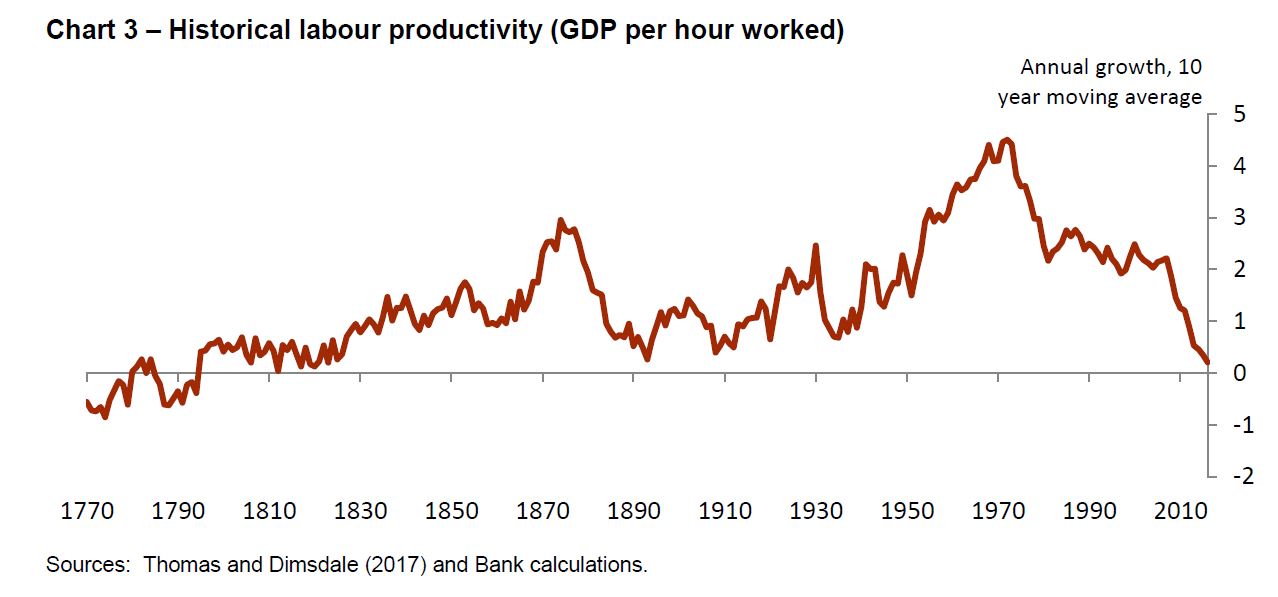
The ‘glass half full’ reading might note that we have been through several temporary periods of weak productivity growth before, but have always recovered. But there is also a ‘glass half empty’ interpretation. Robert Gordon from Northwestern University has argued that the hundred years spanning from 1870 to 1970 were exceptional in the number and scope of life-changing break-through innovations and there is absolutely no reason to expect growth to be as high and broad-based now. The progress since 1970, he argues, has been concentrated in a relatively narrow part of the economy: entertainment, communication and information processing. But in other essential areas like food, clothing and shelter, progress has been much slower.
Cross-country comparisons are tricky, but the ONS estimates that compared to the UK, labour productivity is on average 18% higher in the other six members of the G7, 28% higher in the US and 35% higher in Germany (Chart 4). These are significant differences. If British workers were able to catch-up to the G7 average, what currently takes us five days’ work to produce could be done in little over four. If we were able to catch up to Germany, we might all be able to go home from work on Thursday afternoon each week without any fall in GDP.
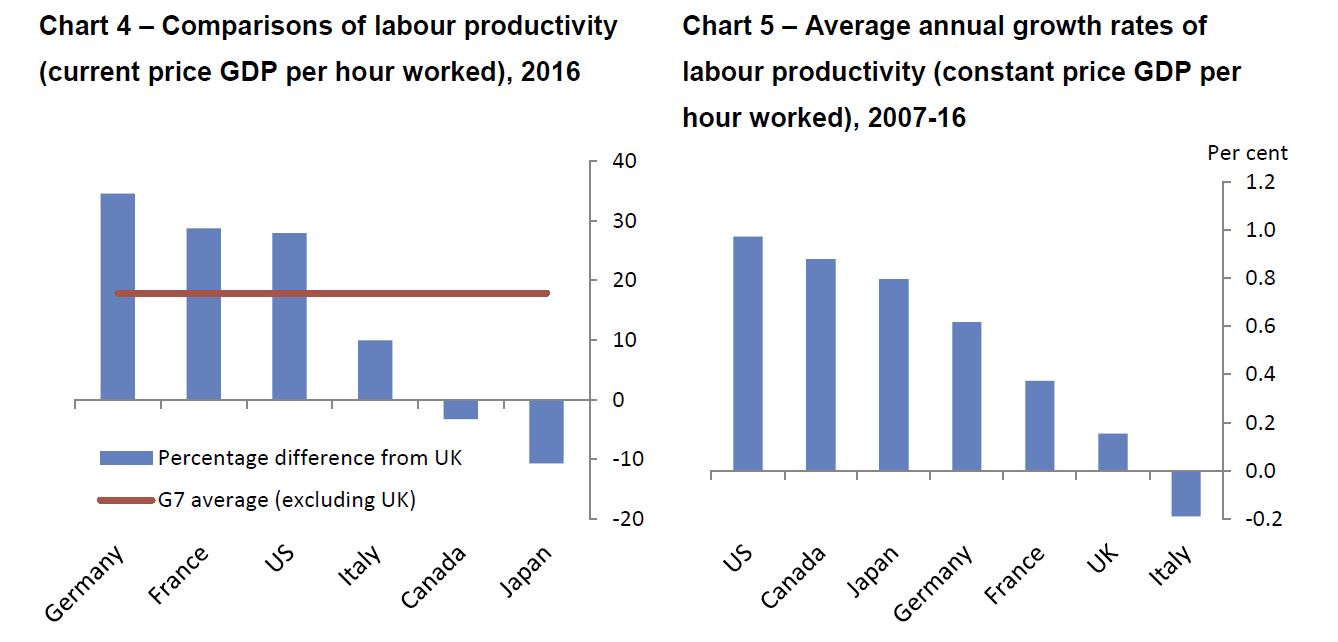 The plots have illustrated the UK productivity slowdown, both relative to other countries and also relative to the UK’s own recent past.
To attempt an answer, why productivity got lost, it is helpful to carry out a sectoral analysis, breaking down the productivity slowdown by industry. The sectoral distribution of productivity growth can help us locate where it has slowed. The slowdown, or difference in the aggregate productivity growth rates between the pre- and post-crisis periods for the UK economy amounted to (a negative) 1.5 percentage points. Remarkably, three-quarters of this productivity growth shortfall is accounted for by just two sectors: manufacturing and finance.
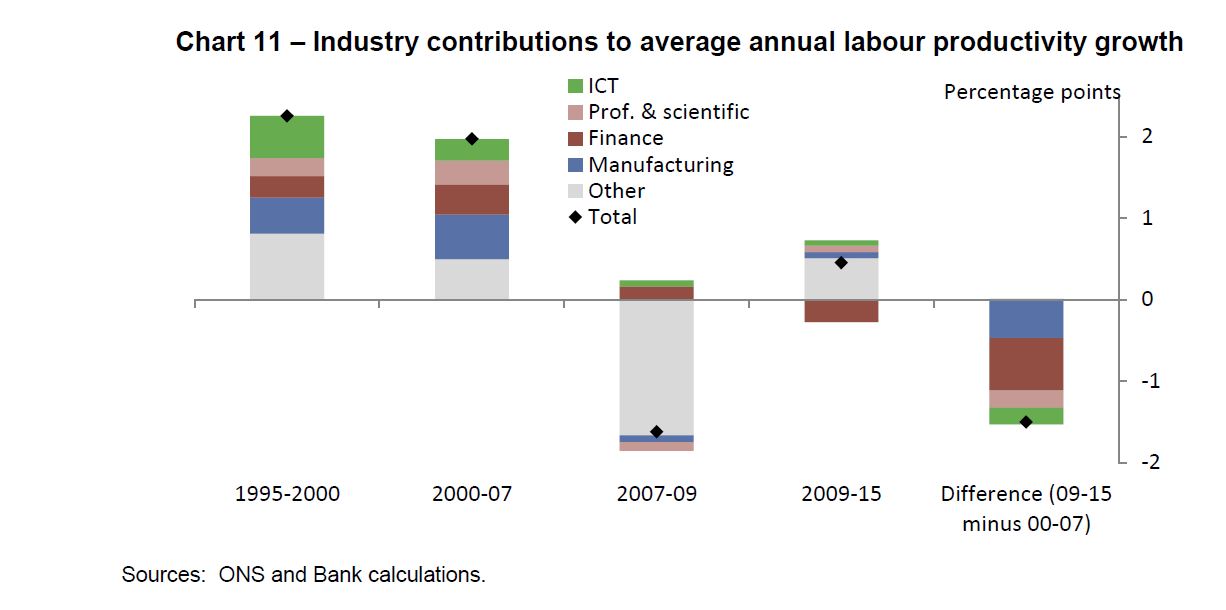
A further quarter of the slowdown is explained by two more sectors: information and communication technologies (ICT); and professional, scientific and technical services. The remaining 14 sectors contributed 0.5pp to productivity growth, both pre- and post-crisis. In other words, productivity outside those four sectors has been growing at a roughly constant, modest rate.
The finance sector is the biggest contributor to the productivity slowdown. It had the fastest-growing labour productivity of any sector in the run-up to the crisis, at 5% per year. Since 2009, productivity has actually shrunk by 2.1% per year.
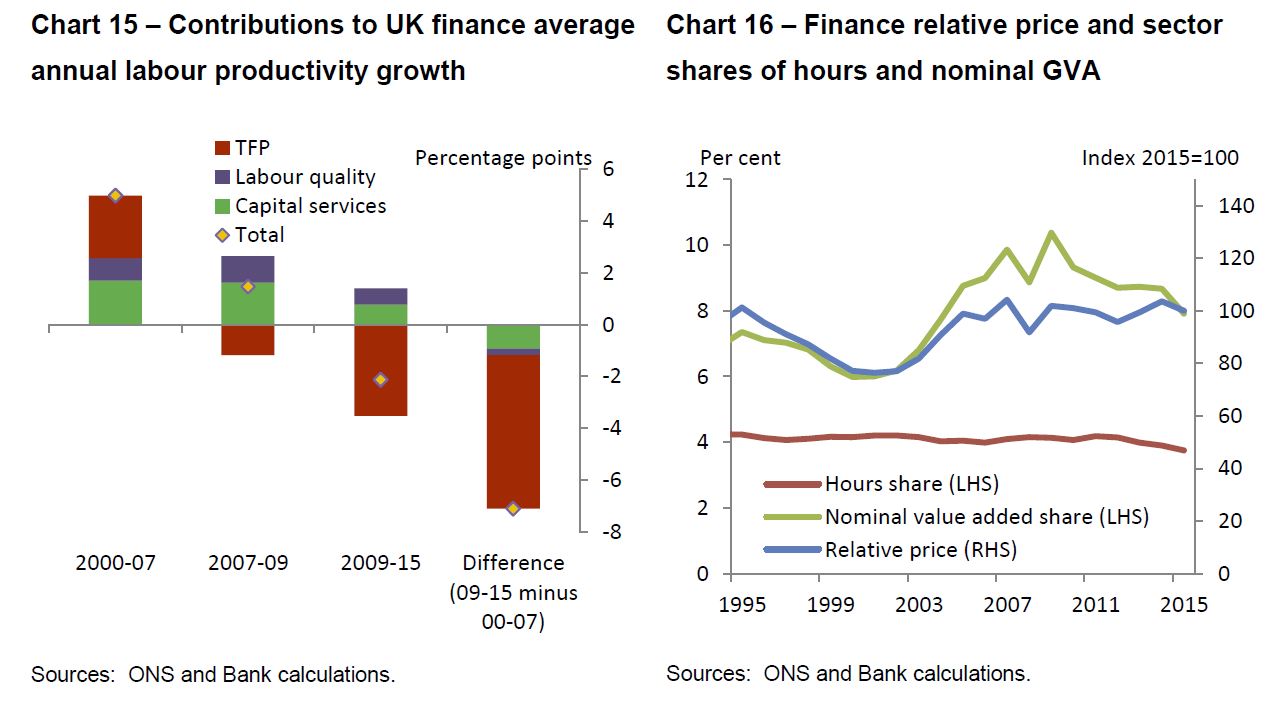
It is unlikely that the entire slowdown in financial sector TFP is down to mismeasurement. A complementary explanation is that the key contributors to the crisis itself – risk illusion and increasing financial-sector leverage – may have increased (correctly measured) pre-crisis productivity growth. In doing so, they may also have sowed the seeds of the crisis and subsequent weakness. Increased leverage and higher risk tolerance boosted profits, earnings and output. That may have attracted capital and employees from other sectors of the economy. More broadly, rapid credit growth and low risk premia fed into higher asset prices, with positive spillovers to demand elsewhere in the economy. As the crisis hit, these channels went into reverse, leading to falls in wealth and higher uncertainty. Both lowered spending and output and probably also increased households’ labour supply.
Whatever the ultimate trigger of the finance-sector slowdown, its contributions to measured GDP and productivity growth are unlikely to pick up to those we saw in its pre-crisis boom. To achieve that would require a repeat of the type of unsustainable increases in leverage that we saw in the 2000s. The sector’s post-crisis performance has been as poor as its pre-crisis performance was strong. Credit and deposit growth have been weak as banks and households have sought to deleverage. It is possible that the growth of financial activities somehow crowded out the growth in the rest of the economy in a competition for talent and resources.
The financial-stability reforms we have seen since the crisis were put in place precisely to prevent the damaging consequences of those episodes.
Note: The views are not necessarily those of the Bank of England or the Monetary Policy Committee.

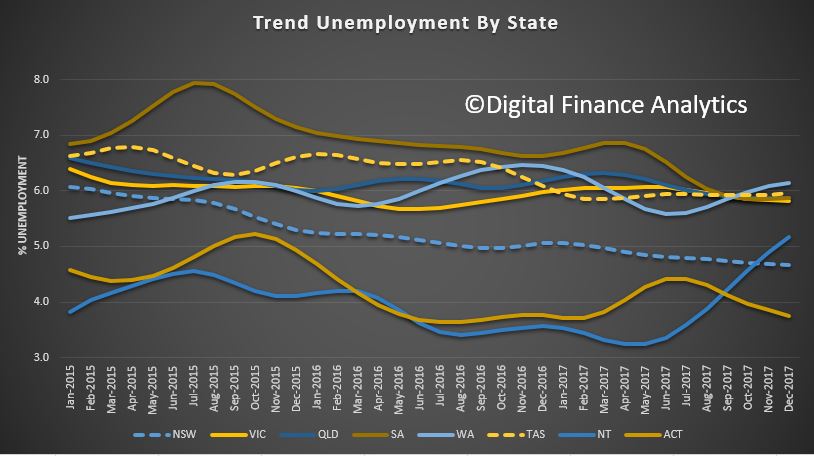
 By state, trend employment rose in NT, WA and SA. Over the past year, all states and territories recorded a decrease in their trend unemployment rates, except the Northern Territory (which increased 1.6 percentage points). The states and territories with the strongest annual growth in trend employment were Queensland and the ACT (both 4.6 per cent), followed by New South Wales (3.5 per cent).