Brokers ‘not recording the outcomes’ of IO discussions: ASIC

From The Adviser.

Brokers may be having the appropriate conversation with borrowers on interest-only home loans, the financial services regulator has said, but there has been some “pretty poor record keeping”.

The financial services regulator announced last week that it would “shortly” begin reviewing the loan files of brokers with a “high proportion of interest-only loans” as part of its work “to ensure that consumers are not paying for more expensive products that are unsuitable”.

The review was triggered by the fact that interest-only (IO) loans are now often more expensive than principal & interest loans, and it is therefore becoming “ever important now for lenders and brokers to explain and justify why they are putting people into more expensive loans”.

Speaking to The Adviser, Michael Saadat, ASIC’s senior executive leader for deposit takers, insurers & credit services, elaborated that while the regulator believes that brokers are having the appropriate discussions with consumers about the reasons for taking out IO loans, the record keeping on loan files has not been of a high standard.

He revealed: “In the past, I’d say we have seen pretty poor record keeping on that front, where there has been very little on the loan file which tells you why the consumer got that product. In general, when we have looked at loan files in the past, we have seen [responses to the question]: ‘What were the consumers’ requirements and objectives?’ In many cases, we see things like: ‘To buy a house’. That is pretty implicit, but it really doesn’t tell you too many things about what type of product, what type of loan, what type of rate, etc.

“So, our view is that although these discussions are happening… brokers are having these discussions, but they’re not recording the outcomes of those discussions. And it’s hard to prove that you’re meeting your obligations if you don’t have something on a file that shows why you have recommended a particular loan.”

What ASIC wants to see on IO loan files

Mr Saadat added that the next stage of the review into interest-only loans will be “getting these individual files and looking to see how consumers’ requirements and objectives have been documented on those files”.

He said: “If [borrowers] have been provided with an interest-only loan and they are an owner-occupier, we will be looking for a summary or an explanation on the loan file that describes why the consumer was provided with an interest-only loan. So, that’s really the key thing.”

Adding that ASIC “won’t be that prescriptive in terms of our expectations”, Mr Saadat revealed that what the regulator wants to see is “information on the file which is sufficient to explain why the consumer’s decision (or suggestion from the lender or broker) to go into an interest-only for an owner-occupier loan was the right one”.

The lending industry has already begun responding to some of these concerns, with Commonwealth Bank launching a new IO simulator to help brokers show customers the differences between these type of repayments as well as principal & interest repayments.

Mr Saadat told The Adviser that these types of tools, which delve deeper into why consumers need an IO product, help “make the consumer aware of some of the risks involved with going down a particular path”; for example, “the fact that at the end of that period, you do need to make higher principal and interest payments and, over the life of the loan, you may end up paying more interest as a result”.

Mr Saadat concluded: “Investors may have other reasons for getting an interest-only loan — they may be tax reasons, for example, whereas those reasons don’t necessarily apply to owner-occupiers. And that doesn’t mean that owner-occupiers should never have been given an interest-only loan. Of course, there will be cases where that still is appropriate. We just want to make sure that it is appropriate and that you’re documenting the reasons for that.”

The regulator’s crackdown on IO loans has begun to bite, according to some industry data. New data from Mortgage Choice has revealed that there was a 60 per cent decline in interest-only mortgages over a period of just six months.

According to Mortgage Choice’s latest home loan approval data, the proportion of interest-only loans written by the brokerage dropped from 35.95 per cent in April 2017 to 14.64 per cent in September 2017.

CEO of Mortgage Choice John Flavell said that the “significant decline” was a result of lenders hiking rates for these loans.

Housing Affordability Eases for Some

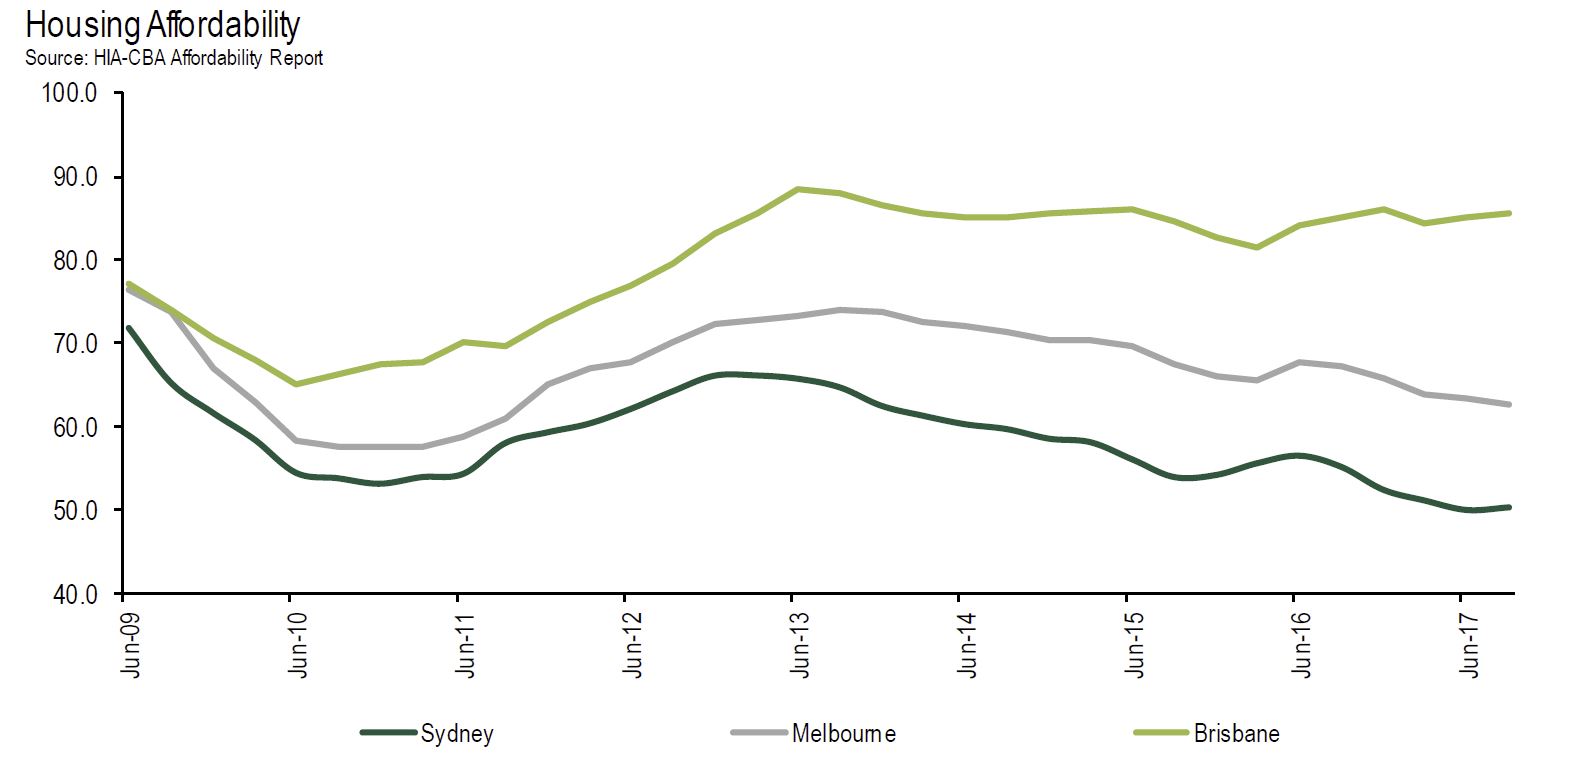
The HIA says that despite the poor levels of housing affordability there are signs of improvement for home-buyers. Investors are not so lucky.

“The HIA Housing Affordability index for Australia improved by 0.5 per cent in the September 2017 quarter but still remains 4.4 per cent below the level recorded a year ago.

“Housing Affordability has been deteriorating in Australia for decades, particularly in capital cities, as demand for new housing greatly exceeded the supply.

“Recent interventions by the government, through APRA, to curb growth in investor activity may have improved affordability for owner-occupiers.

“As a consequence of this intervention it appears that the market has responded with higher mortgage rates for investors and eased rates for owner-occupiers.

“This has had the unintended consequence of improving housing affordability for owner-occupiers.

“Irrespective of intent, this is positive news for owner-occupier buyers in the affordability equation.

The HIA Affordability Index has been produced for more than 17 years using a range of recent data including wages, house prices and borrowing costs to provide an indication of the affordability of housing.

A higher index result signifies a more favourable affordability outcome.

“The Report’s regional analysis demonstrates the substantial differences in affordability conditions around the country,” added Mr Reardon.

“Sydney retains the mantle as the nation’s least affordable housing market despite the affordability index showing a modest improvement in affordability during the quarter. It still takes twice the average Sydney income to service a mortgage on a median priced home in Sydney while avoiding mortgage stress.

Brisbane, Adelaide, Perth and Darwin all recorded modest improvements in affordability in the September quarter. Melbourne, Hobart and Canberra each recorded a modest deterioration in affordability during the quarter.

Trend unemployment rate lowest in 4 years

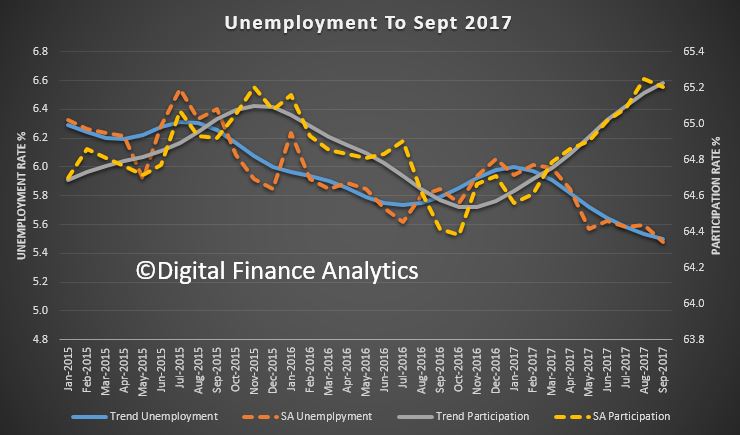
The monthly trend unemployment rate has decreased by 0.2 per cent over the past year to 5.5 per cent in September 2017, according to figures released by the Australian Bureau of Statistics (ABS) today. This is the lowest rate seen since March 2013 and reflects the strength in employment growth over the past 12 months.

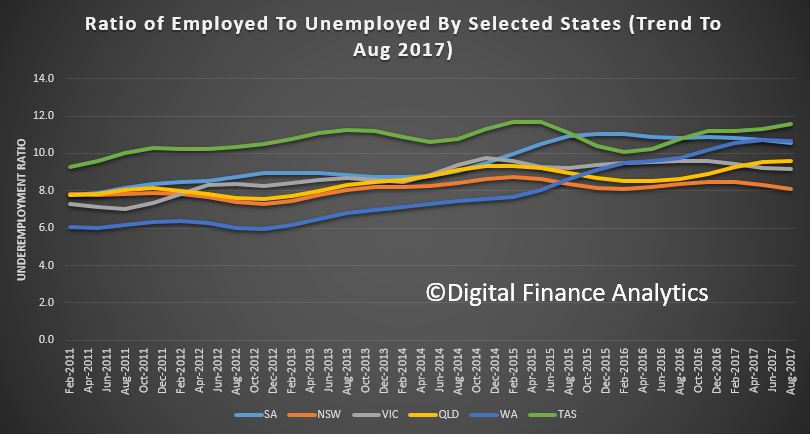
But it is worth noting the underemployment trend rate (proportion of employed persons) rate still does not look that flash, especially in TAS, SA and WA.

“The trend unemployment rate had been hovering in the range of 5.6 to 5.8 per cent for almost two years, but has now dropped to a four year low of 5.5 per cent,” the Chief Economist for the ABS, Bruce Hockman, said.

The trend monthly unemployment rate for both males and females dropped to 5.5 per cent, also for the first time since March 2013.

The trend participation rate remained steady at 65.2 per cent. The male participation rate was 70.8 per cent, while the female participation rate reached a record high of 59.9 per cent.

Monthly trend full-time employment increased for the 12th straight month in September 2017. Full-time employment grew by a further 16,000 persons in September, while part-time employment increased by 8,000 persons, underpinning a total increase in employment of 24,000 persons.

“Full-time employment has now increased by around 271,000 persons since September 2016, and makes up the majority of the 335,000 person net increase in employment over the period,” Mr Hockman said.

Over the past year, trend employment increased by 2.8 per cent, which is above the average year-on-year growth over the past 20 years (1.9 per cent).

Over the past year, the states with the strongest annual growth in employment were Queensland (4.1 per cent), Tasmania (3.9 per cent), Victoria (3.1 per cent) and Western Australia (2.9 per cent).

The trend monthly hours worked increased by 3.1 million hours (0.18 per cent), with the annual figure also showing strong growth (2.9 per cent).

Trend series smooth the more volatile seasonally adjusted estimates and provide the best measure of the underlying behaviour of the labour market.

The seasonally adjusted number of persons employed increased by 20,000 in September 2017. The seasonally adjusted unemployment rate decreased by 0.1 percentage points to 5.5 per cent and the labour force participation rate remained steady at 65.2 per cent.

The Property Imperative Volume 9 Report Released

The latest and updated edition of our flagship report “The Property Imperative” is now available on request with data to mid October 2017.

This Property Imperative Report is a distillation of our research into the finance and property market, using data from our household surveys and other public data. Whilst we provide weekly updates via our blog, twice a year we publish this report. This is volume 9. It offers, in one place, a unique summary of the finance and property markets, from a household perspective.

Residential property, and the mortgage industry is currently under the microscope, as never before. Around two thirds of all households have interests in residential property, and about half of these have mortgages. More households are excluded completely and are forced to rent, or live with family or friends.

We believe we are at a significant inflection point and the market risks are rising. Many recent studies appear to support this view. There are a number of concerning trends. While household incomes are flat in real terms, the size of the average mortgage has grown significantly in the past few year, thanks to rising home prices (in some states), changed lending standards, and consumer appetite for debt. In fact, consumer debt has never been higher in Australia. As a result, households are getting loans later, holding mortgages for longer, even in to retirement, so household finances are being severely impacted, and more recent changes in underwriting standards are making finance less available to many.

Property Investors still make up a significant share of total borrowing, and experience around the world shows it is these households who are more fickle in a downturn. Many use interest only loans, which create risks downstream, and regulators have recently been applying pressure to lenders to curtail their growth.

Mortgage rates are now higher for Investors and those holding Interest Only loans, while low-risk customers with a Principal and Interest loan should be able to find some amazingly low rates. While mortgage underwriting standards are now tighter, there is an overhang of existing loans which would now fall outside existing underwriting standards. Interest Only loans are especially at risk, not least because rental incomes are being compressed.

We hold the view that home prices are set to ease in coming months, as already foreshadowed in Sydney. We think mortgage rates are more likely to rise than fall as we move on into 2018.

Finally, lenders have been able to repair their margins, under the umbrella of supervisory intervention, and their back book repricing has created a war chest to fund attractor offers.

We will continue to track market developments in our weekly Property Imperative weekly video blogs, and publish a further consolidated update in about six months’ time.

Here is the table of contents.

1 EXECUTIVE SUMMARY
 2 TABLE OF CONTENTS
 3. OUR RESEARCH APPROACH
 4. THE DFA SEGMENTATION MODEL
 3 PROFILING THE PROPERTY MARKET
 3.1 Current Property Prices
 4 MORTGAGE LENDING TRENDS
 4.1 Total Housing Credit Is Up
 4.2 ADI Lending Trends Are Suspect
 4.3 Housing Finance Flows
 4.4 The Rise of the Bank of Mum and Dad
 5 HOUSEHOLD FINANCES AND RISKS
 5.1 RBA Financial Stability at Risk
 5.2 IMF Warnings On Growth and Debt
 5.3 Household Ratios Under Pressure
 5.4 Housing Occupancy Costs Are High
 5.5 Households Are Spending More On Basics
 5.6 Savings Are Shrinking
 5.7 DFA Mortgage Stress Rises Again
 5.8 Top Ten Stressed Post Codes
 5.9 More Households Have No Equity
 5.10 Greater Risks from Interest Only Loans
 5.11 The Consumption Crunch
 5.12 A Fall in Household Financial Security
 5.13 Mortgage Rates Will Rise – Sometime
 5.14 Defaults Are Down a Little, But Risks Remain
 5.15 Observations
 6 HOUSEHOLDS’ DEMAND FOR PROPERTY
 6.1 Property Active and Inactive Households
 6.2 Cross Segment Comparisons
 6.3 Property Investors
 6.4 How Many Properties Do Investors Have?
 6.5 SMSF Property Investors
 6.6 First Time Buyers.
 6.7 Up Traders and Down Traders
 6.8 Auction Clearances Remain Quite Strong
 7 MORTGAGE UNDERWRITING STANDARDS
 7.1 ASIC Looks at Interest Only Loans
 7.2 APRA Lifts Capital
 7.3 APRA Lifts Underwriting Standards
 7.4 APRA to Regulate Non-Bank Lenders
 7.5 APRA Delays Mortgage Reporting Standards
 7.6 The Impact On Interest Only Loans
 7.7 Standards Are Tighter Now
 7.8 Risks Are Increasing; Standards Still Too Lose
 8 MORTGAGE PRICING
 8.1 It Pays to Haggle
 9 FINAL OBSERVATIONS
 10 ABOUT DFA
 11 COPYRIGHT AND TERMS OF USE

Request the free report [72 pages] using the form below. You should get confirmation your message was sent immediately and you will receive an email with the report attached after a short delay.

Note this will NOT automatically send you our ongoing research updates, for that register here.

[contact-form to=’mnorth@digitalfinanceanalytics.com’ subject=’Request for The Property Imperative Report 9′][contact-field label=’Name’ type=’name’ required=’1’/][contact-field label=’Email’ type=’email’ required=’1’/][contact-field label=’Email Me The Report’ type=’radio’ options=’Yes Please’ required=’1′ /][contact-field label=’Comment If You Like’ type=’textarea’/][/contact-form]

ANZ agrees to sell shareholding in Metrobank Card Corporation

ANZ has announced it has entered into an agreement with its joint venture partner Metropolitan Bank & Trust Company (Metrobank) regarding the sale of ANZ’s 40% stake in the Philippines based Metrobank Card Corporation (MCC).

More evidence of its “back to the knitting” strategy.

ANZ has agreed to sell half its 40% stake in MCC to Metrobank1, for US$144 million2 (A$184 million). ANZ has also entered into a put option to sell its remaining 20% stake to Metrobank, exercisable in the fourth quarter of FY18 on the same terms for the same consideration. If exercised, this would deliver a total sale price of US$288 million (A$368 million).

MCC is the leading provider of credit cards in the Philippines with more than 1.5 million cards in force. ANZ’s joint venture with Metrobank, which owns the remaining 60% of MCC, has been a successful financial and commercial transaction since it was formed in 2003:

  • ANZ’s original investment in MCC was A$14 million.
  • Since 2003, ANZ has recognised A$177 million of equity accounted earnings and received A$101 million in dividends.
  • MCC contributed A$34.5 million of equity accounted earnings to ANZ in FY16.
  • The sale of ANZ’s 40% stake (assuming the put option is exercised) represents:
    ‒ An implied P/B multiple of 4.4×4.
    ‒ An expected post-tax gain on sale of approximately A$245m5 and an increase in ANZ’s APRA CET1 capital ratio by 9 basis points in FY2018.
  • Excluding the gain on sale, the ROE and EPS impact to ANZ is broadly neutral.
  • The sale is subject to customary regulatory approvals. Payment for the initial 20% stake would occur post receipt of these approvals.

ANZ Deputy Chief Executive Officer Graham Hodges said: “This has been a highly successful joint venture for both ANZ and Metrobank creating the leading credit card company in the Philippines. The sale makes sense for ANZ given our continued efforts to simplify our business and is also a good outcome for MCC and its card customers given the strength of the business. ANZ remains committed to its institutional business in the Philippines.”

Why non-banks could be the new home for non-resident borrowers

From Mortgage Professional Australia.

Lenders eyeing up wealthy foreigners currently locked out of the banks and developing new processes to combat fraud

Non-resident lending could be set for a return as non-bank lenders become increasingly interested in the sector.

According to La Trobe Financial’s vice president Cory Bannister, “non-resident is a great example of a product that suits non-banks generally.” Speaking at MPA’s Non-Banks Roundtable last week, Bannister said that the low LVRs, low arrears and high net-worth associated with non-resident borrowers made them similar to prime clients.

The banks largely pulled out of non-bank lending in early 2016, citing fears of fraud. However, Bannister believes non-banks can operate safely: “we believe it requires manual assessment and that’s the single characteristic which meant the banks had to step out of that space.”

La Trobe, who have lent to non-residents on and off over the past year, have an international desk with bilingual staff which help ‘weed out’ fraudulent cases.

Growing niche in expat lending

Two other lenders at the panel were already lending to Australian expats: Better Mortgage Management and Homeloans Ltd.

Expats often struggle to find finance at the banks because they earn income abroad and in foreign currencies. BMM’s managing director Murray Cowan told the panel that “I think the expat sector may have been unfairly characterised as the same as non-residents and that might have created a bit of an opportunity for us there.”

Aaron Milburn, director of sales and distribution at Pepper Money, said that although Pepper doesn’t currently lend to non-residents “I wouldn’t discount it for the future.” He noted that Pepper’s international spread helped provide the infrastructure to do so.

Can non-banks handle non-residents?

Non-banks at the panel were concerned however that a return to non-resident lending could lead to a surge in business.

In fact, it could cause volumes to triple ‘overnight’, suggested Homeloans and RESIMAC general manager of third party distribution Daniel Carde. The panel broadly agreed that such a surge would be difficult to deal with. “No business is set up for triple volumes,” argued Liberty’s national sales manager John Mohnacheff “we can probably handle 5-10% variability”.

A note of caution was sounded by FirstMac founder Kim Cannon. “The RBA wants to stop [non-residents buying property]; they don’t want to cure it,” he told the panel. He warned that surge in non-residents getting financed by non-banks would be “treading on dangerous ground” with regulators.

What happened to home loan rates a year on from APRA’s changes

Our friends at Mozo have written a highly relevant blog post for DFA on the impact of the APRA changes.  No wonder, some households are under pressure! And thanks to Mozo for their insights!

There’s been a reasonable amount of ups and downs in home loan interest rates over the last 12 months, especially considering the official cash rate hasn’t changed since August last year. Many of those changes served to draw clear lines between borrower and repayments types, as banks aim to cut back on risky lending after APRA updated regulations earlier in the year. The changes included a 30% cap on new interest-only lending and a mandate for stricter limits on interest-only loans with LVRs above 80%.

And the different interest rate changes between borrowers types have been pretty dramatic. While at one end of the scale, owner-occupiers making principal and interest repayments saw hardly any change, on the other, riskier, end, investors with an interest-only loan – who perhaps saw the biggest changes thanks to APRA’s updated rules – have been hit by the equivalent of more than two typical RBA rate hikes.

Here’s a full breakdown of the movement in different rate types over the 12 months from October 2016 to today.

Owner occupiers making principal and interest repayments – 0.01% increase

People buying their own home and paying off the principal and interest each month have fared the best over the past year, with an increase of just 0.01%, bringing the average rate to just 4.03%.

That’s good news, since according to analysis done by ASIC, the majority of owner occupiers fall into this category. Even better news is that the lowest rate around at the moment for this borrower group is 3.54% – 0.10% higher than it was in October 2016, but still a very competitive offer.

This very minimal rate change over a 12 month period in part reflects the fact that this group is the least risky from a bank’s perspective. Unlike other rate types, there was a pretty even split between the number of lenders who increased rates (30) and those who decreased (33).

Owner occupiers making interest only repayments – 0.25% increase

According to ASIC, one in four owner occupiers have an interest only loan. Unlike loans with principal and interest repayments, in this category there was an undeniable trend toward rate increases, with 40 lenders raising rates, while just 5 lowered them over the 12 month period from October 2016. This points to the extra risk interest only repayments pose for banks.

Borrowers in this category have been hit by an average rate increase of 0.25%, equal to a typical RBA rate hike. The average interest rate went from 4.15% in October 2016, to 4.40% today.

On a $500,000 home loan that change equates to $1,250 of extra interest per year.

Investors making principal and interest repayments – 0.27% increase

Investors are often hit harder by rate increases, and with APRA regulations tightening around new lending to ‘riskier’ borrower types, this year has been no different.

Rates rises for investors making principal and interest repayments were more or less on par with owner occupiers on an interest only loan, with an increase of 0.27%, to 4.61%. That change meant an extra $1,350 in interest over a year long period for those is this rate category.

This is a bit more than the equivalent of a Reserve Bank rate rise, reflecting the level of risk lenders see in investment lending. Again, there was a trend toward increases by lenders (53) rather than decreases (8).

Investors making interest only repayments – 0.53% increase

Where investors making principal and interest repayments saw a little over the equivalent of one typical RBA rate rise in the last 12 months, rates for interest only investor loans went up by an average of 0.53% – or more than two times an RBA rate rise.

There was an overwhelming trend towards lenders increasing instead of decreasing rates in this category as well, with just 1 lowering rates, while 45 hiked.

That brought the average rate from 4.39% in 2016 to 4.92% this year, a change that meant a whopping $2,650 of extra interest paid on average. Not only is this rate increase bigger than that for other borrower types by a pretty large margin, but it also likely affected more people, considering ASIC data found two in three investment borrowers have an interest only loan.

What this means

While the banks have the prerogative to protect themselves against riskier lending by imposing higher premiums, overall I’d argue that the rate changes over the past year have potentially had a negative effect on the wider economy.

Most borrower categories saw rate increases equivalent to one or more Reserve Bank hikes, which can have a significant impact on household budgets – and the economy overall. As more money goes toward home loan repayments and borrowers brace for more rate hikes to come, consumer confidence drops, and the economy starts to stall.

And that’s bad news for everyone, risky home loan or not.

About the Author: After starting his career working for the banks, Peter Marshall has spent the last 15 years helping consumers compare financial products. At Mozo he manages the Data Team which keeps track of banking, insurance and energy products in Australia.

Mortgage Arrears Ease A Little In August – S&P

From Business Insider.

According to ratings agency Standard and Poor’s (S&P), the percentage of delinquent housing loans contained in Australian prime residential mortgage-backed securities (RMBS) fell to just 1.10% in August from 1.17% in July.

S&P said arrears decreased in all states and territories except the Australian Capital Territory (ACT) over the month, with noticeable improvements in Australia’s mining states and territories.

“The Northern Territory (NT) recorded the largest improvement, with arrears declining to 1.63% from 1.98% a month earlier,” S&P said. “In Western Australia, arrears fell to 2.22% in August from a historic high of 2.38% in July.”

The improvement may reflect an improvement in economic conditions in those locations following recent increases in commodity prices, along with a pickup in employment levels.

Improvement was also seen in Australia’s most populous states, where most Australian home loans are domiciled.

“The more populous states of New South Wales, Victoria, and Queensland, where around 80% of loan exposures are domiciled, recorded an improvement in arrears in August,” the agency said.

Despite the small increase in the ACT, at 0.63%, arrears still remained at the lowest level across the country.

The broad improvement in home loan arrears over the month can be seen in the map below from S&P.

Source: Standard & Poor’s


And this chart and table shows the level of arrears by delinquency duration.

Source: Standard & Poor’s


S&P says that “relatively stable employment conditions and low interest rates continue to underpin the low levels of arrears for most Australian RMBS transactions”, adding that it believes “lending standards generally have tightened in many areas since attracting greater regulatory scrutiny beginning in 2015.”

Looking ahead, the ratings agency says that while the prospect of higher mortgage rates could lead to an increase in arrears, particularly among those with high loan-to-value ratios, stronger labour market conditions should keep any potential in check.

“Provided employment conditions remain relatively stable, however, we do not anticipate arrears materially increasing above current levels in the next 12 months,” S&P says.

“Some loans underwritten before 2015 could be more susceptible to higher arrears, particularly interest-only loans with higher loan-to-value (LTV) ratios for which no equity has built up during the interest-only period, in our opinion.”

Basel III Implementation Status In Australia

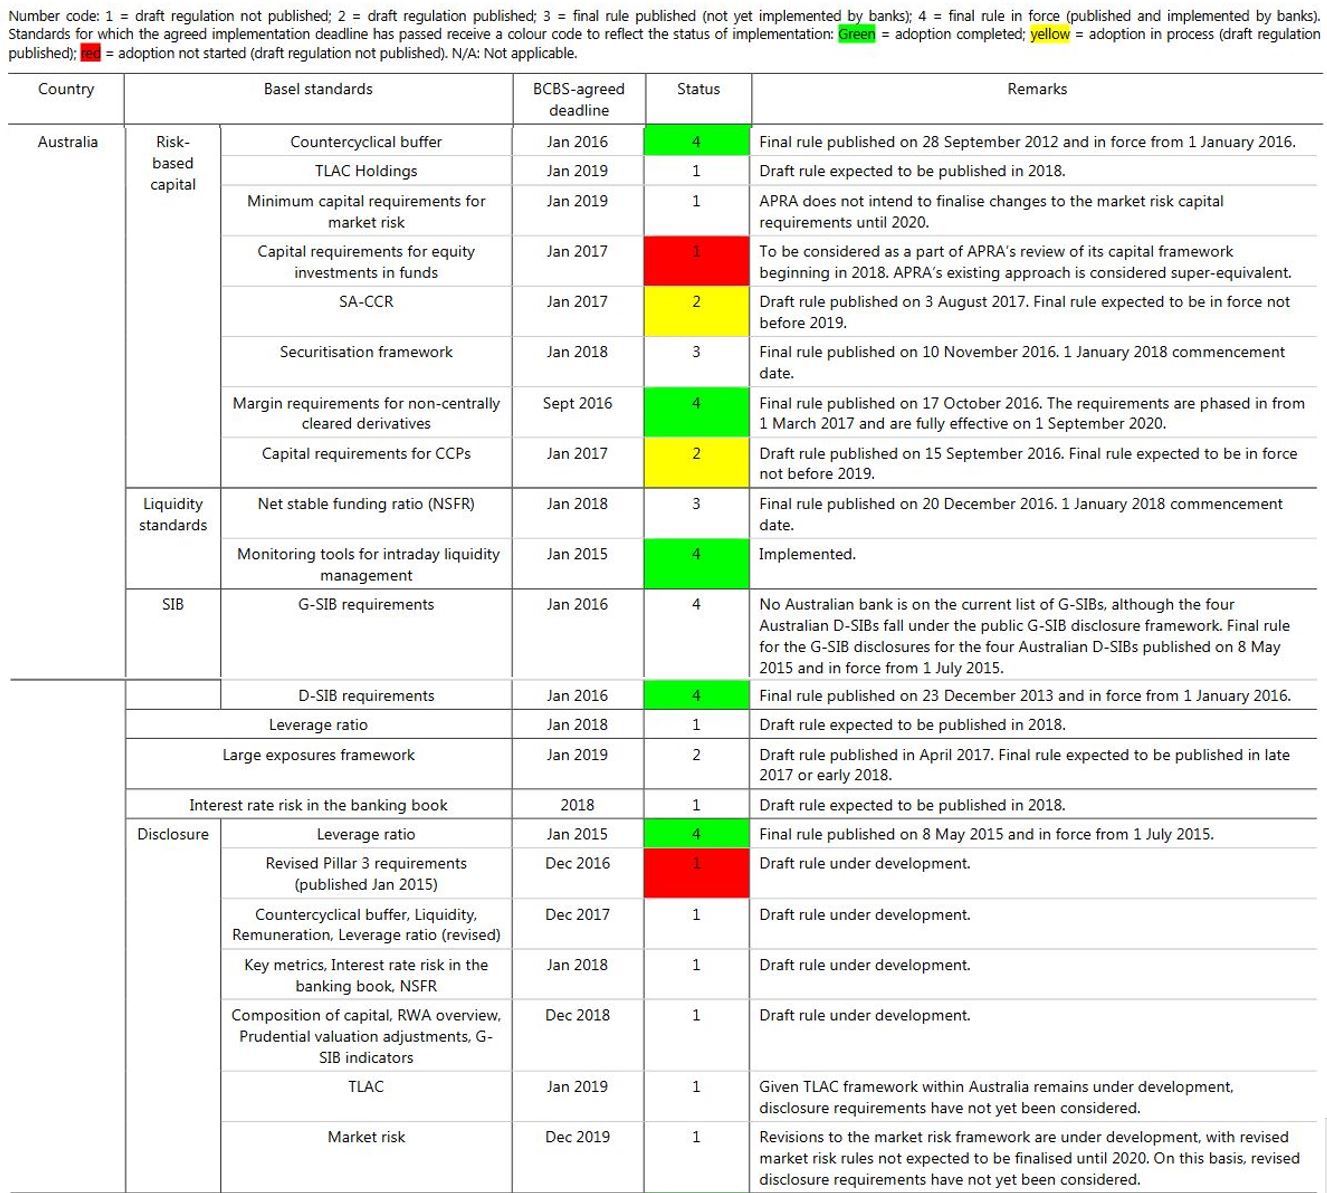
The Basel Committee published its latest status report on Basel III implementation to end-September 2017 – the 13th progress report. This includes a status report on Australia:

There are areas (in red) where the deadline has passed, and as yet plans are not announced. Many other countries have red marks, but it is worth noting the Euro area is ahead of many other regions. Disclose is a major gap in Australia according to the committee.

APRA provided comments on the status.

It also, once again, highlights the complexity in the Basel framework. Here the overall Basel Committee statement summary.

As of end-September 2017, all 27 member jurisdictions have final risk-based capital rules, LCR regulations and capital conservation buffers in force. 26 member jurisdictions have issued final rules for the countercyclical capital buffers and for domestic systemically important banks (D-SIBs) frameworks.

With regard to the global systemically important banks (G-SIBs) framework, all members that are home jurisdictions to G-SIBs have final rules in force. 21 member jurisdictions have issued final or draft rules for margin requirements for non-centrally cleared derivatives and 22 have issued final or draft rules for monitoring tools for intraday liquidity management.

With respect to the standards whose agreed implementation date passed at the start of 2017, 20 member jurisdictions have issued final or draft rules of the revised Pillar 3 framework (as published in January 2015, ie at the end of the first phase of review), 19 have issued final or draft rules of the standardised approach for measuring counterparty credit risk (SA-CCR) and capital requirements for equity investments in funds, and 18 have issued final or draft rules of capital requirements for bank exposures to central counterparties (CCPs).

Members are now striving to implement other Basel III standards. While some members reported challenges in doing so, overall progress is observed since the previous progress report (as of end-March 2017) in the implementation of the interest rate risk in the banking book (IRRBB), the net stable funding ratio (NSFR), and the large exposures framework. Members are also working on or turning to the implementation of TLAC holdings, the revised market risk framework, and the leverage ratio. The Committee will keep on monitoring closely the implementation of these standards so as to keep the momentum in implementing the comprehensive set of the Committee’s post-crisis reforms.

Regarding the consistency of regulatory implementation, the Committee has published its assessment reports on all 27 members regarding their implementation of Basel risk-based capital and LCR standards.

How Much Can Mortgage Holders Really Save By Refinancing?

We showed recently that households with specific post codes may have significantly higher mortgage rates than their neighbours. As a result, significant savings may be made by seeking out a mortgage with a better rate.

Of course households need to be careful, as they may incur transaction costs, and even break costs if the loan is fixed.

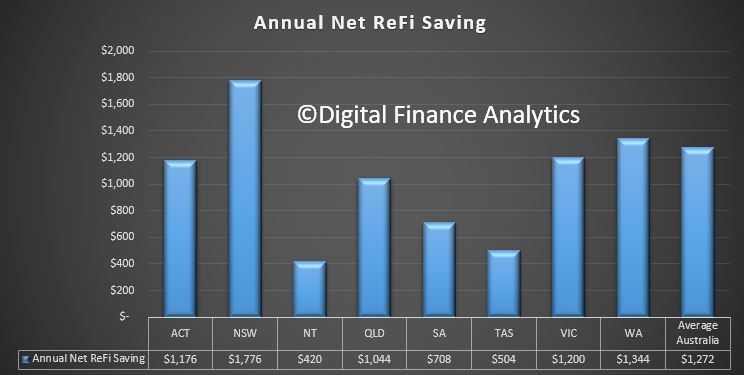
But we went though our Core Market Model looking at those who refinanced in the past year. We then calculated the annual savings they had, on average achieved. Here are the results:

The larger the loan, the bigger the potential saving, which is why there are state variations. There were quite big differences between the old rate and new rates, and we incorporated break costs where appropriate.

This again highlights that households should be checking their rates and seeking out better, lower rates. Substantial savings are available, and when we consider the average loan life is more than 5 years, the potential savings are significant.