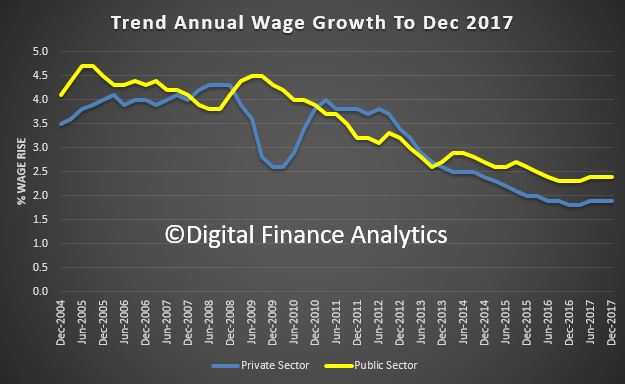
The ABS released their wage price data today for the December 2017 Quarter. You can clearly see the gap between trend public and private sector rates, with the private sector sitting at 1.9% and public sector 2.4%. The CPI was 1.9% in December, so no real growth for more than half of all households! Hardly stellar…
The seasonally adjusted Wage Price Index (WPI) rose 0.6 per cent in December quarter 2017 according to figures released today by the Australian Bureau of Statistics (ABS).
The WPI rose 2.1 per cent through the year seasonally adjusted to December quarter 2017.
ABS Chief Economist Bruce Hockman said “The annual rate of wage growth has increased for the second consecutive quarter reflecting falling unemployment and underemployment rates, and increasing job vacancy levels.”
Seasonally adjusted, private sector wages rose 1.9 per cent and public sector wages grew 2.4 per cent through the year to December quarter 2017.
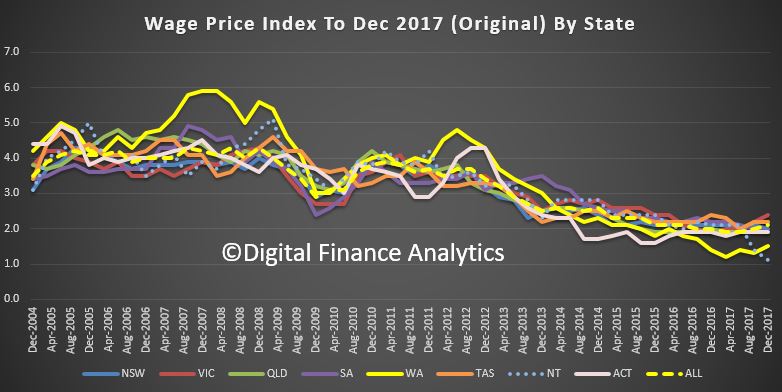
In original terms, through the year wage growth to the December quarter 2017 ranged from 1.4 per cent for the Mining industry to 2.8 per cent for the Health care and social assistance industry.
Victoria was the highest through the year wage growth of 2.4 per cent and The Northern Territory recorded the lowest of 1.1 per cent.
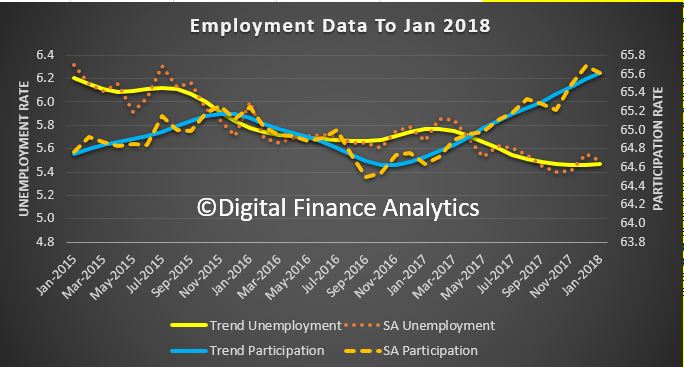
The ABS released the January 2018 employment data which shows that the trend unemployment remained steady at 5.5 per cent, where it has hovered for the past seven months.
The ABS says that full-time employment grew by a further 9,000 persons in January, while part-time employment increased by 14,000 persons, underpinning a total increase in employment of 23,000 persons.
Full-time employment has now increased by around 292,000 since January 2017 and makes up the majority of the 395,000 net increase in employment over the period. In line with the increasing female participation in the labour force, female full-time employment accounted for 55 per cent of the full-time employment growth over the past year.
Over the past year, trend employment increased by 3.3 per cent, which is above the average year-on-year growth over the past 20 years (1.9 per cent). Prior to the past two months, the last time it was 3.3 per cent or higher was back in February 2008, before the Global Financial Crisis. The trend monthly hours worked decreased slightly, by 1.2 million hours (0.1 per cent), with the annual figure continuing to show strong growth (2.7 per cent).
The trend unemployment rate has fallen by 0.3 percentage points over the year but has been at approximately the same level for the past seven months, after the December 2017 figure was revised upward to 5.5 per cent.
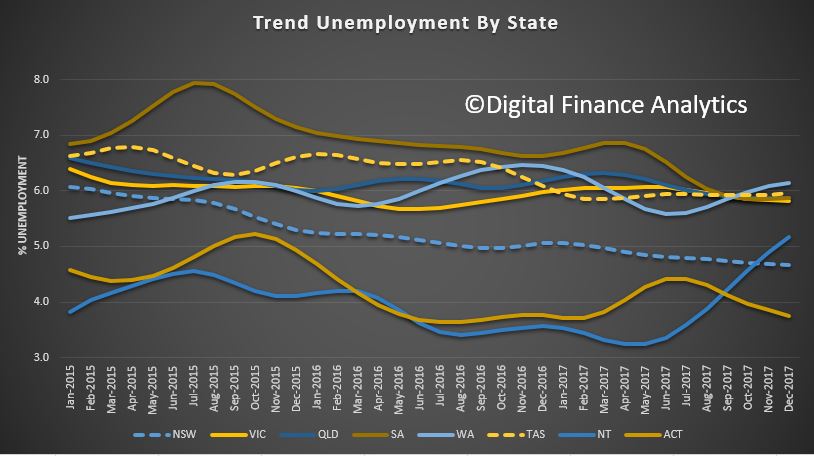
Over the past year, the states and territories with the strongest annual growth in trend employment were the ACT (4.8 per cent) Queensland (4.7 per cent) and New South Wales (3.6 per cent).
All states and territories recorded a decrease in their trend unemployment rates, except the Northern Territory and the ACT (which increased 1.1 and 0.3 percentage points respectively).
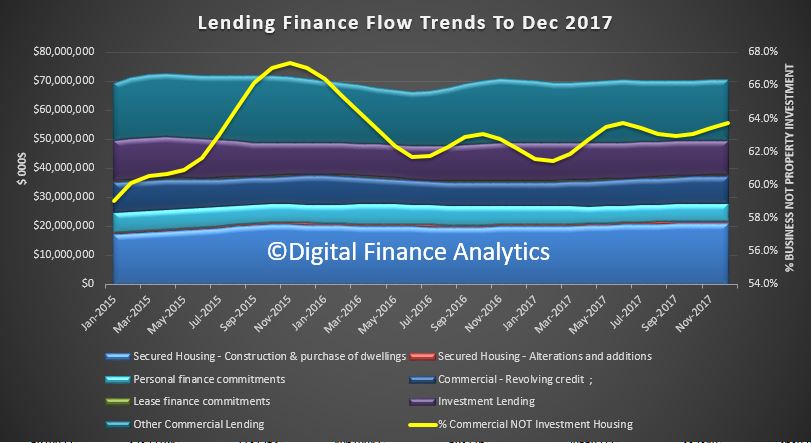
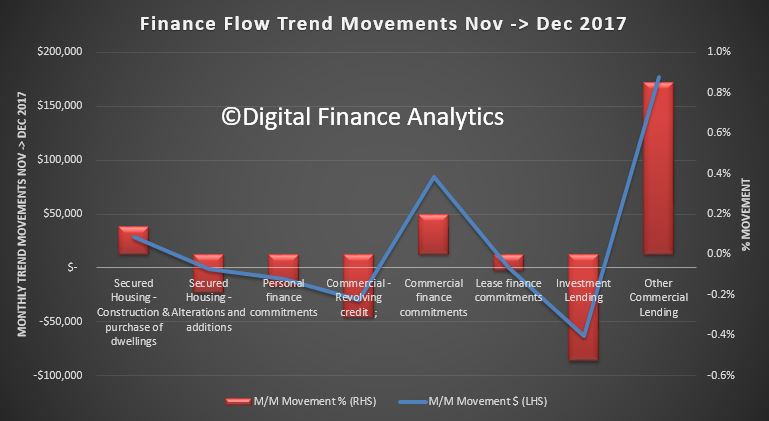
The final release from the ABS on Lending Finance to December 2017 really underscores the slowing momentum in investment property lending, especially in Sydney (though it is still a significant slug of new finance, and there is no justification to ease the current regulatory requirements.)
The ABS says the total value of owner occupied housing commitments excluding alterations and additions rose 0.1% in trend terms, total personal finance commitments fell 0.2%. Revolving credit commitments fell 1.4%, while fixed lending commitments rose 0.5%.
The trend series for the value of total commercial finance commitments rose 0.2%. Fixed lending commitments rose 0.3%, while revolving credit commitments fell 0.3%.
The trend series for the value of total lease finance commitments fell 0.1% in December 2017 and the seasonally adjusted series rose 8.3%, after a fall of 7.6% in November 2017.
The mix of commercial lending tilted away from investment lending and towards other commercial purposes at 64%.
This is demonstrated by the monthly changes in flows, as shown below, with a 0.8% rise in other commercial lending, and a 0.5% fall in investment housing lending.
There was a small rise in lending for housing construction, but overall mortgage momentum looks like it is still slowing.
The ABS notes:
A new publication will soon be released which will see Housing Finance, Australia (5609.0) and Lending Finance, Australia (5671.0) combined into a single, simpler publication called Lending to Households and Businesses, Australia (5601.0).
To enable users to prepare for the new publication, tables of data in the new publication format will be released no less than one month prior to the first release of Lending to Households and Businesses, Australia (5601.0).
REVISIONS
In this issue, revisions have been made to the original series as a result of improved reporting of survey and administrative data. These revisions have affected the following series:
Commercial Finance for the periods September 2017 and October 2017.
Personal Finance for the period November 2017.
Investment housing finance for the period October 2017.
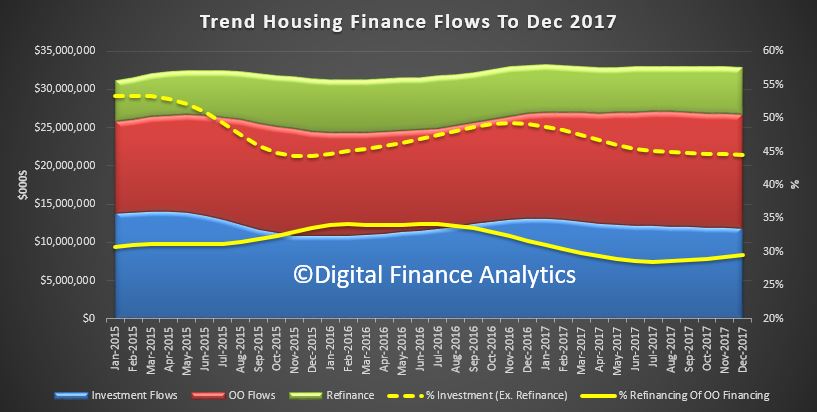
In trend terms, the total value of dwelling finance commitments excluding alterations and additions fell 0.1% or $31 million. Owner occupied housing commitments rose 0.1% while investment housing commitments fell 0.5%.
Owner occupied flows were worth $14.8 billion, and down 0.3% last month, while owner occupied refinancing was was $6.2 billion, up 1.2% or $73 million. Investment flows were worth 11.9 billion, and fell 0.5% or $62 million. The percentage of loans for investment, excluding refinancing was 45%, down from 49% in Dec 2016. Refinancing was 29.5% of OO transactions, up from 29.2% last month.
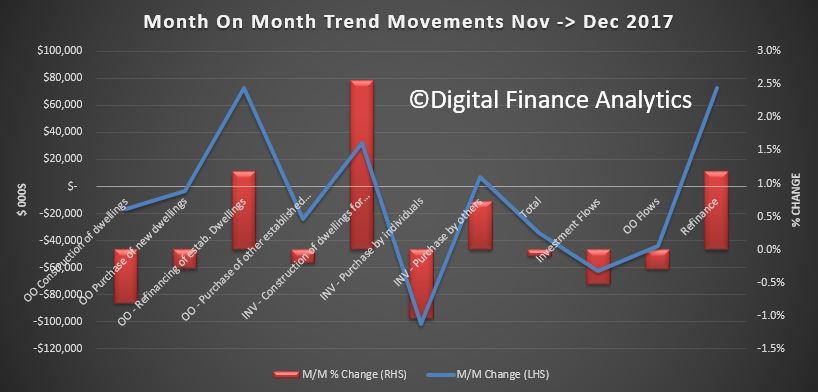
The number of commitments for owner occupied housing finance fell 0.3% in December 2017.
The number of commitments for the construction of dwellings fell 0.8%, the number of commitments for the purchase of established dwellings fell 0.3% and the number of commitments for the purchase of new dwellings fell 0.1%.
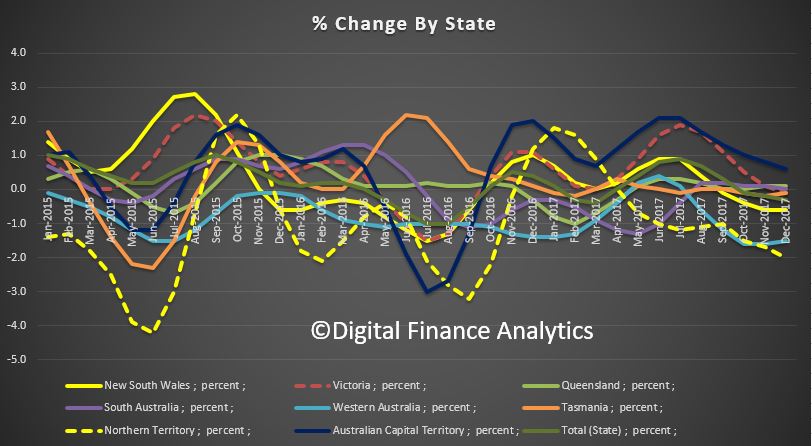
Momentum fell in NSW and VIC, the two major states.
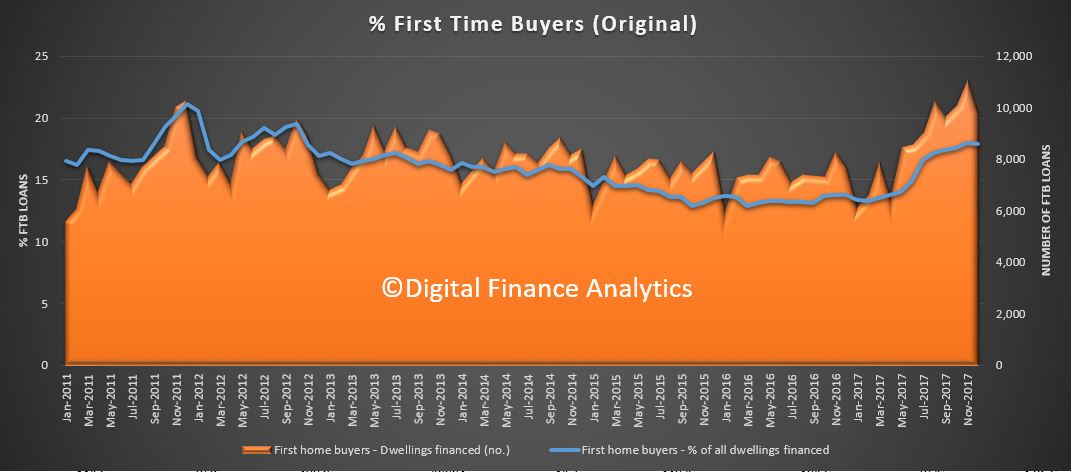
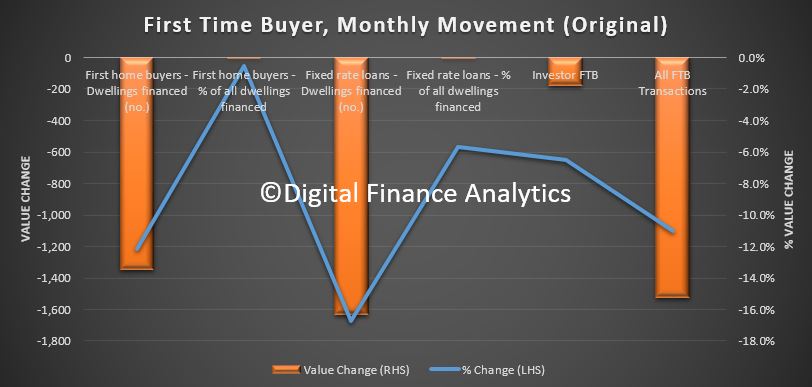
In original terms, the number of first home buyer commitments as a percentage of total owner occupied housing finance commitments fell to 17.9% in December 2017 from 18.0% in November 2017.
The number of transactions fell by 1,300 compared with last month. The proportion of fixed rate loans also fell.
We also saw a fall in first time buyer investors, from our own surveys.
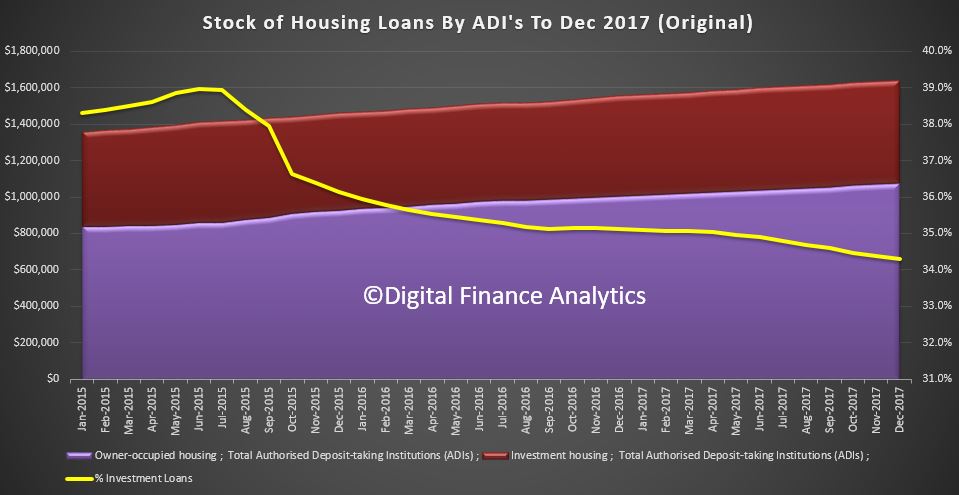
In original terms the stock of housing loans with ADI’s rose 0.5% in the month to $1.68 trillion. 34.3% of loans are for property investment purposes.
The ABS pointed out that the First Time Buyer data is under review, and new housing datasets are on their way.
The number of loans to first home buyers has recorded strong growth in recent months. The increase has been driven mainly by changes to first home buyer incentives made in July by the New South Wales and Victorian governments. The ABS is working with APRA and the financial institutions to establish the size of the increase in first home buyer lending in recent months and improve the quality of first home buyer statistics more broadly. These numbers may be revised and users should take care when interpreting recent ABS first home buyer statistics.
FORTHCOMING CHANGES
A new publication will soon be released which will see Housing Finance, Australia (5609.0) and Lending Finance, Australia (5671.0) combined into a single, simpler publication called Lending to Households and Businesses, Australia (5601.0).
To enable users to prepare for the new publication, tables of data in the new publication format will be released no less than one month prior to the first release of Lending to Households and Businesses, Australia (5601.0).
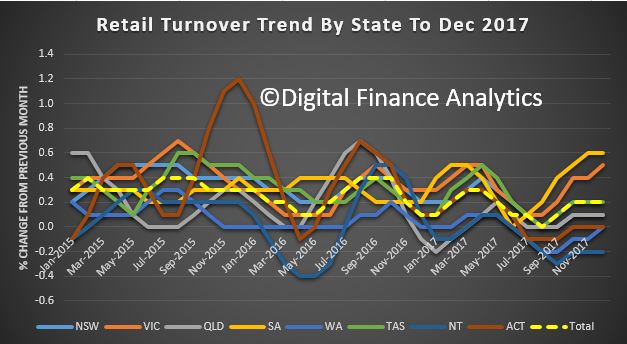
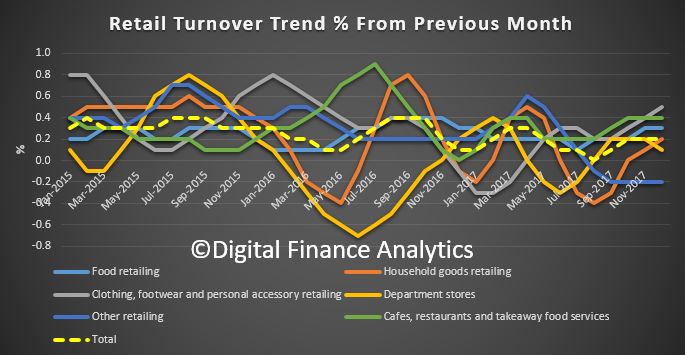
Australian retail turnover fell 0.5 per cent in December 2017, seasonally adjusted, according to the latest Australian Bureau of Statistics (ABS) Retail Trade figures. This follows a 1.3 per cent rise in November 2017.
This is the headline which will get all the coverage, but the trend estimate rose 0.2 per cent in December 2017 following a rise of 0.2 per cent in November 2017. Compared to December 2016 the trend estimate rose 2.0 per cent. This is in line with average income growth.
We will continue to focus on the trend data, as this gives a clearer indication of underlying performance. Retail remains in the doldrums, no surprise given the pressure on households, as we discussed yesterday.
Across the states, trend movements from the previous month was 0.1% in NSW, 0.5% in VIC, 0.1% in QLD, 0.6% in SA, 0.0% in WA, 0.2% in TAS, -0.2% in NT and no change in the ACT.
By category, in trend terms, food retailing rose 0.3%, household goods 0.2%, Clothing, footwear and personal accessories 0.5%, department stores 0.1%, other retailing -0.2% and cafes, restaurants and takeaway food 0.4%.
Online retail turnover contributed 4.8 per cent to total retail turnover in original terms in the December month 2017. In December 2016 online retail turnover contributed 3.8 per cent to total retail.
In seasonally adjusted volume terms, turnover rose 0.9 per cent in the December quarter 2017, following a rise of 0.1 per cent in the September quarter 2017. The rise in volumes was led by household goods (3.4 per cent), which benefitted from strong promotions and the release of the iPhone X in the November month.
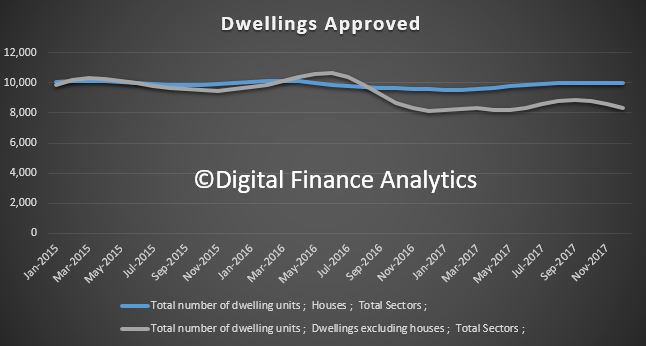
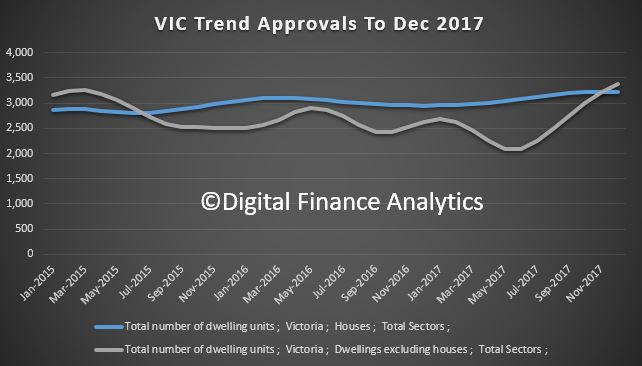
The number of dwellings approved fell 1.7 per cent in December 2017, in trend terms, and has fallen for three months.
Approvals for private sector houses have remained stable, with just under 10,000 houses approved in December 2017, but the fall was in apartments.
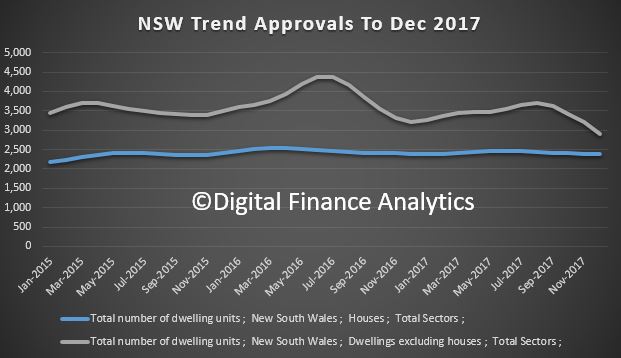
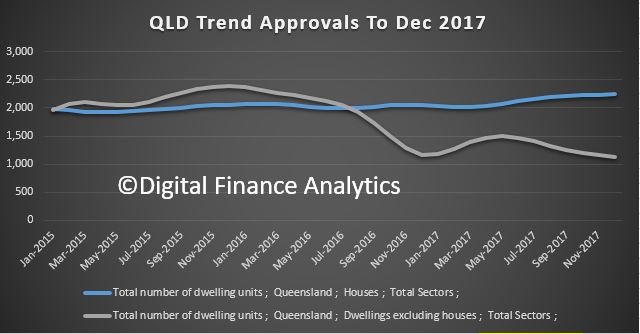
In trend terms, approvals for private sector houses fell 0.2 per cent in December. Private sector house approvals fell in South Australia (1.5 per cent), Western Australia (0.9 per cent) and New South Wales (0.2 per cent) but rose in Queensland (0.4 per cent). Private house approvals were flat in Victoria. But it is the trends in unit approvals which show the most significant variations.
NSW is leading the way down from a high in May 2016.
QLD continues to slow, from a peak in November 2015.
WA is moving up, just a little, from a low in May 2017.
VIC is bucking the trend, with a significant rise since May 2017, but we wonder for how long, as supply is already taking the heat out of new unit sales.
The value of total building approved fell 0.3 per cent in December, in trend terms, after rising for 11 months. The value of residential building fell 0.2 per cent while non-residential building fell 0.4 per cent.
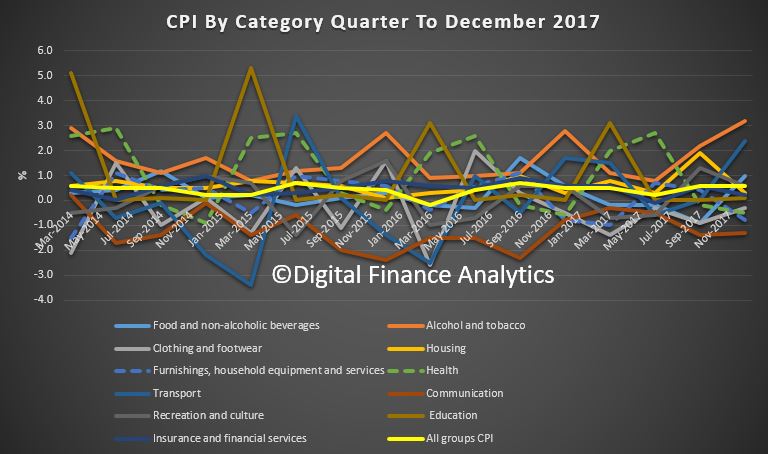
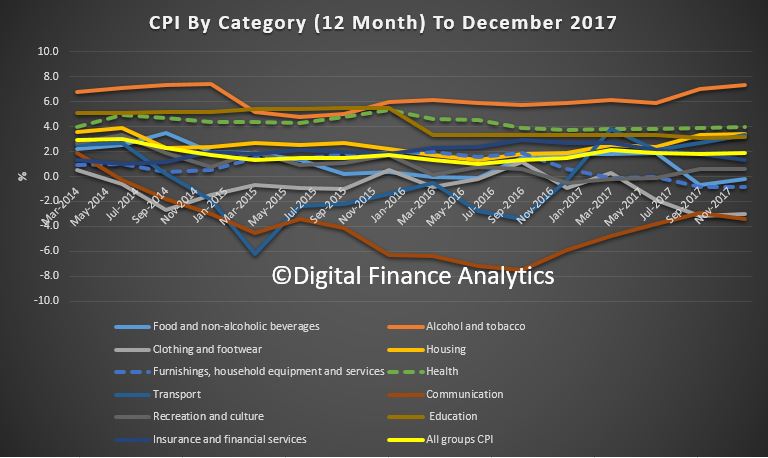
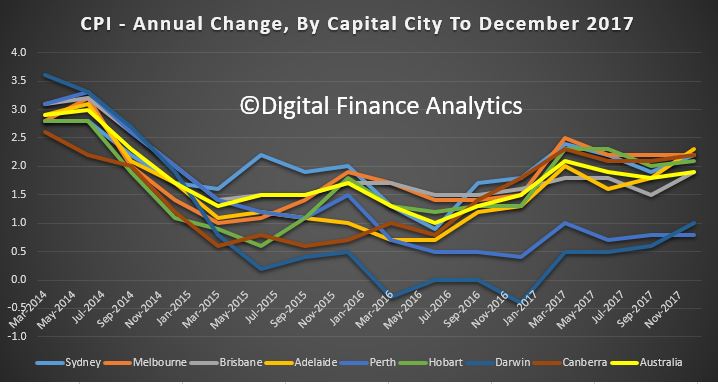
The Consumer Price Index (CPI) rose 0.6 per cent in the December quarter 2017, the latest Australian Bureau of Statistics (ABS) figures reveal. Annual inflation in most East Coast cities rose above 2.0 per cent, due in part to the strength in prices related to Housing.
This follows a rise of 0.6 per cent in the September quarter 2017. However, there were some changes in methodology which may have impacted the results.
The most significant price rises this quarter are automotive fuel (+10.4%), tobacco (+8.5%), domestic holiday travel and accommodation (+6.3%) and fruit (+9.3%). These price rises were partially offset by falls in international holiday travel and accommodation (-1.7%), audio visual and computing equipment (-3.5%) and telecommunication equipment and services (-1.4%).
The CPI rose 1.9 per cent through the year to December quarter 2017 having increased 1.8 per cent through the year to September quarter 2017.
Chief Economist for the ABS, Bruce Hockman, said “While the annual CPI rose 1.9 per cent, annual inflation in most East Coast cities rose above 2.0 per cent, due in part to the strength in prices related to Housing. Softer economic conditions in Darwin and Perth have resulted in annual inflation remaining subdued at 1.0 and 0.8 per cent respectively.”
The ABS periodically reviews the CPI expenditure weights to ensure they are representative of household spending patterns on goods and services. This quarter the ABS has introduced new expenditure weights based on information sourced from the ABS Household Expenditure Survey.
In addition, this quarter the ABS has also implemented methodological changes to maximise the use of transactions data to compile the CPI. Implementation follows a period of extensive research and expert peer review, including from Professor Kevin Fox of UNSW Sydney. Professor Fox said “I strongly support the ABS decision to implement new CPI methods for the treatment of transactions data. The ABS has made a convincing case for implementation following an extended period of research. These new methods will enhance the accuracy of the Australian CPI, provide additional analytics and better inform policy formulation.”
Lenders are facing a dilemma, do they chase mortgage lending growth, and embed more risks into their portfolios, or accept the consequences of lower growth and returns as household debt explodes and we join the 200% Club!
Welcome to the Property Imperative weekly to 20 January 2018. We offer two versions of the update, the first a free form summary edition in response to requests from members of our community:
Alternatively, you can watch our more detailed version, with lots of numbers and charts, which some may find overwhelming, but was the original intent of the DFA Blog – getting behind the numbers.
Tell us which you prefer. You can watch the video, or read the transcript.
In our latest digest of finance and property news, we start with news from the ABS who revised housing debt upward, to include mortgage borrowing within Superannuation, so total Household Liabilities have been increased by approximately 3% to $2,466bn. The change, which required the accurate measurement of property investment by self-managed superannuation funds, brought the figure up from 194 per cent so we are now at 200% of income. A record which no-one should be proud of. It also again highlights the risks in the system. Australian households are in the 200% club.
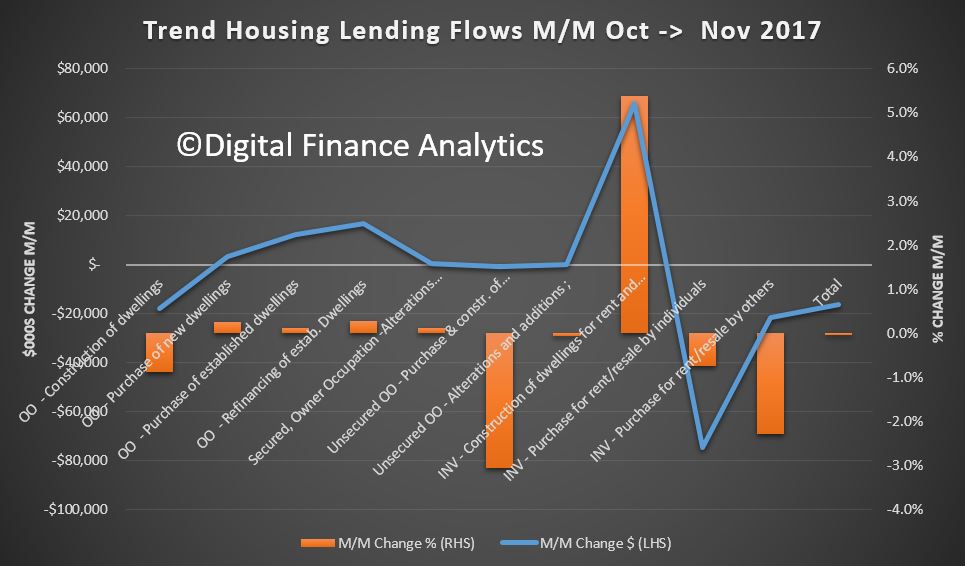
The final set of data from the ABS – Lending Finance to November 2017 which also highlights again the changes underway in the property sector. Within the housing series, owner occupied lending for construction fell 0.88% compared with the previous month, down $17m; lending for the purchase of new dwellings rose 0.25%, up $3m; and loans for purchase of existing dwellings rose 0.11%, up $12m.
Refinance of existing owner occupied dwellings rose 0.28%, up $16m.
Looking at investors, borrowing for new investment construction rose 5%, up $65m; while purchase of existing property by investors fell $74m for individuals, down 0.75%; and for other investors, down $21m or 2.28%.
Overall there was a fall of $16m across all categories.
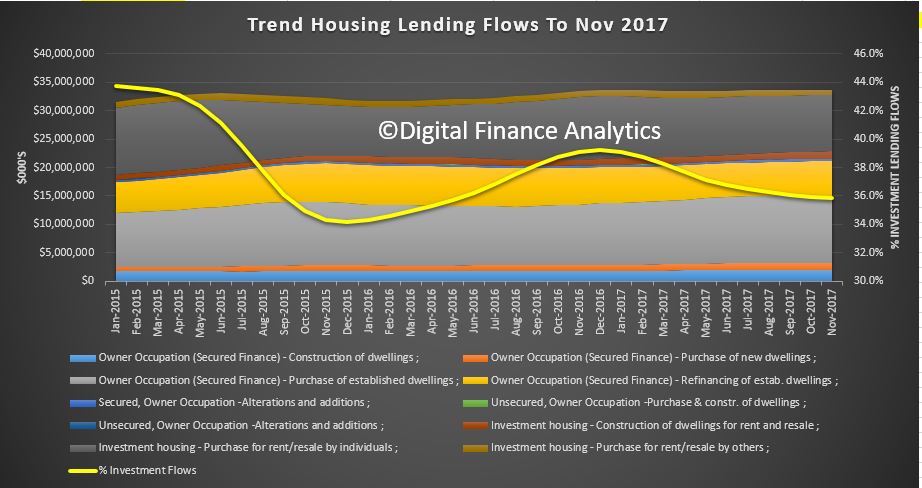
We see a fall in investment lending overall, but it is still 36% of new lending flows, so hardly a startling decline. Those calling for weakening of credit lending rules to support home price growth would do well to reflect that 36% is a big number – double that identified as risky by the Bank of England, who became twitchy at 16%!
Looking then across all lending categories, personal fixed credit (personal loans rose $70m, up 1.74%; while revolving credit (credit cards) fell $4m down 0.18%. Fixed commercial lending, other than for property investment rose $231m or 1.12%; while lending for investment purposes fell 0.25% or $30m. The share of fixed business lending for housing investment fell to 36.7% of business lending flows, compared with 41% in 2015. Revolving business credit rose $6m up 0.06%.
A highlight was the rise in first time buyer owner occupied loans, up by around 1,030 on the prior month, as buyers reacted to the incentives available, and attractor rates. This equates to 18% of all transactions. Non-first time buyers fell 0.5%. The average first time buyer loan rose again to $327,000, up 1% from last month. We do not think the data gives any support for the notion that regulators should loosen the lending rules, as some are suggesting. That said the “incentives” for first time buyers are having an effect – in essence, persuading people to buy in at the top, even as prices slide. I think people should be really careful, as the increased incentives are there to try and keep the balloon in the air for longer.
So, what can we conclude? Investment lending momentum is on the turn, though there is still lots of action in the funding of new property construction for investment – mostly in the high rise blocks around our major centres. But in fact momentum appears to be slowing in Brisbane, Sydney and Melbourne. This does not bode well for the construction sector in 2018, as we posit a fall in residential development, only partly offset by a rise in commercial and engineering construction (much of which is state and federal funded). What I’m noticing is that those in the construction sector – from small builders to sub-contractors – have significantly lower confidence levels than they did six months ago, based on our surveys.
Whilst lending to first time buyers is up, there are risks attached to this, as we will discuss later.
The good news is lending to business, other than for housing investment is rising a little, but businesses are still looking to hold costs down, and borrow carefully. This means economic growth will be slow, and potential wages growth will remain contained.
Fitch Ratings says Australian banks’ profit growth is likely to slow in 2018 as global monetary tightening pushes up funding costs, loan-impairment charges rise, and tighter regulation has an impact on business volumes and compliance costs from the 15 or so inquiries or reviews across the sector (according to UBS). They say Australian banks are more reliant on offshore wholesale funding than global peers, as the superannuation scheme here has created a lack of domestic customer deposits. Global monetary tightening could therefore push up banks’ funding costs. Indeed, The 10-Year US Bond yield is moving higher, and whilst the US Mortgage rates were only moderately higher today, the move was enough to officially bring them to the highest levels since the (Northern) Spring of 2017.
The main risks to banks’ performance stem from high property prices and household debt. Australian banks are more highly exposed to residential mortgages than international peers, while households could be sensitive to an eventual increase in interest rates or a rise in unemployment, given that their debt is nearly 200% of disposable income. Indeed, Tribeca Investment Partners said this week that local equities may be hurt by troughs in the domestic property market. “A heavily indebted household sector that is experiencing flat to negative real income growth, as well as dealing with higher energy and healthcare costs, and which has drawn down its savings rate, is unlikely to fill the gap in growth”
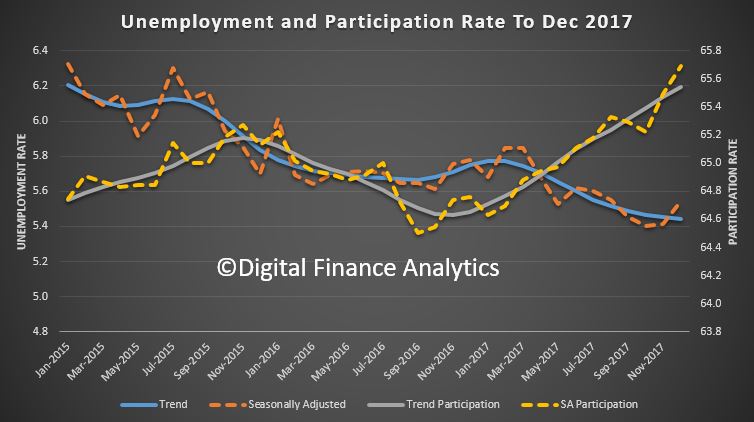
In local economic news, the latest ABS data on employment to December 2017, shows the trend unemployment rate decreased slightly to 5.4 per cent in December 2017, after the November 2017 figure was revised up to 5.5 per cent. The trend unemployment rate was 0.3 percentage points lower than a year ago, and is at its lowest point since January 2013.
The seasonally adjusted number of persons employed increased by 35,000 in December 2017. The seasonally adjusted unemployment rate increased by 0.1 percentage points to 5.5 per cent and the labour force participation rate increased to 65.7 per cent. The number of hours worked fell. By state, trend employment rose in NT, WA and SA. Over the past year, all states and territories recorded a decrease in their trend unemployment rates, except the Northern Territory (which increased 1.6 percentage points). The states and territories with the strongest annual growth in trend employment were Queensland and the ACT (both 4.6 per cent), followed by New South Wales (3.5 per cent).
The ABA released new research – The Edelman Intelligence research conducted late last year which tracks community trust and confidence in banks. Whilst progress may be being made, the research shows Australian banks are behind the global benchmark in terms of trust. Based on the Annual Edelman Trust Barometer study released in January 2017, Australia remains 4 points behind the global average.
The Australian Financial Review featured some of our recent research on the problem of refinancing interest only loans (IO). Many IO loan holders simply assume they can roll their loan on the same terms when it comes up for periodic review. Many will get a nasty surprise thanks to now tighter lending standards, and higher interest rates. Others may not even realise they have an IO loan!
Thousands of home owners face a looming financial crunch as $60 billion of interest-only loans written at the height of the property boom reset at higher rates and terms, over the next four years.
Monthly repayments on a typical $1 million mortgage could increase by more than 50 per cent as borrowers start repaying the principal on their loans, stretching budgets and increasing the risk of financial distress.
DFA analysis shows that over the next few years a considerable number of interest only loans (IO) which come up for review, will fail current underwriting standards. So households will be forced to switch to more expensive P&I loans, assuming they find a lender, or even sell. The same drama played out in the UK a couple of years ago when they brought in tighter restrictions on IO loans. The value of loans is significant. And may be understated.
We also featured research on the Bank of Mum and Dad, now a “Top 10” Lender in Australia. Our analysis shows that the number and value of loans made to First Time Buyers by the “Bank of Mum and Dad” has increased, to a total estimated at more than $20 billion, which places it among the top 10 mortgage lenders in Australia. Savings for a deposit is very difficult, at a time when many lenders are requiring a larger deposit as loan to value rules are tightened. The rise of the important of the Bank of Mum and Dad is a response to rising home prices, against flat incomes, and the equity growth which those already in the market have enjoyed. This enables an inter-generational cash switch, which those fortunate First Time Buyers with wealthy parents can enjoy. In turn, this enables them also to gain from the more generous First Home Owner Grants which are also available. Those who do not have wealthy parents are at a significant disadvantage. Whilst help comes in a number of ways, from a loan to a gift, or ongoing help with mortgage repayments or other expenses, where a cash injection is involved, the average is around $88,000. It does vary across the states. But overall, around 55% of First Time Buyers are getting assistance from parents, with around 23,000 in the last quarter.
There was also research this week LF Economics which showed that some major lenders are willing to accept a 20% “Deposit” for a mortgage from the equity in an existing property, and in so doing, avoided the need for expensive Lenders Mortgage Insurance.
Both arrangements are essentially cross leveraging property from existing equity, and is risky behaviour in a potentially falling market. More evidence of the lengths banks are willing to go to, to keep their mortgage books growing. We think these portfolio risks are not adequately understood.
So, we conclude that banks are caught between trying to grow their books, in a fading market, by offering cheap rates to target new borrowers, and accept equity from existing properties, thus piling on the risk; while dealing with rising overseas funding, and in a flat income environment, facing heightened risks from borrowers as they join the 200% club.
That’s the Property Imperative Weekly to 20 January 2018. If you found this useful, do leave a comment, subscribe to receive future updates and check back for our latest posts. Many thanks for watching.
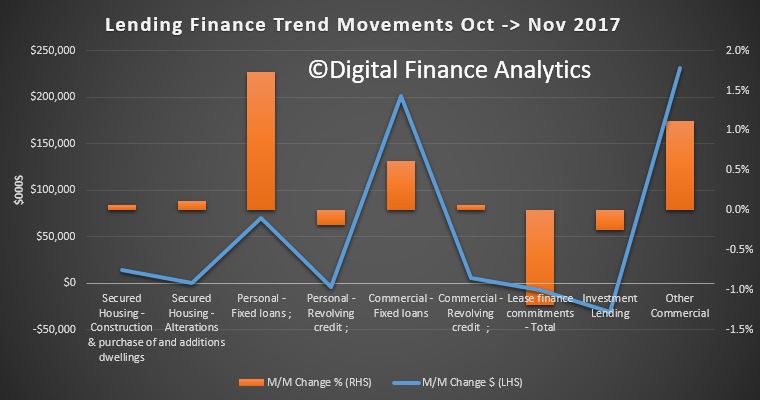
The final set of data from the ABS – Lending Finance to November 2017 highlights again the changes underway in the property sector. They also contain some revisions from last month. As normal we will focus on the trend series, which smooths some of the monthly changes.
Within the housing series, owner occupied lending for construction fell 0.88% compared with the previous month, down $17m; lending for the purchase of new dwellings rose 0.25%, up $3m; and loans for purchase of existing dwellings rose 0.11%, up $12m.
Refinance of existing owner occupied dwellings rose 0.28%, up $16m.
Looking at investors, borrowing for new investment construction rose 5%, up $65m; while purchase of existing property by investors fell $74m for individuals, down 0.75%; and for other investors, down $21m or 2.28%.
Overall there was a fall of $16m across all categories.
We see a fall in investment lending overall, but it is still 36% of new lending flows, so hardly a startling decline. Those calling for weakening of credit lending rules to support home price growth would do well to reflect that 36% is a big number – double that identified as risky by the Bank of England, who became twitchy at 16%!
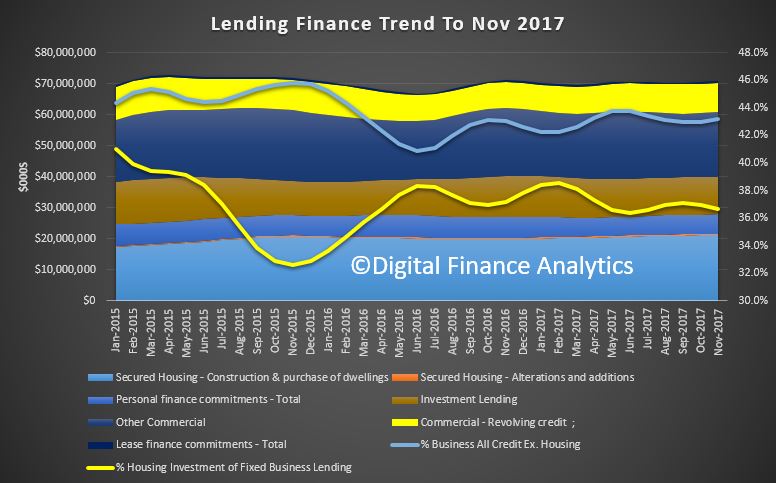
Looking then across all lending categories, personal fixed credit (personal loans rose $70m, up 1.74%; while revolving credit (credit cards) fell $4m down 0.18%. Fixed commercial lending, other than for property investment rose $231m or 1.12%; while lending for investment purposes fell 0.25% or $30m. The share of fixed business lending for housing investment fell to 36.7% of business lending flows, compared with 41% in 2015. Revolving business credit rose $6m up 0.06%.
So, what can we conclude? Investment lending momentum is on the turn, though there is still lots of action in the funding of new property construction for investment – mostly in the high rise blocks around our major centres. But in fact momentum appears to be slowing in Brisbane, Sydney and Melbourne. This does not bode well for the construction sector in 2018, as we posit a fall in residential development, only partly offset by a rise in commercial and engineering construction (much of which is state and federal funded).
The good news is lending to business, other than for housing investment is rising a little, but businesses are still looking to hold costs down, and borrow carefully. This means economic growth will be slow, and potential wages growth will remain contained.
Finally, here is the ABS reporting the data. Note the significant swings between the trend and seasonal adjusted series. You can pick your number, and weave a story to suit, as people are doing.
The total value of owner occupied housing commitments excluding alterations and additions rose 0.1% in trend terms, and the seasonally adjusted series rose 2.7%.
The trend series for the value of total personal finance commitments rose 1.0%. Fixed lending commitments rose 1.7%, while revolving credit commitments fell 0.2%.
The seasonally adjusted series for the value of total personal finance commitments rose 1.1%. Revolving credit commitments rose 2.8% and fixed lending commitments rose 0.1%.
The trend series for the value of total commercial finance commitments rose 0.5%. Fixed lending commitments rose 0.6% and revolving credit commitments rose 0.1%.
The seasonally adjusted series for the value of total commercial finance commitments rose 14.7%. Fixed lending commitments rose 22.0%, while revolving credit commitments fell 8.1%.
The trend series for the value of total lease finance commitments fell 1.2% in November 2017 and the seasonally adjusted series fell 8.0%, after a rise of 4.1% in October 2017.
The latest ABS data on employment to December 2017, shows the trend unemployment rate decreased slightly to 5.4 per cent in December 2017, after the November 2017 figure was revised up to 5.5 per cent. The trend unemployment rate was 0.3 percentage points lower than a year ago, and is at its lowest point since January 2013.
The seasonally adjusted number of persons employed increased by 35,000 in December 2017. The seasonally adjusted unemployment rate increased by 0.1 percentage points to 5.5 per cent and the labour force participation rate increased to 65.7 per cent. The number of hours worked fell.
By state, trend employment rose in NT, WA and SA. Over the past year, all states and territories recorded a decrease in their trend unemployment rates, except the Northern Territory (which increased 1.6 percentage points). The states and territories with the strongest annual growth in trend employment were Queensland and the ACT (both 4.6 per cent), followed by New South Wales (3.5 per cent).
The ABS says monthly trend full-time employment increased for the 14th straight month in December 2017. Full-time employment grew by a further 17,000 persons in December, while part-time employment increased by 8,000 persons, underpinning a total increase in employment of 25,000 persons.
“Full-time employment has now increased by around 322,000 persons since December 2016, and makes up the majority of the 393,000 net increase in employment over the period,” the Chief Economist for the ABS, Bruce Hockman, said.
Over the past year, trend employment increased by 3.3 per cent, which is above the average year-on-year growth over the past 20 years (1.9 per cent). The last time it was 3.3 per cent or higher was in September 2005. The trend monthly hours worked increased by 4.0 million hours (0.2 per cent), with the annual figure also reflecting strong growth over the year (3.6 per cent).
The labour force participation rate remained at 65.5 per cent after the November 2017 number was revised up, the highest it has been since March 2011. The female labour force participation rate also increased to a further historical high of 60.4 per cent, having increased steadily over the past year.