Major Banks Are Still Highly Leveraged

The latest ADI performance data from APRA to September 2017 shows that profitability rose 29.5% on 2016 and the return on equity was  12.3% compared with 9.9% last year. Loans grew 4.1%, provisions were down although past due items were $14.3 billion as at 30 September 2017. This is an increase of $1.5 billion (11.8 per cent) on 30 September 2016.

On a consolidated group basis, there were 147 ADIs operating in Australia as at 30 September 2017, compared to 148 at 30 June 2017 and 153 at 30 September 2016.

  • Summerland Financial Services Limited changed its name from Summerland Credit Union Limited, with effect from 1 August 2017
  • The Royal Bank of Scotland plc had its authority to carry on banking business in Australia revoked, with effect from 31 August 2017.

The net profit after tax for all ADIs was $35.9 billion for the year ending 30 September 2017. This is an increase of $8.2 billion (29.5 per cent) on the year ending 30 September 2016. The cost-to-income ratio for all ADIs was 48.2 per cent for the year ending 30 September 2017, compared to 48.3 per cent for the year ending 30 September 2016. The return on equity for all ADIs was 12.3 per cent for the year ending 30 September 2017, compared to 9.9 per cent for the year ending 30 September 2016.

The total assets for all ADIs was $4.56 trillion at 30 September 2017. This is an increase of $41.9 billion (0.9 per cent) on 30 September 2016. The total gross loans and advances for all ADIs was $3.13 trillion as at 30 September 2017. This is an increase of $123.6 billion (4.1 per cent) on 30 September 2016.

Note: ‘Other ADIs’ are excluded from all figures other than population and total assets. Foreign branch banks are excluded from return on equity and capital adequacy figures.

The total capital ratio for all ADIs was 14.6 per cent at 30 September 2017, an increase from 13.7 per cent on 30 September 2016. The common equity tier 1 ratio for all ADIs was 10.6 per cent at 30 September 2017, an increase from 9.9 per cent on 30 September 2016. The risk-weighted assets (RWA) for all ADIs was $1.95 trillion at 30 September 2017, a decrease of $18.2 billion (0.9 per cent) on 30 September 2016.

For all ADIs Impaired facilities were $11.9 billion as at 30 September 2017. This is a decrease of $3.3 billion (21.7 per cent) on 30 September 2016. Past due items were $14.3 billion as at 30 September 2017. This is an increase of $1.5 billion (11.8 per cent) on 30 September 2016; Impaired facilities and past due items as a proportion of gross loans and advances was 0.84 per cent at 30 September 2017, a decrease from 0.93 per cent at 30 September 2016; Specific provisions were $6.1 billion at 30 September 2017. This is a decrease of $1.0 billion (14.2 per cent) on 30 September 2016; and Specific provisions as a proportion of gross loans and advances was 0.19 per cent at 30 September 2017, a decrease from 0.24 per cent at 30 September 2016.

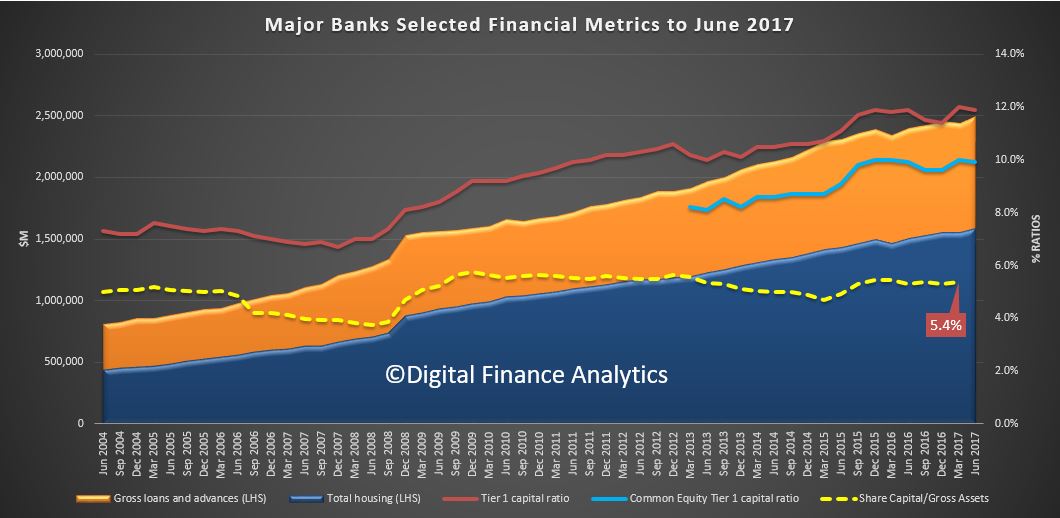
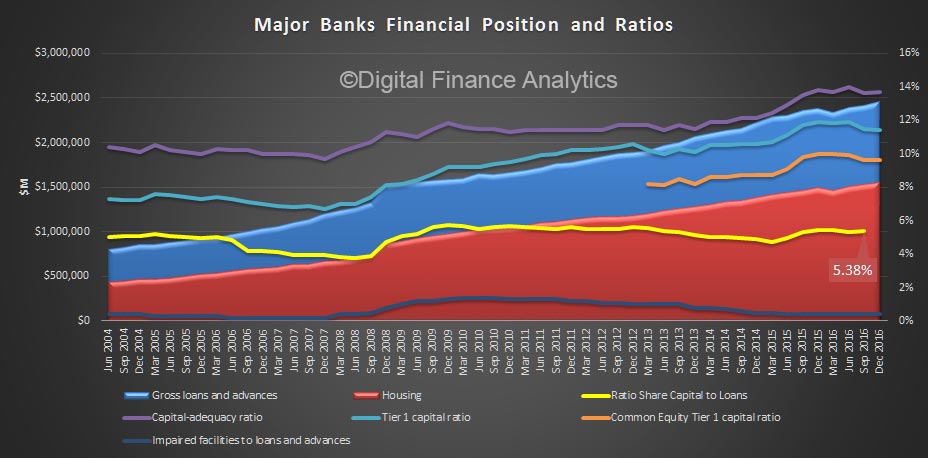
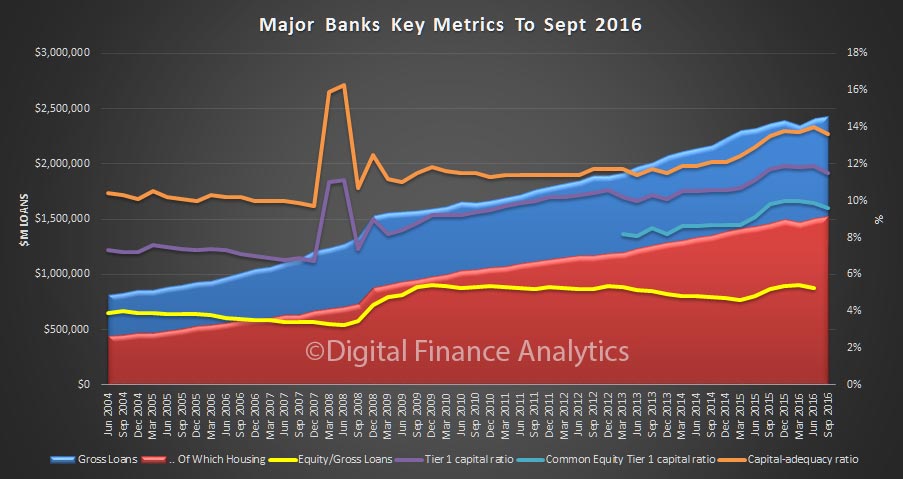
As normal we chart the key ratios for the four major banks.  We see significant rises in gross loans, largely housing related. The capital ratios are higher, but the ratio of gross loans to shareholder funds still sits at 5%, which underscores how leveraged (and so profitable as the lending book grows).

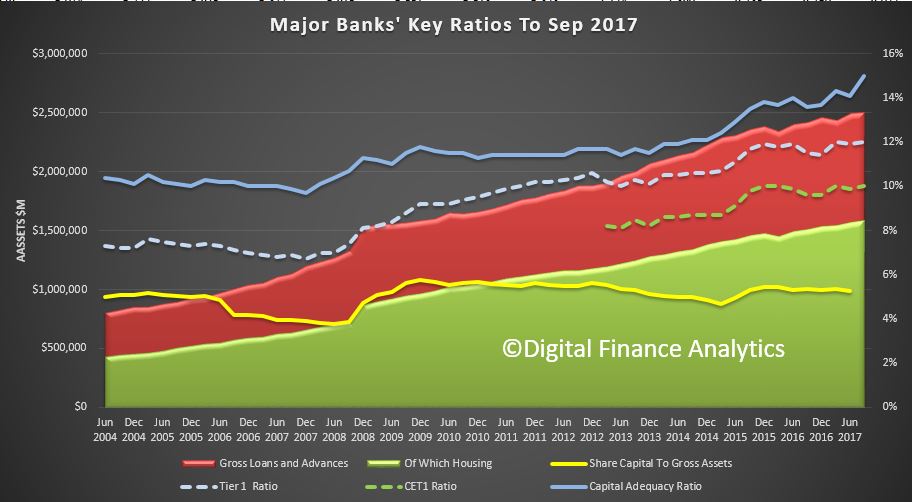
Finally, it is worth reflecting on that fact that the big four comprise around 25% of the ASX 200 in terms of market capitalisation, and financial services overall comprises 35% of the capitalisation. In addition more than half of all dividends comes from the financial services sector, so we are economically very reliant on these players and their highly leveraged mortgage book.


Major Banks Are Highly Leveraged, And More Profitable

APRA released their key metrics for ADI’s to June 2017.  Net Profit across the sector, after tax was $34.2 billion for the year ending 30 June 2017. This is an increase of $6.5 billion (23.5 per cent) in 2016.

Provision were lower, with impaired facilities and past due items as a proportion of gross loans and advances at 0.88 per cent at 30 June 2017, a decrease from 0.94 per cent at 30 June 2016.

The return on equity was 12.0 per cent for the year ending 30 June 2017, compared to 10.3 per cent for the year ending 30 June 2016.

Looking at the four major banks, where the bulk of assets reside, we see that the ratio of share capital to assets is just 5.4%, this despite a rise in tier 1 capital and CET1. This is explained by the greater exposure to housing loans where capital ratios are still very generous, one reason why the banks love home lending. Thus the big four remain highly leveraged.

Looking more broadly at the APRA data:

On a consolidated group basis, there were 148 ADIs operating in Australia as at 30 June 2017, 148 at 31 March 2017 and 156 at 30 June 2016.

  • Bankstown City Credit Union Ltd had its authority to carry on banking business revoked, effective 16 June 2017.
  • ECU Australia Ltd, had its authority to carry on banking business revoked, effective 4 May 2017.
  • China Merchants Bank Co., Ltd, had its authority to carry on banking business authorised, effective 6 June 2017.
  • Taishin International Bank Co., Ltd, had its authority to carry on banking business authorised, effective 23 May 2017

    The net profit after tax for all ADIs was $34.2 billion for the year ending 30 June 2017. This is an increase of $6.5 billion (23.5 per cent) on the year ending 30 June 2016.

The cost-to-income ratio for all ADIs was 50.5 per cent for the year ending 30 June 2017, compared to 50.7 per cent for the year ending 30 June 2016.

The return on equity for all ADIs was 12.0 per cent for the year ending 30 June 2017, compared to 10.3 per cent for the year ending 30 June 2016.

The total assets for all ADIs was $4.64 trillion at 30 June 2017. This is a decrease of $4.6 billion (0.1 per cent) on 30 June 2016.

The total gross loans and advances for all ADIs was $3.12 trillion as at 30 June 2017. This is an increase of $141.5 billion (4.8 per cent) on 30 June 2016.

The total capital ratio for all ADIs was 14.2 per cent at 30 June 2017, an increase from 14.1 per cent on 30 June 2016.

The common equity tier 1 ratio for all ADIs was 10.2 per cent at 30 June 2017, unchanged from 10.2 per cent on 30 June 2016.

The risk-weighted assets (RWA) for all ADIs was $1.97 trillion at 30 June 2017, an increase of $123.0 billion (6.7 per cent) on 30 June 2016.

For all ADIs:

  • Impaired facilities were $13.2 billion as at 30 June 2017. This is a decrease of $1.8 billion (11.9 per cent) on 30 June 2016. Past due items were $14.4 billion as at 30 June 2017. This is an increase of $1.3 billion (10.3 per cent) on 30 June 2016;
  • Impaired facilities and past due items as a proportion of gross loans and advances was 0.88 per cent at 30 June 2017, a decrease from 0.94 per cent at 30 June 2016;
  • Specific provisions were $6.6 billion at 30 June 2017. This is a decrease of $0.2 billion (3.6 per cent) on 30 June 2016; and
  • Specific provisions as a proportion of gross loans and advances was 0.21 per cent at 30 June 2017, a decrease from 0.23 per cent at 30 June 2016.


Banks Made $28.4 billion Year To Dec 2016, Down 22.7%

APRA has released their latest quarterly data to December 2016 on Authorised Deposit-taking Institution Performance. Profitability and return on equity are down, despite significantly lower provisioning.

A quick look at the 4 majors shows further growth in home lending assets, small falls in capital, after an earlier rise, and the continued high leverage ratio between share capital and total assets – it sits at 5.38%, which highlights the continued massive leverage in the system.

Financial performance

  • The net profit after tax for all ADIs was $28.4 billion for the year ending 31 December 2016. This is a decrease of $8.4 billion (22.7 per cent) on the year ending 31 December 2015.
  • The cost-to-income ratio for all ADIs was 47.9 per cent for the year ending 31 December 2016, compared to 49.4 per cent for the year ending 31 December 2015.
  • The return on equity for all ADIs was 10.0 per cent for the year ending 31 December 2016, compared to 13.8 per cent for the year ending 31 December 2015.

Capital adequacy

  • The  total capital ratio for all ADIs was 13.8 per cent at 31 December 2016, a decrease from 13.9 per cent on 31 December 2015.
  • The common equity tier 1 ratio for all ADIs was 9.9 per cent at 31 December 2016, a decrease from 10.2 per cent on 31 December 2015.
  • The risk-weighted assets (RWA) for all ADIs was $1.98 trillion at 31 December 2016, an increase of $109.2 billion (5.8 per cent) on 31 December 2015.

Asset quality

For all ADIs:

  • Impaired facilities were $15.3 billion as at 31 December 2016. This is an increase of $1.5 billion (11.2 per cent) on 31 December 2015. Past due items were $12.9 billion as at 31 December 2016. This is an increase of $1.2 billion (10.1 per cent) on 31 December 2015;
  • Impaired facilities and past due items as a proportion of gross loans and advances was 0.92 per cent at 31 December 2016, an increase from 0.86 per cent at 31 December 2015;
  • Specific provisions were $7.3 billion at 31 December 2016. This is an increase of $0.8 billion (12.9 per cent) on 31 December 2015; and
  • Specific provisions as a proportion of gross loans and advances was 0.24 per cent at 31 December 2016, an increase from 0.22 per cent at 31 December 2015.

On a consolidated group basis, there were 152 ADIs operating in Australia as at 31 December 2016, compared to 153 at 30 September 2016 and 157 at 31 December 2015.

  • Central Coast Credit Union Ltd changed its name from Wyong Shire Credit Union Ltd, with effect from 15 November 2016.
  • Fire Brigades Employees’ Credit Union Limited had its authority to carry on banking business in Australia revoked, with effect from 1 December 2016.
  • Bank Australia Limited changed its name from MECU Limited, with effect from 15 December 2016.

Major Banks Still Highly Leveraged

APRA has published their quarterly summary of bank performance. Looking at the key metrics of the four major banks, we see growth in home lending and driving total loans higher to $2.4 trillion. Net interest income from home lending rose to 61.9%, up from 59.3% the previous quarter, reflecting changes in mortgage discounts and repricing. 83.2% of all ADI home lending is held by the big four.

apra-adi-sepq16-shareHome lending now comprises 62.8% of all loans with the big four. But in cash terms, lending provisions are lower now than in 2010, despite significantly larger balances.

apra-adi-sepq16-mix-and-provThe ratio of bank share equity to total loans sits at just over 5%, showing again how leveraged the banks are. We also see that CET1 and Basel Capital, whilst higher now than in 2013, has fallen somewhat recently.

apra-adi-sepq16The new Liquidity Coverage reporting shows the big four well above the required 100%.

apra-adi-sepq16-lcrTerm deposits rose compared with on-call deposits, thanks to the LCR requirements making term deposits more attractive to the banks.

More generally, on a consolidated group basis, there were 153 ADIs operating in Australia as at 30 September 2016, compared to 156 at 30 June 2016 and 159 at 30 September 2015.

  • G&C Mutual Bank Limited changed its name from SGE Mutual Limited, with effect from 12 September 2016.
  • Latvian Australian Credit Co-operative Society Limited had its authority to carry on banking business in Australia, with effect from 22 September 2016.
  • MyLifeMyFinance Limited changed its name from Transcomm Credit Co-operative Limited, and changed its classification from ‘Credit union’ to ‘Other ADI’, with effect from 3 August 2016.
  • “Quay Credit Union Ltd had its authority to carry on banking business in Australia revoked, with effect from 12 September 2016.”
  • “Select Credit Union Limited had its authority to carry on banking business in Australia revoked, with effect from 7 July 2016.”
  • “Select Encompass Credit Union Ltd changed its name from Encompass Credit Union Limited, with effect from 13 July 2016.”
  • “Sutherland Credit Union Ltd had its authority to carry on banking business in Australia revoked, with effect from 12 July 2016.”
  • “The Bank of Nova Scotia was authorised to operate as a foreign branch bank in Australia, with effect from 25 August 2016.”Looking at financial performance, the net profit after tax for all ADIs was $27.7 billion for the year ending 30 September 2016. This is a decrease of $9.2 billion (25.0 per cent) on the year ending 30 September 2015.

The cost-to-income ratio for all ADIs was 48.3 per cent for the year ending 30 September 2016, compared to 49.0 per cent for the year ending 30 September 2015.

The return on equity for all ADIs was 9.9 per cent for the year ending 30 September 2016, compared to 14.1 per cent for the year ending 30 September 2015.

The total assets for all ADIs was $4.52 trillion at 30 September 2016. This is a decrease of $58.3 billion (1.3 per cent) on 30 September 2015.

The total gross loans and advances for all ADIs was $3.01 trillion as at 30 September 2016. This is an increase of $105.8 billion (3.6 per cent) on 30 September 2015.

The total capital ratio for all ADIs was 13.7 per cent at 30 September 2016, unchanged from 13.7 per cent on 30 September 2015.

The common equity tier 1 ratio for all ADIs was 9.9 per cent at 30 September 2016, a decrease from 10.1 per cent on 30 September 2015.

The risk-weighted assets (RWA) for all ADIs was $1.97 trillion at 30 September 2016, an increase of $110.1 billion (5.9 per cent) on 30 September 2015.

For all ADIs:

  • Impaired facilities were $15.2 billion as at 30 September 2016. This is an increase of $1.4 billion (10.4 per cent) on 30 September 2015. Past due items were $12.9 billion as at 30 September 2016. This is an increase of $1.2 billion (10.5 per cent) on 30 September 2015;
  • Impaired facilities and past due items as a proportion of gross loans and advances was 0.93 per cent at 30 September 2016, an increase from 0.88 per cent at 30 September 2015;
  • Specific provisions were $7.2 billion at 30 September 2016 (chart 8). This is an increase of $0.9 billion (14.2 per cent) on 30 September 2015; and
  • Specific provisions as a proportion of gross loans and advances was 0.24 per cent at 30 September 2016, an increase from 0.22 per cent at 30 September 2015.


Bank Profits Down 27%, Provisions Up To June 2016 – APRA

APRA has released the quarterly ADI performance statistics. On a consolidated group basis, there were 156 ADIs operating in Australia as at 30 June 2016, the same as a year before, despite some changes.

Here is a summary chart for the combined four majors to June 2016.

APRA-Majors-June-2016We see a rise in gross advances, and higher tier 1 capital, though CET1 fell a little. Shareholder capital relative to the lending book rose slightly, but at 5.45% in June, the big banks remain highly leveraged businesses.

Looking more broadly across all ADI’s, the net profit after tax was $27.7 billion to 30 June 2016. This is a decrease of $10.4 billion (27.3 per cent) on the year ending 30 June 2015.

The cost-to-income ratio for all ADIs was 50.7 per cent for the year ending 30 June 2016, compared to 47.4 per cent for the year ending 30 June 2015 while the return on equity for all ADIs was 10.3 per cent for the year ending 30 June 2016, compared to 15.2 per cent for the year ending 30 June 2015.

The total assets for all ADIs was $4.64 trillion at 30 June 2016. This is an increase of $225.3 billion (5.1 per cent) on 30 June 2015. The total gross loans and advances for all ADIs was $2.98 trillion as at 30 June 2016. This is an increase of $139.0 billion (4.9 per cent) on 30 June 2015.

The total capital ratio for all ADIs was 14.1 per cent at 30 June 2016, an increase from 13.1 per cent on 30 June 2015. The common equity tier 1 ratio for all ADIs was 10.2 per cent at 30 June 2016, an increase from 9.5 per cent on 30 June 2015.

The risk-weighted assets (RWA) for all ADIs was $1.84 trillion at 30 June 2016, an increase of $31.1 billion (1.7 per cent) on 30 June 2015. Impaired facilities were $15.0 billion as at 30 June 2016. This is an increase of $0.6 billion (4.2 per cent) on 30 June 2015.

Past due items were $13.0 billion as at 30 June 2016. This is an increase of $0.7 billion (6.0 per cent) on 30 June 2015; Impaired facilities and past due items as a proportion of gross loans and advances was 0.94 per cent at 30 June 2016, unchanged from 0.94 per cent at 30 June 2015; Specific provisions were $7.1 billion at 30 June 2016. This is an increase of $0.6 billion (8.6 per cent) on 30 June 2015; and Specific provisions as a proportion of gross loans and advances was 0.24 per cent at 30 June 2016, an increase from 0.23 per cent at 30 June 2015.

Major Banks Under Pressure?

The latest data from APRA to March 2016 relating to the financial position of the banking sector, makes interesting reading. Net Profit after tax for the sector fell 12.5% to $30.8 billion, total assets rose 1.1% from March 2015 and the capital adequacy ratio rose 1.1% to 13.8%. Total provisions were down 13.9% compared with March 2015.

However, once again we have calculated some key ratios, and overlaid this over their loans and advances and there are a number of stresses revealed when we look at the four major banks. Their total provisions are lower despite a rise in consumer delinquency and specific commercial risks, capital adequacy is lower in the past quarter (despite all the raising), and the ratio of loans to share capital, while up slightly, is still lower than in 2010. The sector is under pressure and we think dividend payouts will have to fall and provisions will need to rise.

APRA-QFS-March-2016APRA says

  • on a consolidated group basis, there were 156 ADIs operating in Australia as at 31 March 2016, compared to 157 at 31 December 2015 and 165 at 31 March 2015.
  • The net profit after tax for all ADIs was $30.8 billion for the year ending 31 March 2016. This is a decrease of $4.4 billion (12.5 per cent) on the year ending 31 March 2015.
  • The cost-to-income ratio for all ADIs was 50.0 per cent for the year ending 31 March 2016, compared to 48.4 per cent for the year ending 31 March 2015.
  • The return on equity for all ADIs was 11.6 per cent for the year ending 31 March 2016, compared to 14.2 per cent for the year ending 31 March 2015.
  • The total assets for all ADIs was $4.53 trillion at 31 March 2016. This is an increase of $51.1 billion (1.1 per cent) on 31 March 2015.
  • The total gross loans and advances for all ADIs was $2.91 trillion as at 31 March 2016. This is an increase of $89.0 billion (3.2 per cent) on 31 March 2015.
  • The total capital ratio for all ADIs was 13.8 per cent at 31 March 2016, an increase from 12.7 per cent on 31 March 2015.
  • The common equity tier 1 ratio for all ADIs was 10.3 per cent at 31 March 2016, an increase from 9.2 per cent on
    31 March 2015.
  • The risk-weighted assets (RWA) for all ADIs was $1.83 trillion at 31 March 2016, an increase of $25.9 billion (1.4 per cent) on 31 March 2015.
  • Impaired facilities were $14.4 billion as at 31 March 2016. This is a decrease of $0.8 billion (5.2 per cent) on 31 March 2015.
  • Past due items were $12.5 billion as at 31 March 2016. This is an increase of $18.1 million (0.1 per cent) on 31 March 2015; Impaired facilities and past due items as a proportion of gross loans and advances was 0.93 per cent at 31 March 2016, a decrease from 0.98 per cent at 31 March 2015.
  • Specific provisions were $6.9 billion at 31 March 2016. This is a decrease of $16.7 million (0.2 per cent) on 31 March 2015; and specific provisions as a proportion of gross loans and advances was 0.24 per cent at 31 March 2016, a decrease from 0.25 per cent at 31 March 2015.