CoreLogic’s preliminary results chime with those from Domain, in terms of trajectory, if not in absolute numbers.
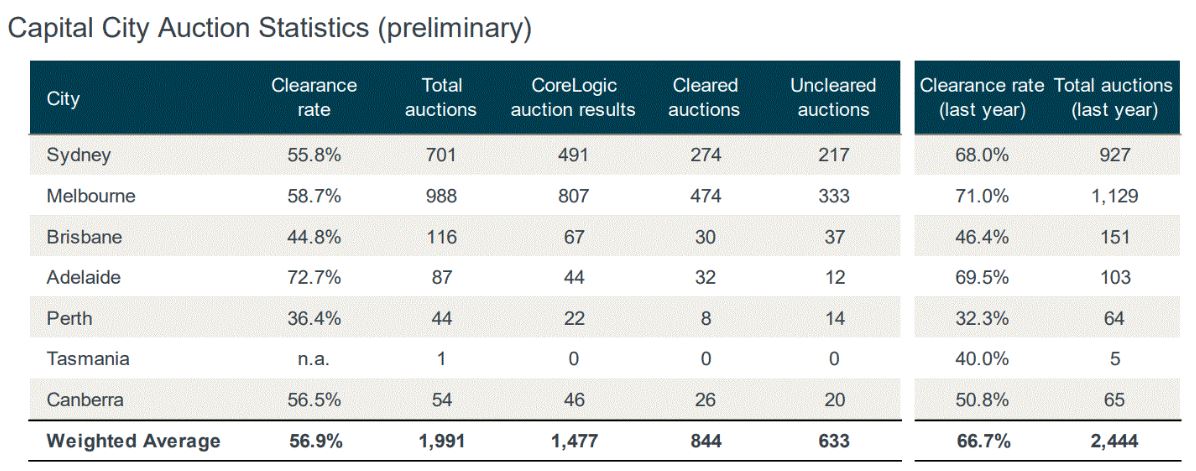
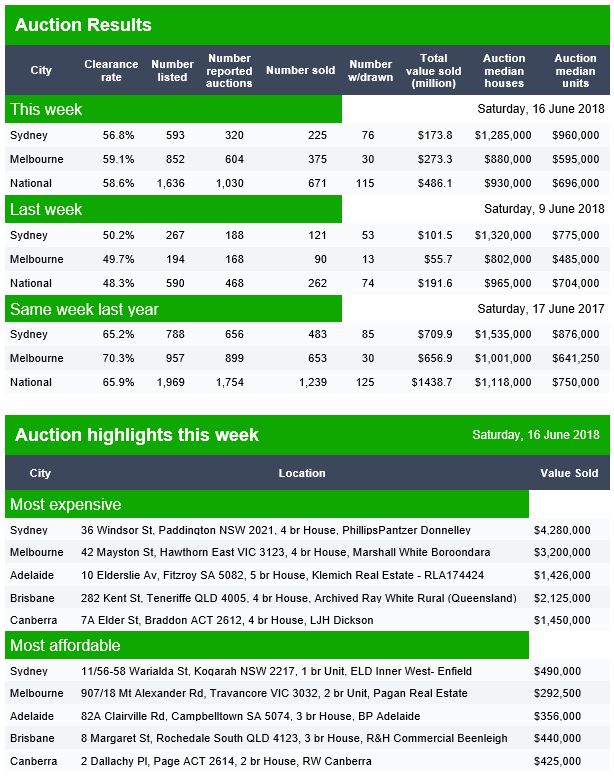
Auction volumes increased significantly over the week with 1,991 homes taken to auction across the combined capital cities, up from just 904 last week when auction volumes were lower due to the Queen’s Birthday long weekend.
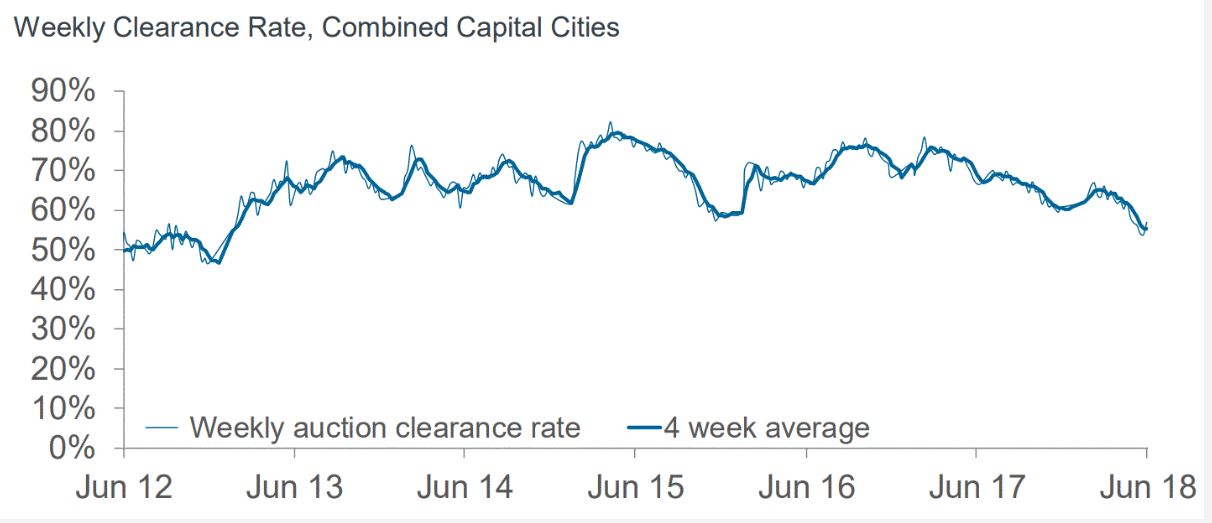
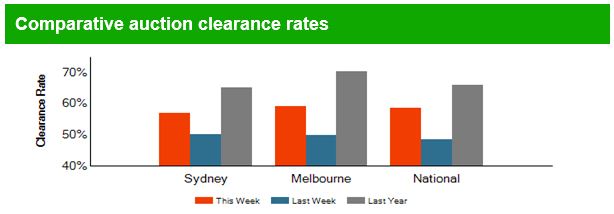
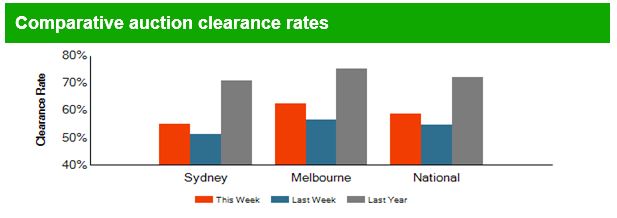
The preliminary clearance rate was recorded at 56.9 per cent this week, after last week saw the final clearance rate revise down to just 53.8 per cent, the lowest level recorded across the combined capitals since 2012.
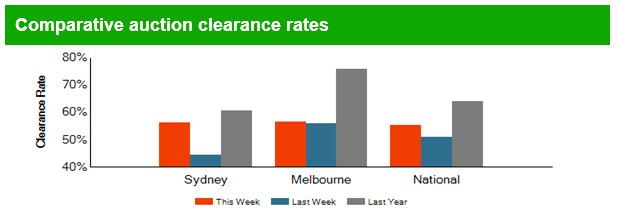
Melbourne was the busiest city for auctions this week, with 988 homes going under the hammer, returning a preliminary clearance rate of 58.7 per cent, compared to last week when 54.9 per cent of the 275 auctions were successful. Over the same week last year, there were 1,129 auctions held in Melbourne, returning a clearance rate of 71.0 per cent.
There were 701 auctions held in Sydney this week returning a preliminary auction clearance rate of 55.8 per cent. In comparison, last week there were just 415 auctions held and a final clearance rate of 56.0 per cent, while this time last year, 68.0 per cent of the 927 auctions held were successful.
Across the smaller auction markets, Brisbane was the busiest city with 116 homes going under the hammer, returning a preliminary clearance rate of 44.8 per cent. The highest preliminary clearance rate was recorded in Adelaide where 72.7 per cent of the 44 reported auctions were successful.
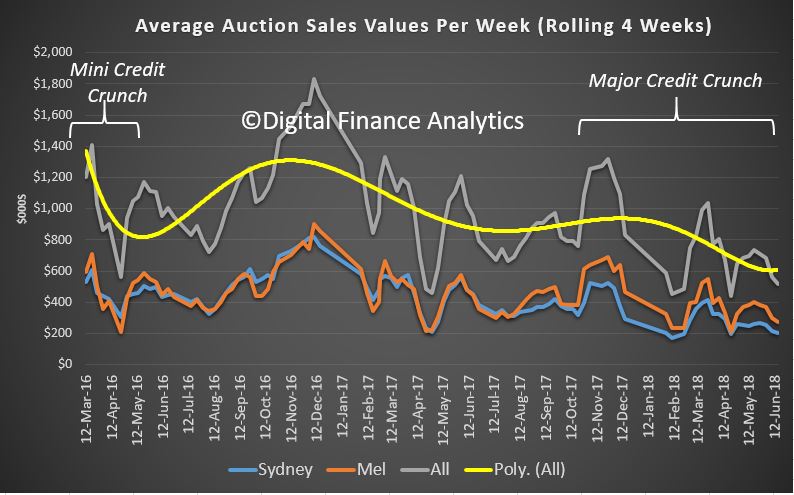
Today I want to look in more detail at the auction results over the past couple of years. I made a post recently which explained why we must take the auction clearance data from Domain and CoreLogic with a large pinch of salt, see “Auction Results Under The Microscope”. But that said, Doman’s latest data from yesterday’s auctions shows that volumes and values are well down. Anyone who wants evidence of how much the market has slowed, just compare the $1.4 billion each week a year ago, with $486 million today! The clearance rates will drop as more results come in, and it seems the volume of auctions initially listed compared with those that go head are significantly lower now.
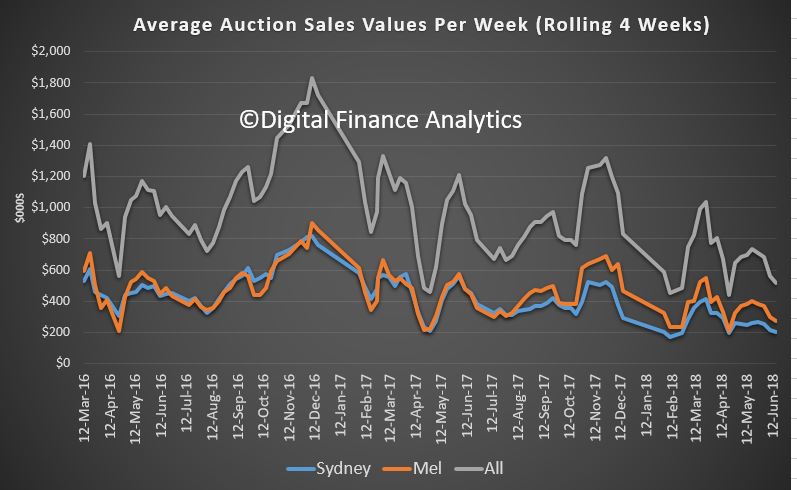
But I have been looking back over the past couple of years, with a focus in the total value of property sold each week at auction. I have used the Domain datasets for this analysis.
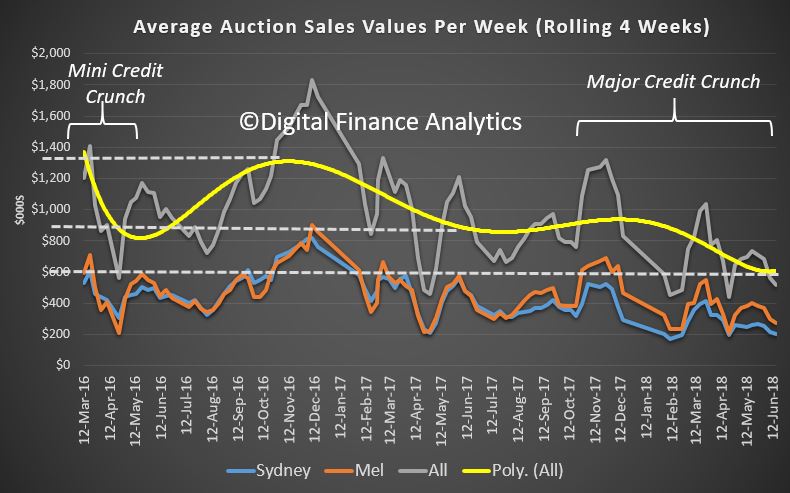
We can chart the rolling average over 4 weeks of property sold at auction by value. Sydney and Melbourne tracked each other until around July last year, but since then Melbourne has been running at a higher rate than Sydney. The total value cleared each week as been as high as $1.6 billion or so in 2016, to around $600 million now. But the trends are not necessarily that clear because of events such as holidays. [Note: scale is in $m not 000’s].
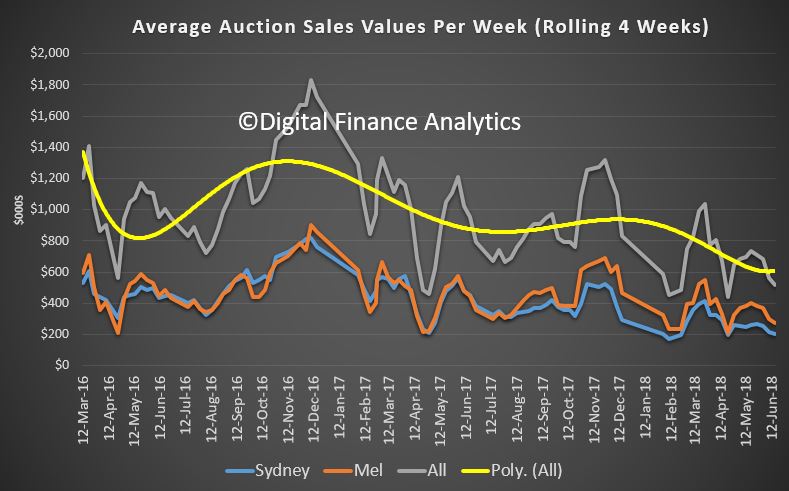
However, if you overlay a trend line, it is clear that the average value of sales closed at auction in 2016 are significantly higher than now.
There was an initial falloff in early 2016 as the 30% speed limit for investment mortgages started to bite, but this was actually relatively short in duration, and sales values picked up in later 2016 and into early 2017. But as the second round of credit tightening, including the focus on interest only lending and tighter underwriting standards; sales value momentum fell significantly through the latter half of 2017 and is dropping away further as we travel through 2018. While the 2016 tightening can be regarded as just a minor credit crunch, the one we are in now is a whole different ball-game – this is a major credit crunch and may become business as normal – and a very different normal too boot.
To underscore that, the average value cleared in November 2016 was around $1.35 billion a week. This time last year the average was a lower $900 million a week, and it is now sitting at around $600 million a week, and falling. We expect this week’s final results to be around $500 million. So sales values are one third down on a year ago, and more than 50% lower than 18 months ago. This is a significant correction.
This drop is explained by a smaller number of auctions, and also the fact that lower priced property is selling relative to the upper echelons of the market. We discussed this in yesterday’s Property Imperative weekly. But it is also explained, and correlated with the tightening in credit. As we have discussed before, credit availability is the primary driver of home prices. Less credit means less demand, and falling prices.
As we expect continued market tightening, as credit continues to be controlled more tightly, we should expect auction values and volumes to continue to languish.
More evidence that we are indeed entering a new phase of the housing market, with significant risks on the downside. It’s just a question of how quickly we slide.
Anyone who wants evidence of how much the market has slowed, compared the $1.4 billion a year ago, with $486 million today! The clearance rates will drop as more results come in, and it seems the volume of auctions which happen are significantly lower than those listed.
Brisbane reported 38 auctions from 88 listings, and 22 sold, at 52%. Adelaide listed 53, reported 26 and sold 22 at 76%. Canberra listed 50, reported 42 and sold 27 at 61% cleared.
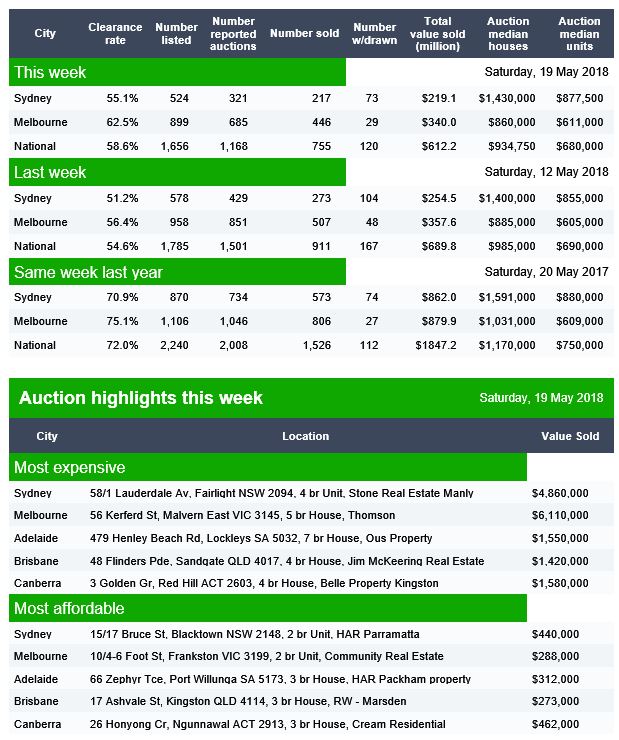
In Sydney, of the 670 listed, there were 336 reported auctions, 91 withdrawn, and a preliminary clearance rate of 56%, already lower than last week’s final measure of 56.5%.
In Melbourne, 942 were listed, 740 auctions reported and 463 sold, at 60%, compared with 57% last week’s final rate. The result will fall lower.
Brisbane listed 72 properties. reported 38 auctions and just 19 sold, at a clearance rate of 48%. Adelaide listed 69, reported 34 and sold 21 at 54% – 5 were withdrawn. Canberra listed 63, reported 53, sold 34 and 4 were withdrawn, giving a Domain clearance rate of 60%.
In this video we discuss how the results are collated and whether they can be trusted.
The preliminary data from CoreLogic, which will correct lower, reports a rate of 59.7% was recorded across Australia’s capital cities, which is below from 60.3% the previous week. Slightly more properties were up for auction than the previous week at 2,287.
But so far only 1,772 reported back and of that 1,058 cleared while 714 failed to sell. More than 500 are outstanding, and that could take the final rate down towards the 56.8% last week.
Clearance rates for units continued to outperform those for houses, coming in at 64.9% and 57.6%.
Melbourne, Australia’s busiest auction market, drove the national decline last week where a preliminary clearance rate of 60.9% was recorded across 1,132 auctions held, falling from a preliminary reading of 64.2% in the prior week when 1,033 properties went under the hammer. They are predicting a final rate below 60%, compared with 62% last week.
Sydney may be a little higher this week, at 62.7% compared with improvement on the 60.8% last week on a preliminary basis. But again, there are a large number of auctions yet to report. Sydney last week achieved a final rate of 54%.
Across the smaller capitals, preliminary clearance rates improved in Adelaide and Perth but fell in Brisbane and Canberra.
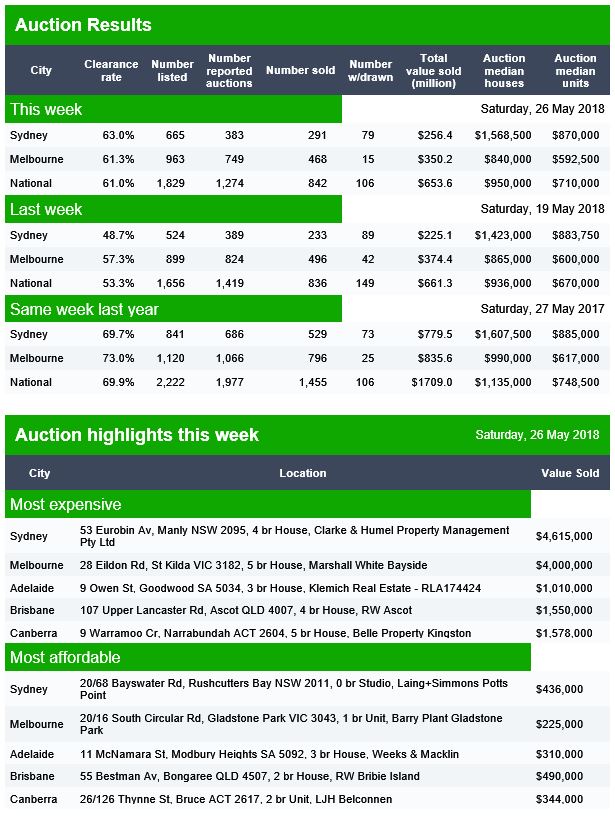
In Sydney 665 properties were listed and 291 were sold. 79 were withdrawn. Last week Sydney ended up with a 48.7% clearance result, so it will be interesting to see if there is any final recover today, as more results come in.
Melbourne listed 963 properties and 468 sold with 15 withdrawn. Last weeks final result was 57.3%.
Brisbane listed 82 and sold 22, with 3 withdrawn, Adelaide listed 57 and sold 25, with 6 withdrawn and Canberra listed 62 and sold 36 with 3 withdrawn.
For more on how the results are collated, and how believable they are see, see our video “Auction Results Under The Microscope”.
There were 2,089 homes taken to auction across the combined capital cities this week, returning a preliminary auction clearance rate of 60.3 per cent. Last week, 2,279 auctions were held and the final clearance rate dropped to 58.2 per cent, the lowest clearance rate seen since December 2015 so it will be interesting to see what happens as the final result are collected early next week. Over the same week last year, auction volumes were higher with 2,824 homes going under the hammer across the combined capital cities, returning a clearance rate of 73.1 per cent.
In Melbourne, Australia’s largest auction market, a preliminary auction clearance rate of 64.2 per cent was recorded across 1,028 auctions this week, up from 59.8 per cent across 1,099 auctions last week, the lowest clearance rate the city has seen since Easter 2014. One year ago, the clearance rate was a stronger 77.9 per cent across 1,326 auctions.
There were 669 auctions held in Sydney this week returning a preliminary auction clearance rate of 60.8 per cent, compared to 57.5 per cent across 787 last week, and 74.0 per cent across 1,075 auctions one year ago.
Across the smaller auction markets, preliminary results show that Canberra was the best performing in terms of clearance rate with a 66.2 per cent success rate across 79 auctions.
Domain have released their preliminary auction clearance results and the weakness in the stats continues, both in terms of volumes and clearance rates. The final results will settle lower still. They are way down on last years.
There is also a larger drop between those listed for auction compared with those auctioned.
In Canberra, 58 were listed for auction and 36 sold. In Brisbane 107 were listed and 27 sold. In Adelaide 68 were listed and 29 sold.
You can watch our recent video blog where we discussed how the auction results are calculated and how reliable they may be, especially in a falling market.