Building Approvals Up In July

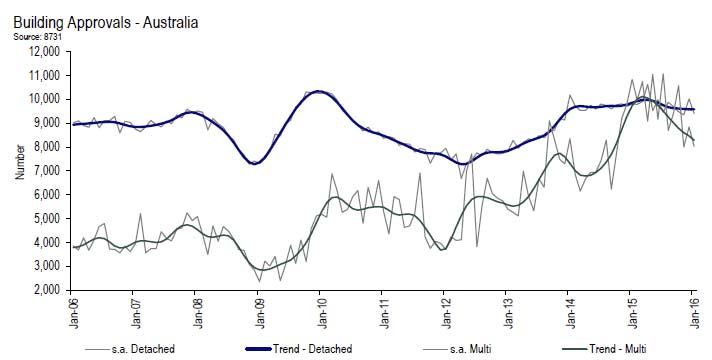
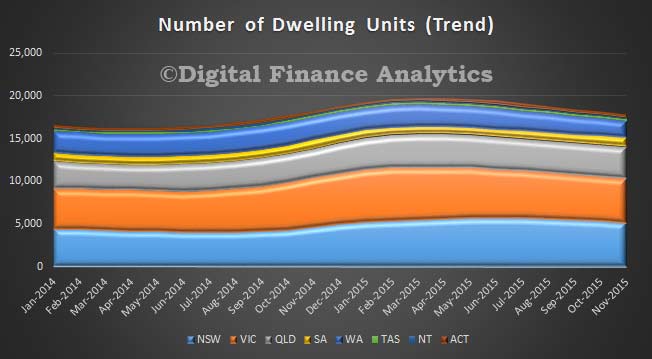
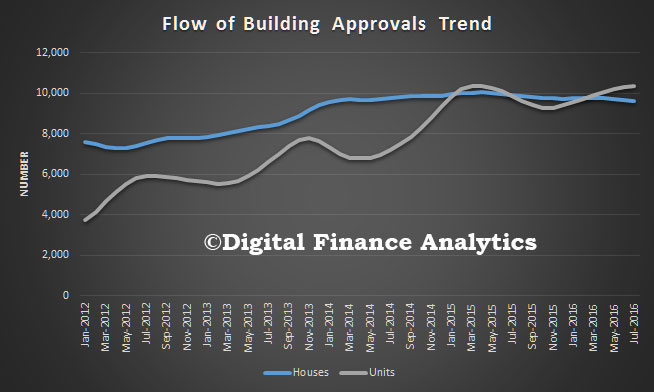
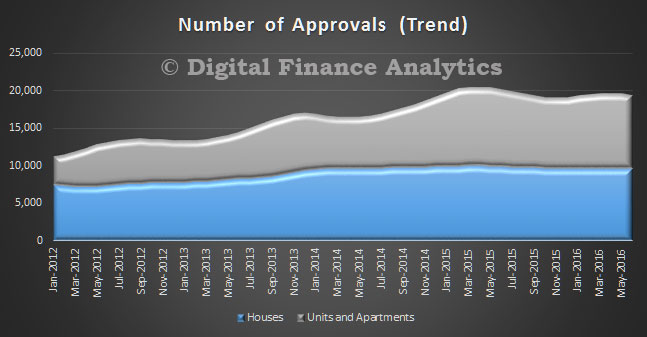
The number of dwellings approved rose 0.2 per cent in July 2016, in trend terms, and has now risen for eight months, according to data released by the Australian Bureau of Statistics (ABS) today. The number of units rose, whilst the number of houses fell.

Build-Approval-July-2016

Dwelling approvals increased in July in New South Wales (2.4 per cent) and Victoria (0.5 per cent) but decreased in Tasmania (3.7 per cent), Northern Territory (3.2 per cent), Australian Capital Territory (2.6 per cent), Queensland (1.8 per cent), South Australia (1.8 per cent) and Western Australia (1.8 per cent) in trend terms.

In trend terms, approvals for private sector houses fell 0.5 per cent in July. Private sector house approvals fell in South Australia (1.6 per cent), Western Australia (1.5 per cent) and Victoria (1.1 per cent). Private sector house approvals rose in Queensland (0.8 per cent) and were flat in New South Wales.

In seasonally adjusted terms, total dwelling approvals increased 11.3 per cent, driven by a rise in total other residential dwelling approvals (23.4 per cent). Total house approvals fell 0.6 per cent.

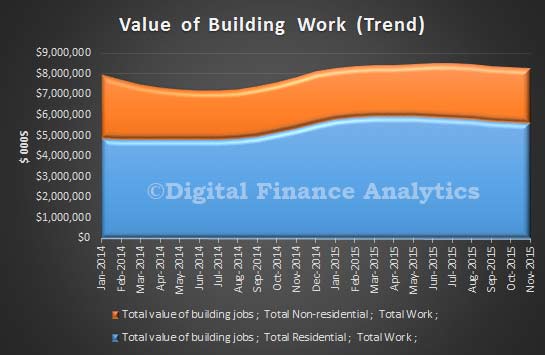
The value of total building approved rose 1.9 per cent in July, in trend terms, and has risen for seven months. The value of residential building rose 0.9 per cent, while non-residential building rose 3.9 per cent.

Dwelling Approvals Fall In June

The number of dwellings approved fell 0.9 per cent in June 2016, in trend terms, according to data released by the Australian Bureau of Statistics (ABS) today. This is the second successive monthly fall.

Building-Approvals-June-2016Dwelling approvals decreased in June in Western Australia (5.2 per cent), Tasmania (3.7 per cent), Queensland (3.2 per cent), Australian Capital Territory (2.8 per cent) and Victoria (0.1 per cent), but increased in the Northern Territory (3.6 per cent), South Australia (1.6 per cent) and New South Wales (0.8 per cent) in trend terms.

In trend terms, approvals for private sector houses fell 0.6 per cent in June. Private sector house approvals fell in Western Australia (3.5 per cent), Victoria (0.6 per cent), Queensland (0.5 per cent) and South Australia (0.3 per cent). Private sector house approvals rose in New South Wales (0.9 per cent).

In seasonally adjusted terms, total dwelling approvals decreased 2.9 per cent, with both total other residential dwelling approvals (3.4 per cent) and total houses (2.4 per cent) recording falls.

The value of total building approved rose 1.2 per cent in June, in trend terms, and has risen for six months. The value of residential building rose 0.1 per cent while non-residential building rose 3.7 per cent.

Dwelling approvals rise in April

The number of dwellings approved rose 1.2 per cent in April 2016, in trend terms, and has risen for five months, according to data released by the Australian Bureau of Statistics (ABS) today.

Dwelling approvals increased in April in the Australian Capital Territory (6.7 per cent), Queensland (2.9 per cent), South Australia (2.2 per cent), Tasmania (1.9 per cent) and New South Wales (1.4 per cent). Dwelling approvals decreased in the Northern Territory (15.2 per cent) and Western Australia (0.1 per cent) in trend terms, and were flat in Victoria.

In trend terms, approvals for private sector houses rose 0.2 per cent in April. Private sector house approvals rose in South Australia (2.0 per cent), Victoria (0.7 per cent) and New South Wales (0.7 per cent), but fell in Western Australia (1.4 per cent) and Queensland (0.6 per cent).

In seasonally adjusted terms, dwelling approvals increased 3.0 per cent, driven by private sector dwellings excluding houses which rose 8.7 per cent. Private sector house approvals fell 2.3 per cent in seasonally adjusted terms.

The value of total building approved rose 1.1 per cent in April, in trend terms, and has risen for three months. The value of residential building rose 1.6 per cent while non-residential building was flat.

Dwelling approvals rise in March

The number of dwellings approved rose 0.6 per cent in March 2016, in trend terms, and has now risen for four months, according to data released by the Australian Bureau of Statistics (ABS) today.

Dwelling approvals increased in March in the Australian Capital Territory (18.9 per cent), Western Australia (1.1 per cent), Queensland (0.8 per cent) and Victoria (0.2 per cent) in trend terms. Dwelling approvals decreased in the Northern Territory (18.1 per cent), Tasmania (1.5 per cent), New South Wales (0.3 per cent) and South Australia (0.1 per cent) in trend terms.

In trend terms, approvals for private sector houses rose 0.3 per cent in March. Private sector house approvals rose in Victoria (1.7 per cent), but fell in South Australia (0.8 per cent), Western Australia (0.7 per cent) and Queensland (0.2 per cent). Private sector house approvals were flat in New South Wales.

In seasonally adjusted terms, dwelling approvals increased 3.7 per cent. Private sector house approvals rose 2.6 per cent, while private sector dwellings excluding houses rose 6.7 per cent.

The value of total building approved fell 0.9 per cent in March, in trend terms, and has fallen for eight months. The value of residential building rose 0.4 per cent while non-residential building fell 3.9 per cent.

Trend Building Approvals Fall Again

According to the ABS, the trend estimate for total dwellings approved fell 0.5% in February and has fallen for 11 months while the seasonally adjusted estimate for total dwellings approved rose 3.1% in February following a fall of 6.6% in the previous month.

Building-Approvals-Number-Feb-2016The trend estimate for private sector houses approved fell 0.9% in February and has fallen for 10 months while the seasonally adjusted estimate for private sector houses fell 1.2% in February and has fallen for two months.

The trend estimate for private sector dwellings excluding houses fell 0.4% in February and has fallen for 11 months whilst the seasonally adjusted estimate for private sector dwellings excluding houses rose 7.6% in February following a fall of 8.4% in the previous month.

Value-Approvals-Feb-2016
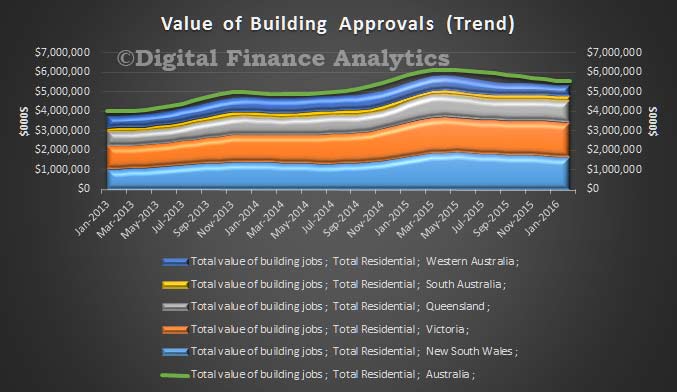
The trend estimate of the value of total building approved fell 0.8% in February and has fallen for seven months. The value of residential building fell 0.7% and has fallen for 10 months. The value of non-residential building fell 1.2% and has fallen for six months.

The seasonally adjusted estimate of the value of total building approved rose 5.3% in February following a fall of 8.9% in the previous month. The value of residential building rose 6.9% following a fall of 9.2% in the previous month. The value of non-residential building rose 2.0% after falling for two months.


Dwelling approvals continue to decline in February

The number of dwellings approved fell 0.5 per cent in February 2016, in trend terms, and has fallen for 11 months, according to data released by the Australian Bureau of Statistics (ABS) today.

Dwelling approvals decreased in February in the Northern Territory (9.7 per cent), South Australia (2.1 per cent), Western Australia (1.4 per cent), Queensland (0.8 per cent), Tasmania (0.5 per cent) and New South Wales (0.1 per cent) but increased in the Australian Capital Territory (4.9 per cent) in trend terms. Dwelling approvals were flat in Victoria, in trend terms.

Approvals for private sector houses fell 0.9 per cent in February, while approvals for private sector dwellings excluding houses fell 0.4 per cent, in trend terms.

Private sector house approvals fell in Western Australia (2.2 per cent), New South Wales (1.5 per cent), South Australia (1.3 per cent), Queensland (0.5 per cent) and Victoria (0.3 per cent).

The seasonally adjusted estimate for dwelling approvals rose 3.1 per cent in February following a 6.6 per cent fall in January. The rise in February was driven by dwellings excluding houses (up 7.7 per cent), offset by a 1.0 per cent fall in approvals for houses.

The largest contributors to the overall rise in seasonally adjusted dwelling approvals by state were Tasmania (24.0 per cent), New South Wales (14.4 per cent) and Queensland (9.5 per cent).

The value of total building approved fell 0.8 per cent in February, in trend terms, and has fallen for seven months. The value of residential building fell 0.7 per cent while non-residential building fell 1.2 per cent.

Building Approvals Stumble into 2016

ABS figures show that new home building approvals faltered during the first month of 2016, said the Housing Industry Association (HIA). “January 2016 was a rather weak month for new home building approvals, with both detached house approvals and those for multi-units falling back compared with December,” noted HIA Senior Economist
Shane Garrett.

HIA---New-Homes-January-2016During January 2016, new home building approvals declined by 7.5 per cent. This comprised a 6.1 per cent drop in detached house approvals and a reduction of some 9.1 per cent in multi-unit approvals. Over the past year, approvals totalled some 231,752 which is 10.6 per cent higher than the previous 12 month period and still very strong by historical standards. “Towards the end of 2015, the residential building industry was hit by a number of unfavourable developments. The major banks increased their mortgage interest rates, credit conditions were tightened for domestic investors and the $5,000 foreign investor fee came into force. This has made it more difficult to deliver new housing supply and today’s figures seem to bear this out,” Shane Garrett pointed out.

During January 2016, total seasonally adjusted new home building approvals saw the largest increase in South Australia (+14.2 per cent), followed by Western Australia (+7.2 per cent) and Victoria (+2.9 per cent). The volume of approvals fell in New South Wales (-22.9 per cent), Queensland (-13.4 per cent) and Tasmania (-11.1 per cent). In trend terms, approvals saw a 9.4 per cent decline in the Northern Territory and contracted by 11.4 per cent in the Australian Capital Territory.

Building Approvals Down In November 2015

Australian Bureau of Statistics (ABS) Building Approvals show that the number of dwellings approved fell 1.9 per cent in November 2015, in trend terms, and has fallen for eight consecutive months.

Units-Approved-Nov-2015Dwelling approvals decreased in November in Australian Capital Territory (-9.3 per cent), Western Australia (-4.5 per cent), New South Wales (-2.8 per cent), Tasmania (-2.6 per cent), Victoria (-2.4 per cent) and Northern Territory (-0.6 per cent) but increased in South Australia (3.2 per cent) and Queensland (0.9 per cent) in trend terms.

In trend terms, approvals for private sector houses was flat in November. Private sector house approvals fell in Western Australia (-2.2 per cent) and New South Wales (-0.5 per cent) but rose in South Australia (1.9 per cent), Victoria (1.3 per cent) and Queensland (0.1 per cent).

The value of total building approved fell 0.8 per cent in November, in trend terms, and has fallen for four consecutive months. The value of residential building fell 1.2 per cent while non-residential building was flat.

Value-Building-Work-Nov-2015

Stronger New Dwelling Approvals in October

ABS figures released today show that building approvals increased by 3.9 per cent in October, the second consecutive month of growth, said the Housing Industry Association.

During October, total seasonally-adjusted new dwelling approvals rose to 19,652, the strongest monthly result since the all-time record high reached in July. The distribution of the growth was mixed, however; while multi-unit approvals increased by 10.1 per cent during October, detached house approvals fell by 2.1 per cent during the month. The back-to-back increases in approvals during September and October were the first consecutive monthly increases since the beginning of the year.

HIA-Approvals-October-2015During October 2015, total seasonally adjusted new home building approvals saw the largest increase in South Australia (+23.4 per cent), followed by New South Wales (+22.0 per cent) and Victoria (+21.2 per cent). Approvals fell in Tasmania (-41.6 per cent), Queensland (-28.7 per cent) and Western Australia (-1.1 per cent). In trend terms, approvals saw a 7.1 per cent increase in the NT but declined by 10.8 percent in the Australian Capital Territory.

Building Approvals Fall In September

Australian Bureau of Statistics (ABS) Building Approvals show the number of dwellings approved fell 1.8 per cent in September 2015, in trend terms, and has fallen for six months.

Dwelling approvals decreased in September in Northern Territory (3.3 per cent), Western Australia (3.2 per cent), New South Wales (2.6 per cent), Victoria (1.8 per cent), Tasmania (1.2 per cent), Australian Capital Territory (0.7 per cent) and Queensland (0.3 per cent) but increased in South Australia (0.4 per cent) in trend terms.

In trend terms, approvals for private sector houses fell 0.2 per cent in September. Private sector house approvals fell in Western Australia (3.1 per cent) and New South Wales (1.2 per cent) but rose in Queensland (2.2 per cent) and Victoria (1.1 per cent). Private house approvals were flat in South Australia, in trend terms.

The value of total building approved fell 0.6 per cent in September, in trend terms, and has fallen for two months. The value of residential building fell 1.1 per cent while non-residential building rose 0.6 per cent in trend terms.