State of the States – NSW Wins

Commsec released their latest state of the state report,  calculated from eight key indicators: economic growth; retail spending; business investment; unemployment; construction work done; population growth; housing finance and dwelling commencements. Housing finance and construction therefore drive the index hard.

They say that Australia’s economies are in good shape but with some differences in relative performance. NSW remains solidly on top of the economic performance rankings from Victoria while the ACT holds down third spot. Then there is a gap to Tasmania, South Australia and Queensland, and then a gap to the Northern Territory and Western Australia.

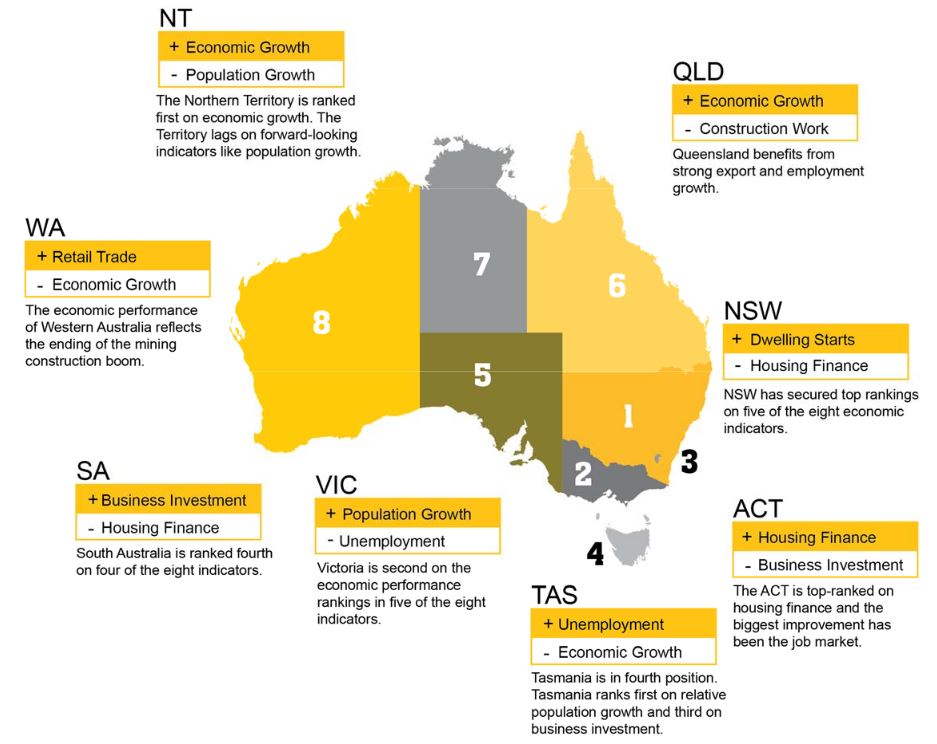
NSW has secured top rankings on five of the eight economic indicators: retail trade, dwelling starts, equipment investment, construction work and unemployment. NSW is second on economic growth and in third spot on population growth and housing finance.

Victoria is second on the economic performance rankings for five of the eight indicators: retail trade, housing finance, population growth, construction work done and equipment investment. The lowest ranking is fifth on the unemployment rate.

The ACT held on to third spot on the rankings. The biggest improvement has been the job market, with annual employment growth now the strongest in almost a decade. The ACT is top-ranked on housing finance.

There is little to separate three of the next economies with a further gap to Northern Territory and Western Australia. Tasmania has lifted from fifth to fourth position. Tasmania now is top-ranked on relative population growth and is third-placed on equipment investment and unemployment. Population growth is the strongest in 6½ years.

South Australia has eased from fourth to fifth on the performance rankings. South Australia is ranked fourth on four of the eight indicators.

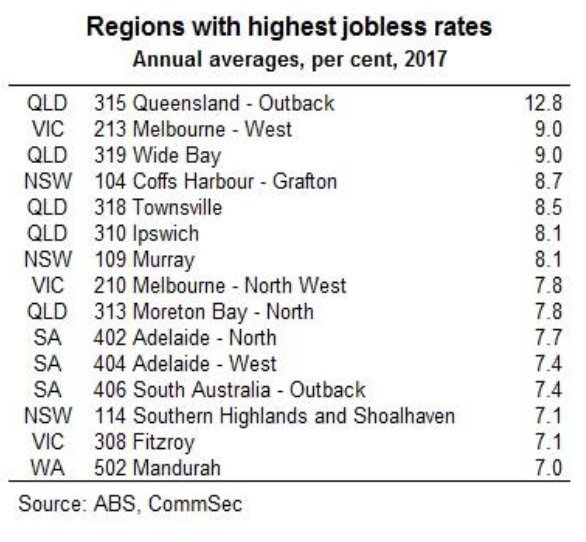
Queensland remains in sixth position. But the outlook is promising with annual employment growth the fastest in the nation and just off the fastest for the state in over a decade.

The Northern Territory retains its seventh position on the economic performance rankings. The Territory is top ranked on economic growth but now lags all other economies on six of the eight indicators. Employment is now lower than a year ago in trend terms. The good news is that exports are growing strongly, up 35 per cent on a year ago.

The economic performance of Western Australia continues to reflect the ending of the mining construction boom. But employment growth was just off the strongest levels seen in five years. And annual population growth has lifted for the past four quarters.

A More Regional Look At Jobs

CommSec looked at employment across regions over the last year.

Despite the boom in jobs, the regional variations are quite stark, with some areas showing higher rates of unemployment, and difficult economic conditions

There is also a correlation between employment and mortgage stress, more on this when we release our latest monthly stress update next week.

CommSec says:

Generally people in metropolitan areas earn higher incomes than their cousins in the country, but employment outcomes vary considerably.

Unemployment has increased in several Queensland regional centres in recent years. Outback Queensland, which includes western and far north areas of the state, has the worst unemployment rate in the country. That said, Cairns’ average unemployment rate has improved to 5.9 per cent in 2017 from 7.8 per cent a year ago.

Queensland’s coastal regional centres such as Bundaberg, Maryborough, Gympie, Bundaberg and Hervey Bay, known more broadly as Wide Bay (average 9.0 per cent), together with Townsville (albeit lower at 8.5 per cent) have elevated jobless rates. Manufacturing jobs in Wide Bay have declined by 1,306 between 2010 and 2016 according to Regional Development Australia.

The average unemployment rate in Coffs Harbour-Grafton on the NSW Mid-North Coast deteriorated to 8.7 per cent over 2017. Pleasingly, the actual unemployment rate fell to 6.1 per cent by year-end. Construction jobs have increased, underpinned by the $3.3 billion Pacific Highway upgrade between Port Macquarie and Coffs Harbour. A further 2,970 workers are expected to be employed on the $4.36 billion Woolgoolga to Ballina road upgrade.

Unemployment also increased along the suburban fringes and city ‘spines’ such as Ipswich (8.1 per cent) in Brisbane and the western suburbs of Melbourne (9.0 per cent). Around 950 jobs were lost at Holden’s Elizabeth factory in Adelaide’s north in October, pushing up the area’s unemployment rate to 7.7 per cent.

Higher income metropolitan areas, especially in Sydney’s coastal suburbs, dominate the regions with the lowest unemployment rates. However, the corridor between Broken Hill and Dubbo has Australia’s lowest regional unemployment rate at 2.9 per cent, benefitting from agricultural, tourism and mining-related jobs growth.

Melbourne satellite city Ballarat has experienced faster and younger population growth than its regional Victorian peers, supporting jobs growth. The unemployment rate in Ballarat has fallen to 4.1 per cent from 5.3 per cent over the year to December.

In Western Australia, Mandurah, south of Perth, experienced a significant decline in the jobless rate to an average of 7.0 per cent in December from 11.2 per cent a year ago. Mandurah has benefited from job-creating projects such as the Dwellingup National Trails Centre and Quambie Park aged care expansion.


The Incredible Shrinking Home

Interesting research from CommSec, who commissioned the ABS to look at trends in the size of Australian homes. They says the average floor size of an Australian home (houses and apartments) has fallen to a 20-year low, the average new home is 189.8 square metres, down 2.7 per cent over the past year and the smallest since 1997.

Australians continue to build some of the biggest houses in the world. But an increasing proportion of Australians – especially in Sydney, Melbourne and Brisbane – also want smaller homes like apartments, semi-detached homes and town houses. As a result, the average home size continues to fall – now at 20-year lows.

Generation Y, Millennials, couples and small families want to live closer to work, cafes, restaurants, shopping and airports and are giving up living space for better proximity to the desirable amenities.

So consolidation is occurring in the eastern states. Older free-standing houses are making way for apartments. And while building completions hit record highs in the year to March, approvals to build homes are rising again.

It is important to note that there are differences in house size across Australia. In the past year the average size of houses built in both South Australia and Western Australia has lifted. In fact South Australia built the biggest homes on records going back 30 years. And on average Western Australian houses built in 2016/17 were just short of record highs for the state.

Clearly the changes in housing demand and supply, and the differences across the country, have major implications for builders, developers, investors, building material companies, financiers and all levels of Government.

OCCUPANCY RATES

Since the first Census was conducted in 1911, and up to 2006, the number of persons per dwelling consistently fell. In 1911 there was an average of 4.5 people in every home. But by 2006 this ratio had almost halved to around 2.4 people in every home. Not only were more homes being built but other factors like families with fewer children, more divorces fewer marriages taking place had resulted in smaller families.

From 2006 to 2013, the number of people per dwelling rose. At face value, the modest increase in average household size may not seem significant. But it was the first increase in household size – and as a consequence, the average number of people in Australian homes – in at least a century.

Children were staying home longer with their parents – no doubt the cost of homes and rising rents being key influences. With the ageing population, more generations were choosing to stick together in the one dwelling – a trend that is a consequence of the increased size and quality of homes. New migrants also chose to stay with family or friends. And given the increased preference to attend universities and colleges, Generation Y was forced to share accommodation and save longer to buy a home.

But according to quarterly ABS data, since 2014 the number of people per dwelling has again been falling. Lower interest rates and the increased supply of cheaper apartments (compared with houses) have prompted older couples to down-size. More Generation Y have been looking to move out of home and take ownership of accommodation more appropriate to their needs.

In part, the decline in household size explains some of the lift in home building. Higher population growth – especially in NSW and Victoria – also explains the lift in home building. The question is whether household size continues to fall over the next few years or whether higher home prices acts to stall demand, again prompting greater co-habitation of dwellings.

STATE DATA

Victorians are building the biggest houses in Australia. In 2016/17 the average floor area of houses built in Victoria was 242.8m², ahead of Western Australia (242.5m²), NSW (230.0m²) and Queensland (227.3m²).

The smallest new houses built were in Tasmania (195.5m²) and the ACT (197.0m²).

In 2016/27 the biggest apartments could be found in the Northern Territory (154.5m²). However, the data may be distorted by the small number of completions in the year (1,173).

Of the states, South Australia built the biggest apartments in 2016/17 with the average floor area at 152.3m², ahead of Victoria (131.0m²) and Tasmania (129.8m²).

Of all homes built in 2016/17, the average floor area was biggest in Western Australia (214.3m²), then South Australia (201m²). In Western Australia over 69 per cent of homes built were free-standing houses, and in South Australia houses were 73.2 per cent of the total. By comparison, only 43.6 per cent of homes built in NSW were free-standing or detached houses.