We look at the latest credit aggregates and recent speech from the RBA. All the lending eggs are in the owner occupied mortgage basket – what could possibly go wrong?
The latest edition of our finance and property news digest with a distinctively Australian flavour.
Go to the Walk The World Universe at https://walktheworld.com.au/
We look at the latest credit aggregates and recent speech from the RBA. All the lending eggs are in the owner occupied mortgage basket – what could possibly go wrong?
The latest edition of our finance and property news digest with a distinctively Australian flavour.
The RBA and APRA released their monthly stats to end June on Friday.
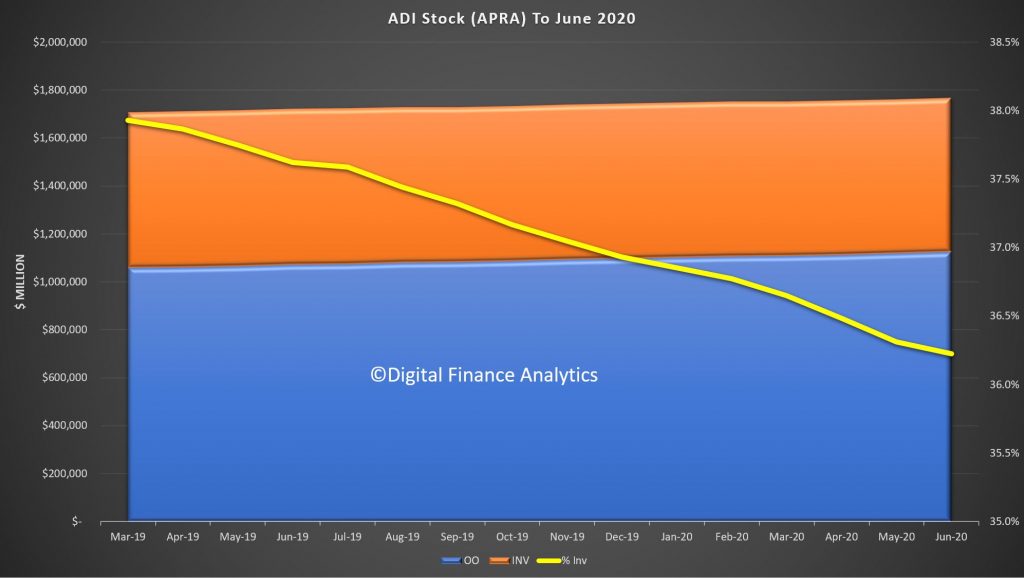
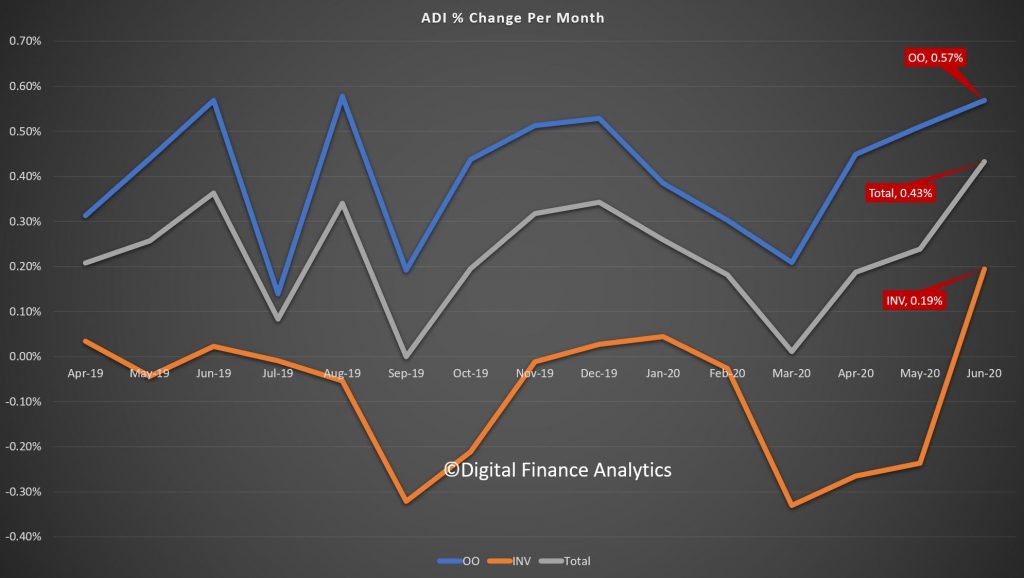
The stock data from APRA, relating to the ADI’s (banks etc.) revealed that total owner occupied housing lending rose 0.57% to $1.12 trillion, while investment lending rose 0.19% to $0.64 trillion. As a result total lending for housing from ADI’s was up 0.43% to $1.76 trillion. A record. Investment lending was 36.2%, dropping again. And remember, around 11% (~$200 billion) of borrowing households are on repayment holidays, so balances are automatically rising as a result. Something which I note few are commenting on.
The change over time shows that as the lock downs were eased in June, demand for credit was higher, something which we suspect will be temporary. And of course refinancing is 40% higher, and we know that many drew down additional equity through the transaction. More on that in a later post.
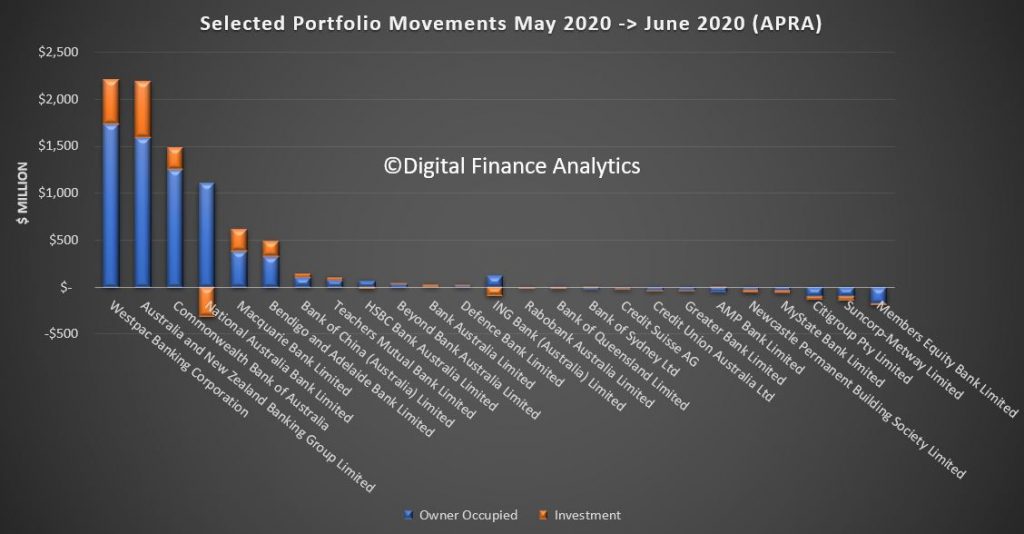
Westpac led the pack according to the bank level data, with growth that matched CBA, although CBA wrote more investor loans. NAB dropped investor loan balances according to the APRA report, while Members Equity and Suncorp dropped both investor and owner occupied balances. The cheap loans offered by the big four makes it hard for smaller players to compete as they fight for market share scraps in a difficult market. The 60 basis point drop in funding, thanks to the RBA, is of course helping to drive rates lower.
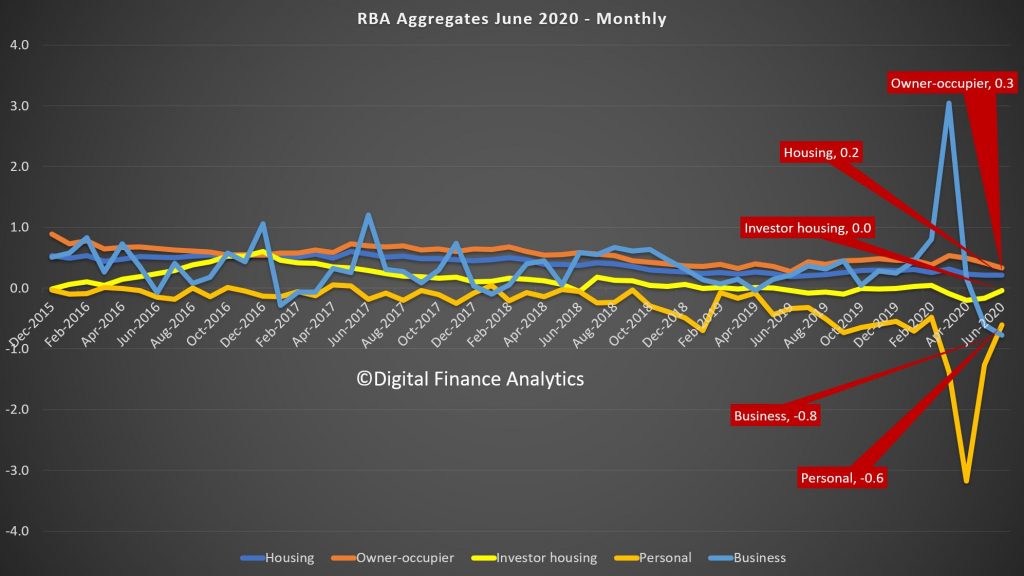
The RBA series, which includes the non-banks shows a somewhat similar story with the monthly housing for owner occupied higher, at 0.3% up, investment lending flat, and total housing up 0.2%. Business lending and personal credit were both lower.
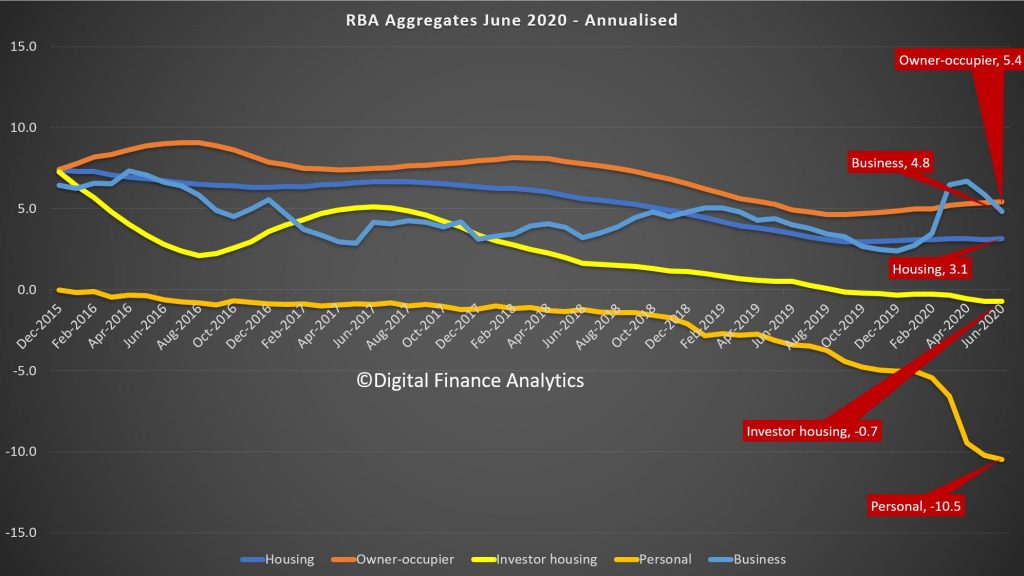
The less noisy annual trends revealed that annualised growth of owner occupied loans is still an amazing 5,4%, while investor lending is down 0.7%, leading to average housing lending at 3.1%. Business credit is 4.8% but that was upped by drawn downs at the start of the virus phase, and is now lower, and personal lending is down 10.5%.
The total credit number was down to 2.9% and we suspect will continue to head south, while the broad money measure was up to 10.2% – thanks to the RBA interventions, JobSeeker, JobKeeper, Super withdrawals, and other stimulus measures. The question now becomes where will the money flow – to drive prices higher as people buy more, or into the financial system to drive stocks and other financial assets higher? One leads to inflation, the other to deflation – I suspect we will follow the Japan route but we will see.
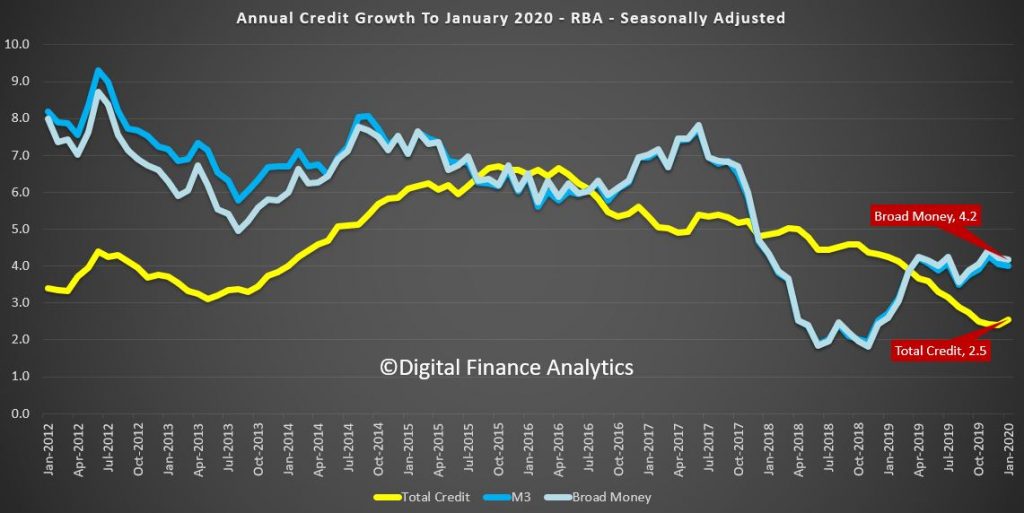
The latest data from the RBA, the credit aggregates to end January 2020 were released today. Total credit grew by 0.3% last month, compared with 0.2% in December. This gives an annual rate of 2.5%, compared to 4.2% in January 2019.
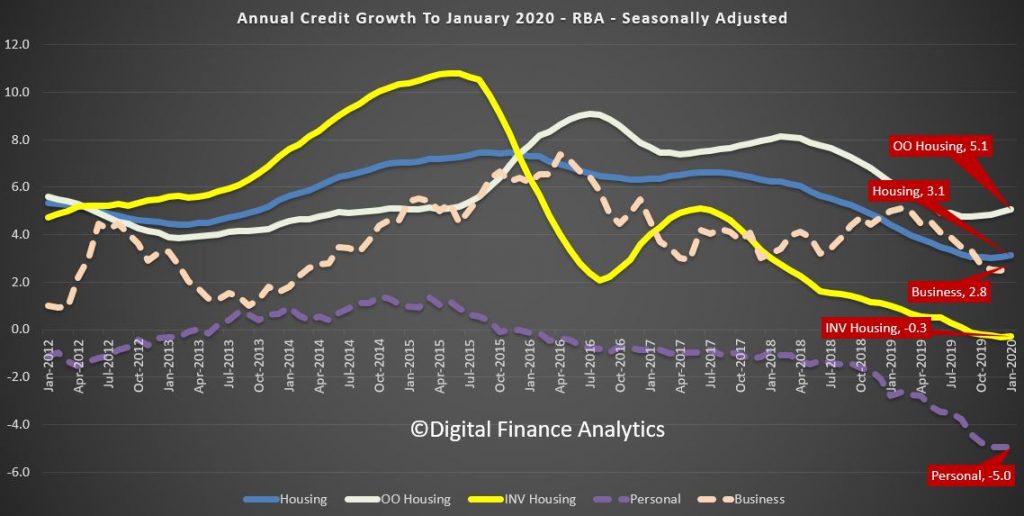
The annual series shows that owner occupied housing rose 5.1%, investment housing lending is down 0.3% and overall housing at 3.1%, up from a low of 3% in November, so hardly stellar.
Business credit rose by 0.5% in January, compared with 0.2% in December, giving an annual rise of 2.8% compared with 5% a year ago. That was the biggest mover.
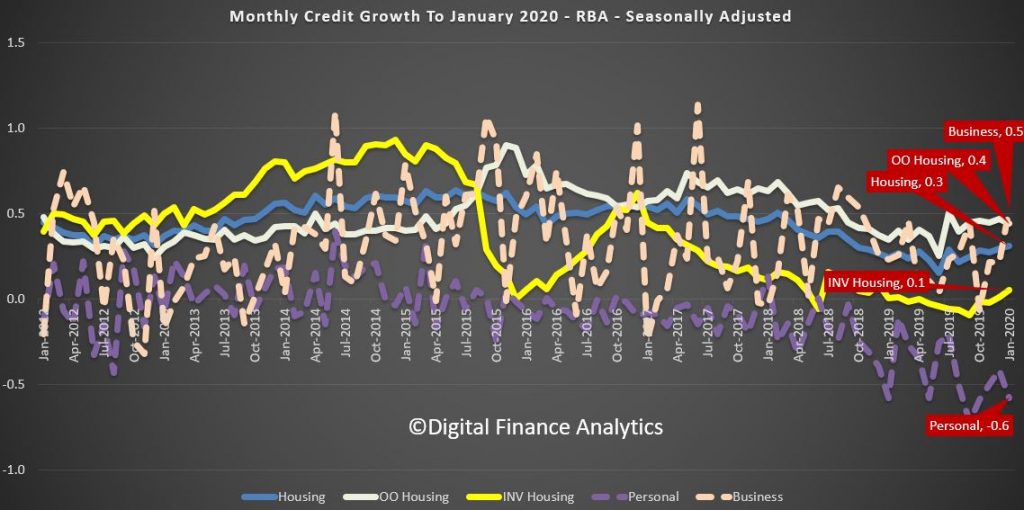
The monthly series are always noisy, and the RBA seasonally adjusts the results without explanation, so we have to take their word for the results.
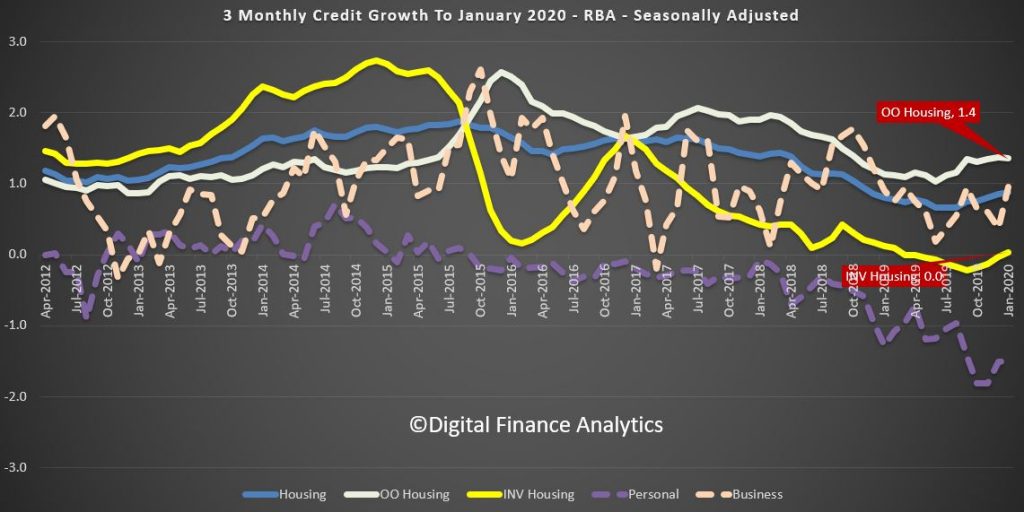
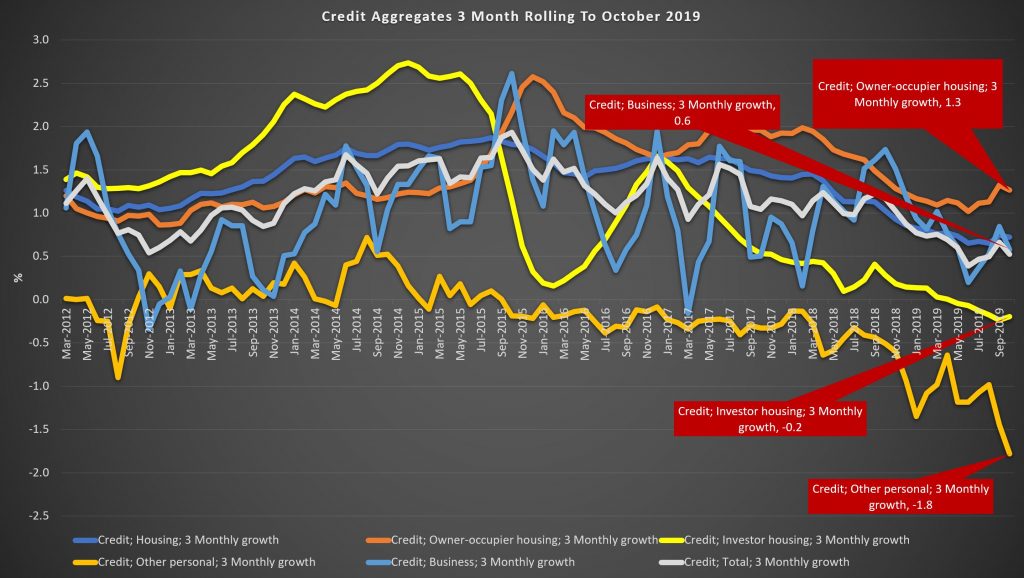
The 3 month rolling series shows a small uptick in investment lending to zero percent, while owner occupied lending was up to 1.4%, so weak growth only. Business was a little stronger, and personal credit fell at a slower rate of minus 1.5%.
The broader credit and money supply metrics showed that over the past year total credit rose at 2.5%, slightly higher than last month, while broad money fell a little to 4.2%
Overall the credit weakness continues to bite. We will see what the new loan data tells us when its released in a couple of weeks, as the net weak numbers could be masked by larger repayments from households seeking to deleverage in these uncertain times.
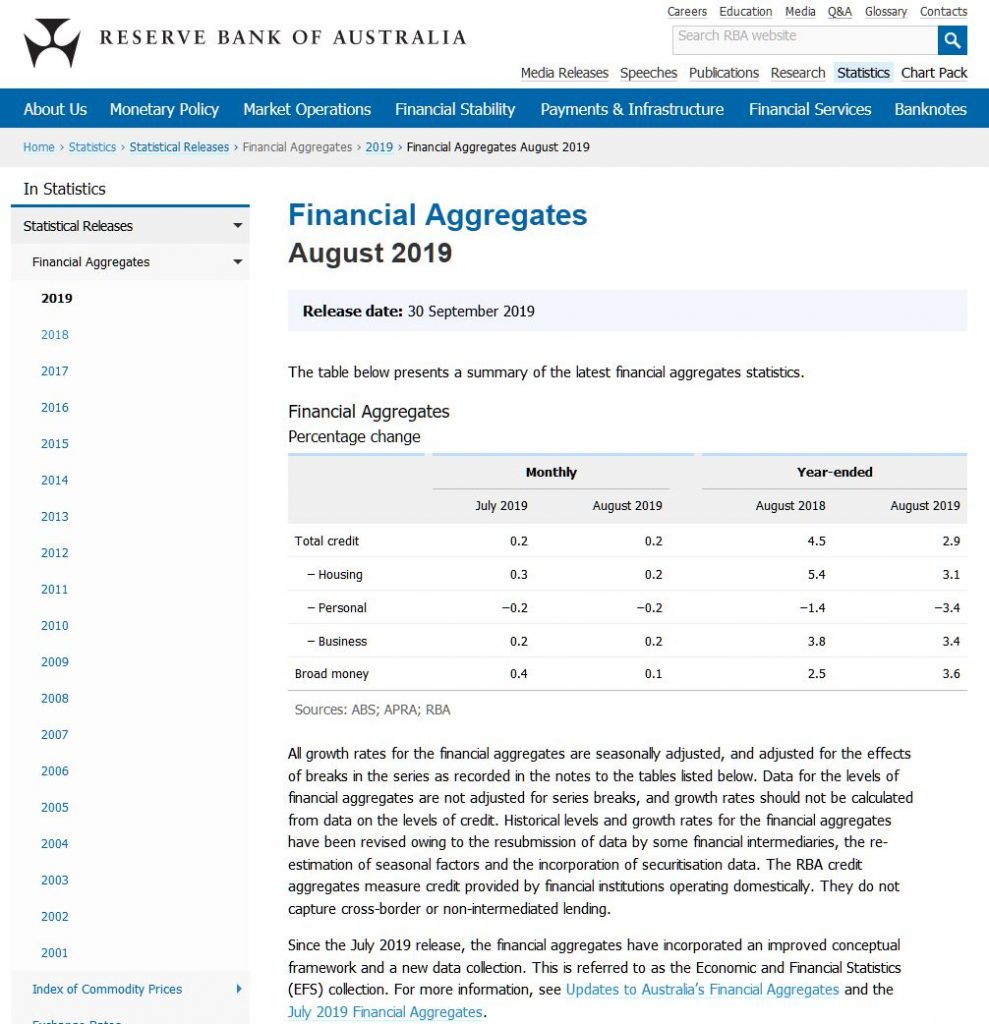
Finally the RBA notes:
All growth rates for the financial aggregates are seasonally adjusted, and adjusted for the effects of breaks in the series as recorded in the notes to the tables listed below. Data for the levels of financial aggregates are not adjusted for series breaks, and growth rates should not be calculated from data on the levels of credit. Historical levels and growth rates for the financial aggregates have been revised owing to the resubmission of data by some financial intermediaries, the re-estimation of seasonal factors and the incorporation of securitisation data. The RBA credit aggregates measure credit provided by financial institutions operating domestically. They do not capture cross-border or non-intermediated lending.
Since the July 2019 release, the financial aggregates have incorporated an improved conceptual framework and a new data collection. This is referred to as the Economic and Financial Statistics (EFS) collection. For more information, see Updates to Australia’s Financial Aggregates and the July 2019 Financial Aggregates.
The end of the working month heralds another set of credit stats from both the RBA and APRA. The RBA reports via their Credit Aggregates, which is all credit stock in the system, while APRA reports on the banks (ADI’s) and also provides some individual lender loan stock data. And which ever way you look at it, credit growth is still anaemic, as the “great deleveraging” continues. And given the weak credit impulse, home prices may also be growing more slowly than many are claiming, though that is another story, for another day.
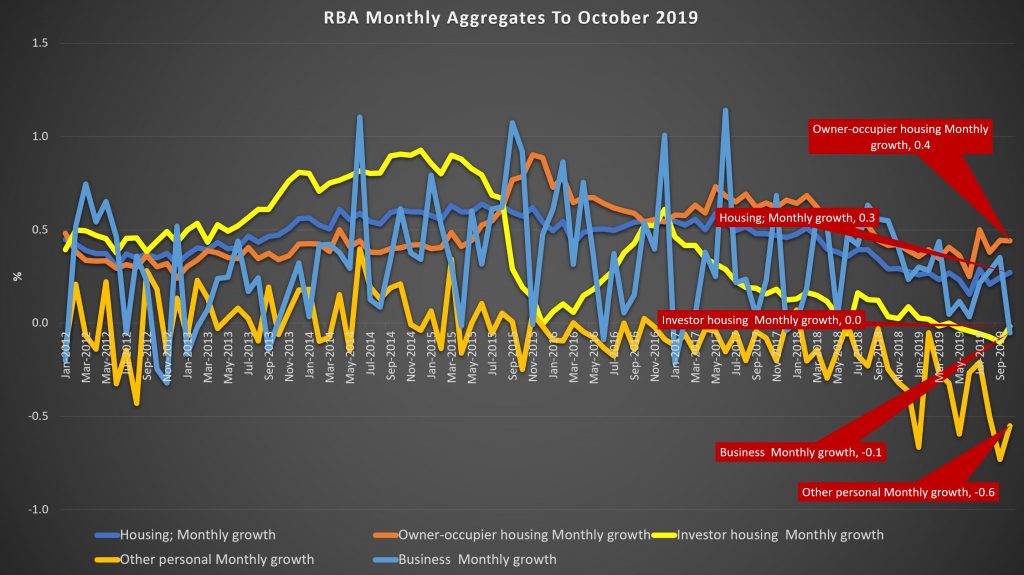
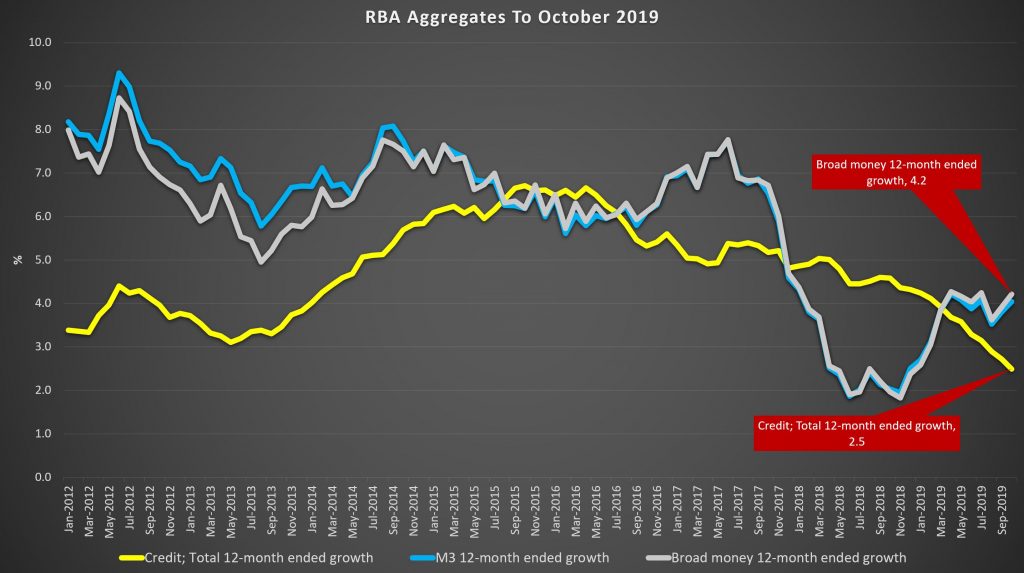
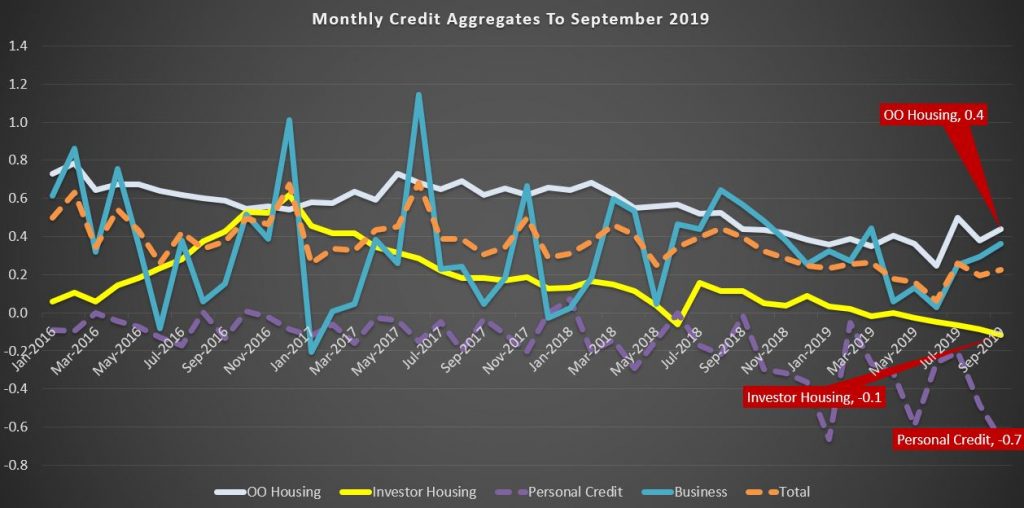
The RBA said that housing credit growth overall was 0.3% higher in October, compared with 0.2% in September. This translates to an annual rate of 3% to October (3.1% last month), compared with 5% just a year back.
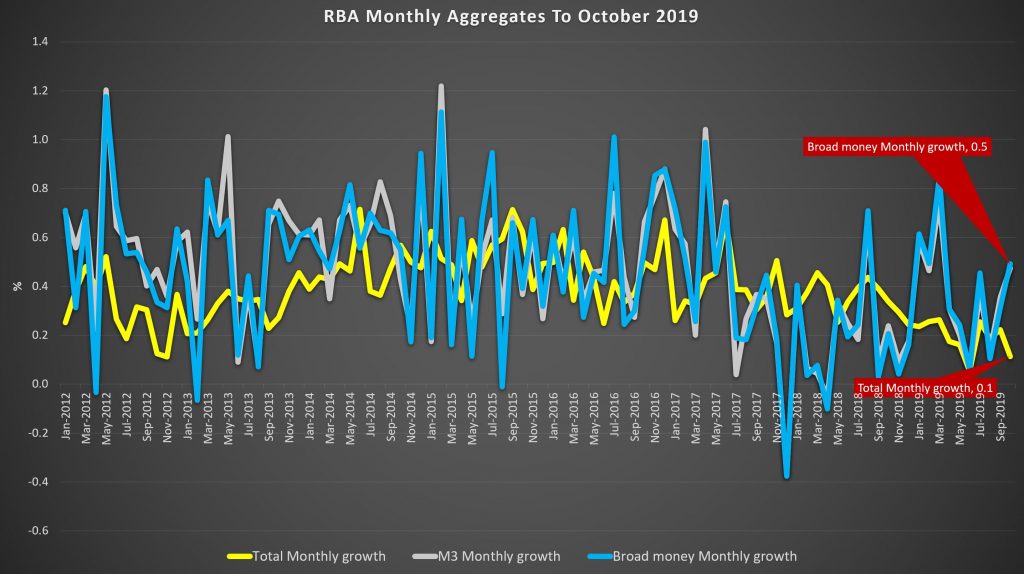
Monthly owner occupied lending rose 0.4% while investor housing lending was flat. Personal credit fell another 0.6% in the month, and business lending was down 0.1%. As a result total credit rose just 0.1%, down from 0.2% last month. Broad money was higher though.
Over a rolling 3 months view, owner occupied credit grew 1.3% while investor credit was down 0.2%, other personal credit was down 1.8% and business credit was up 0.6%.
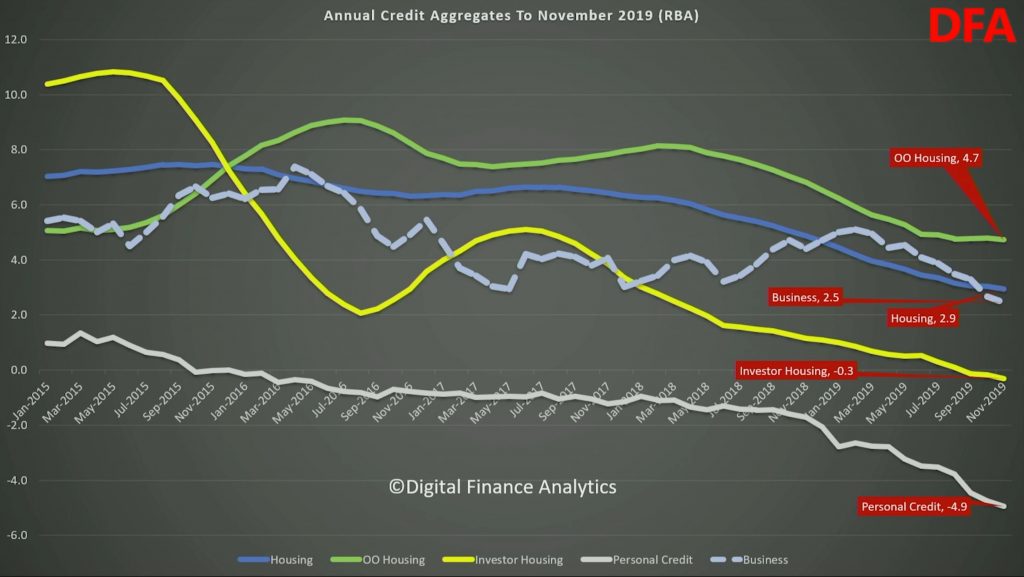
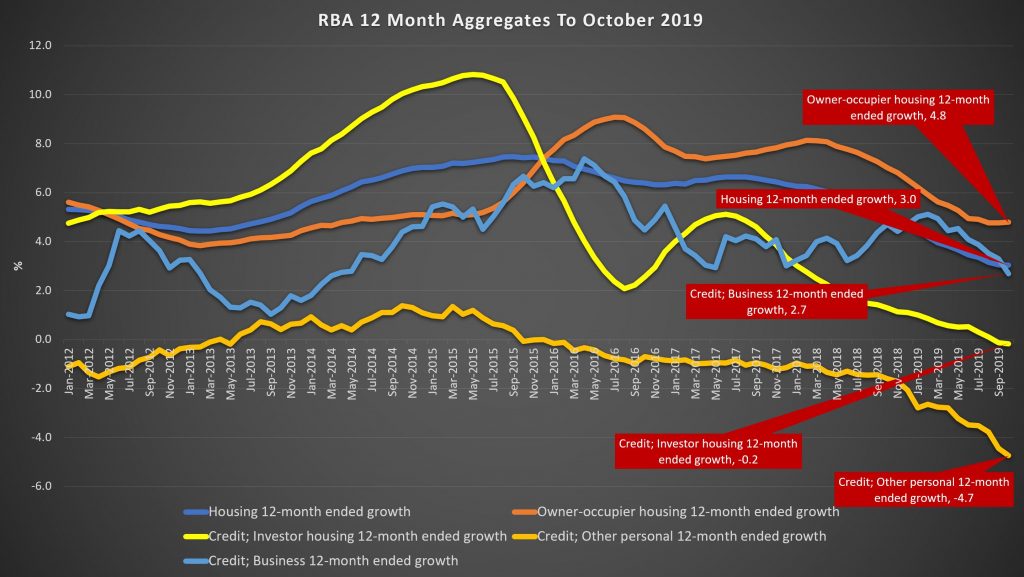
Looking across the rolling 12 month view, housing credit growth dropped from 3.1% to 3%, with owner occupied lending at 4.8% and investor lending down 0.2%. Business credit was 2.7% higher, and personal credit dropped by 4.7%.
As a result, total credit was just 2.5%, as lower as its been for many years, although broad money rose 4.2%.
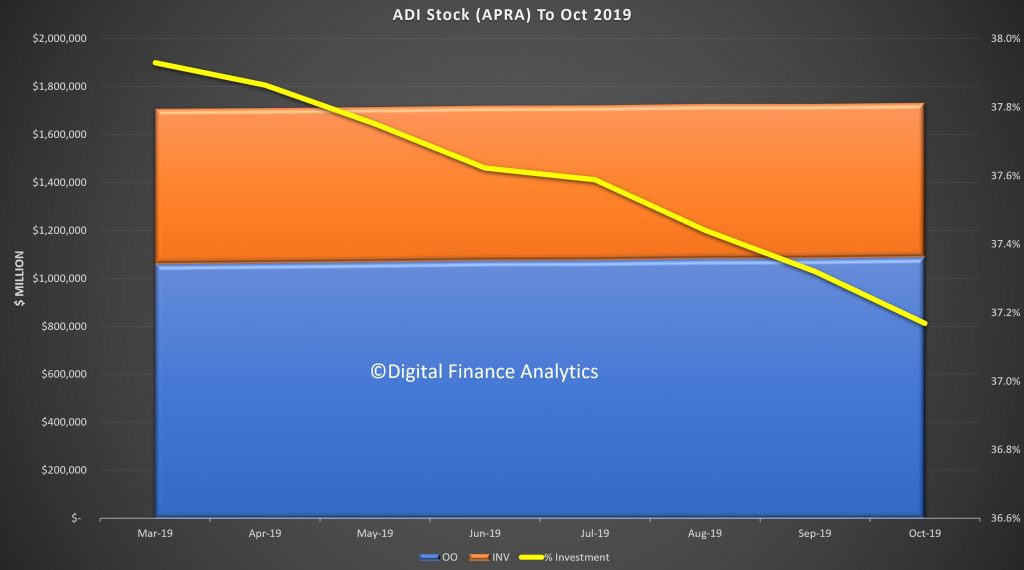
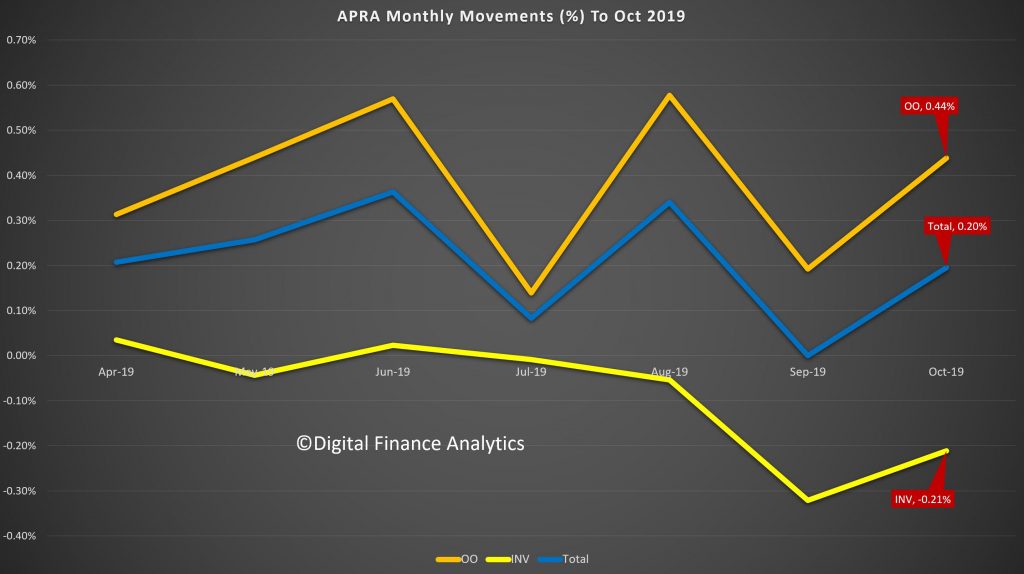
APRA’s new data series continues to contain some surprises. Total lending stock by the banks rose to $1.73 trillion, up 0.2% in the month.
The share of investor loans continues to fall, to around 37.2%, and this is explained by investor loan stock falling by 0.21% in the month, compared with a rise of 0.44% for owner occupied loans. The series still looks a bit weird, so we wonder if there are still reporting issues.
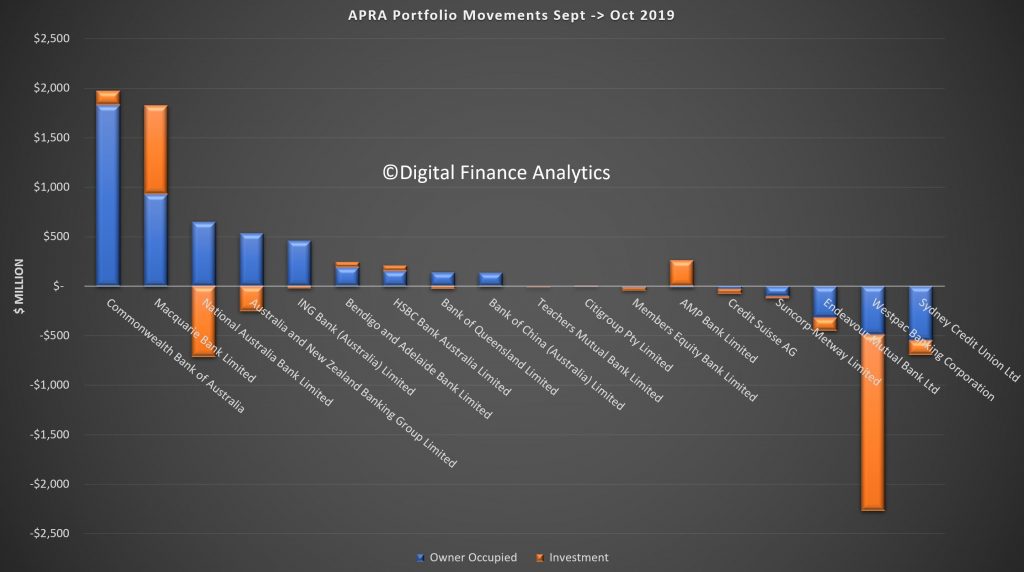
The individual banks stocks of loans varied, with CBA extending their book (consistent with our industry research, as one of the easier lenders at the moment), along with Macquarie – both of which grew both investor and owner occupied pools. NAB and ANZ dropped investor loans, but extended owner occupied loans. But Suncorp and Westpac dropped BOTH investor and owner occupied loan balances (assuming the reporting is correct – lets see if we get a reversal next month).
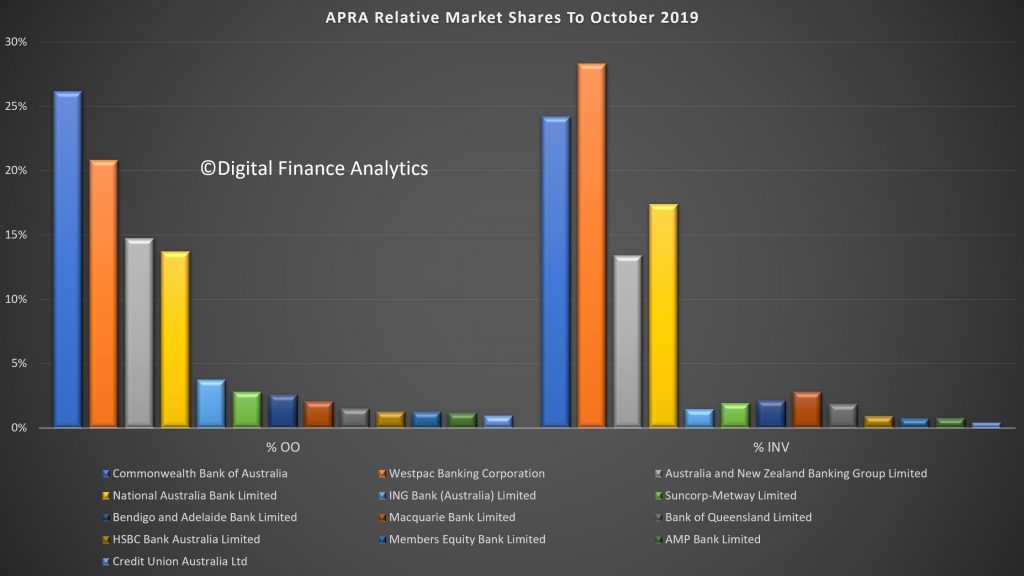
Finally, market shares hardly changed, with CBA the largest owner occupied lender and Westpac the largest investor loan provider.
Given the weak credit growth, this puts into sharp contrast the reported rises in home prices. We know transaction volumes remain low, but our industry contacts indicate a stronger pipeline of applications. Despite this the run-off of existing loans is translating to low net growth.
Even then, loan growth is still strong relative to income growth. But actually the most significant element is the fall in business credit, as more sectors come under pressure.
These results appear to be at odds with the RBA’s glass half full view of the economy, and may indicate more weakness in the GDP out-turn next week.
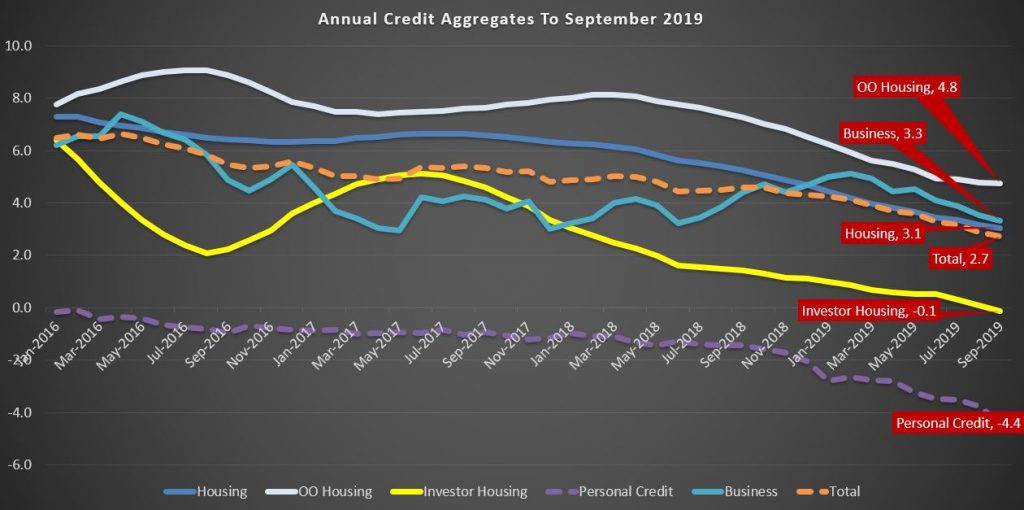
We are getting to the rub now with the RBA releasing its Credit Aggregate data to end September 2019. This is loan stock data, reflecting the net effect of new loans coming on, old loans repaid, refinancing, and any reclassification which occurred in the month.
Over the month of September, total credit grew by 0.2%, with housing also at 0.2%, business at 0.4% and personal credit down another 0.7%. Owner occupied lending was a little firmer, but investment lending faded again.
For the year ending, total credit grew by 2.7%, the lowest since June 2011, Housing at 3.1%, the lowest at least since 1977, and business at 3.3%. Personal credit fell 4.4% over the year.
Given the strong link between home prices and housing credit, this suggests home prices will continue weaker ahead. And this, after all the recent adjustments to lending standards and rates.
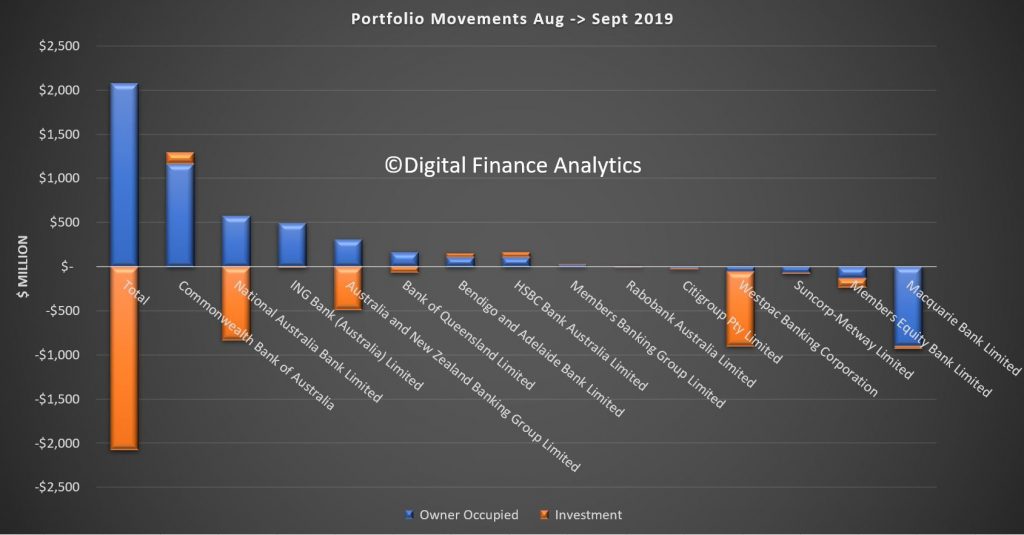
The APRA data also shows some swings between lenders during the month (or reclassification, we cannot tell). NAB, ANZ and Westpac all dropped their investment loan balances, while Macquarie dropped their owner occupied loans.
Both the RBA and APRA released their respective credit aggregates to end August today. And its not running to script, despite the rate cuts, some stronger buying signs in some housing markets (but on low, low volumes), and increased competition for loans. Overall credit growth rates continue to decline.
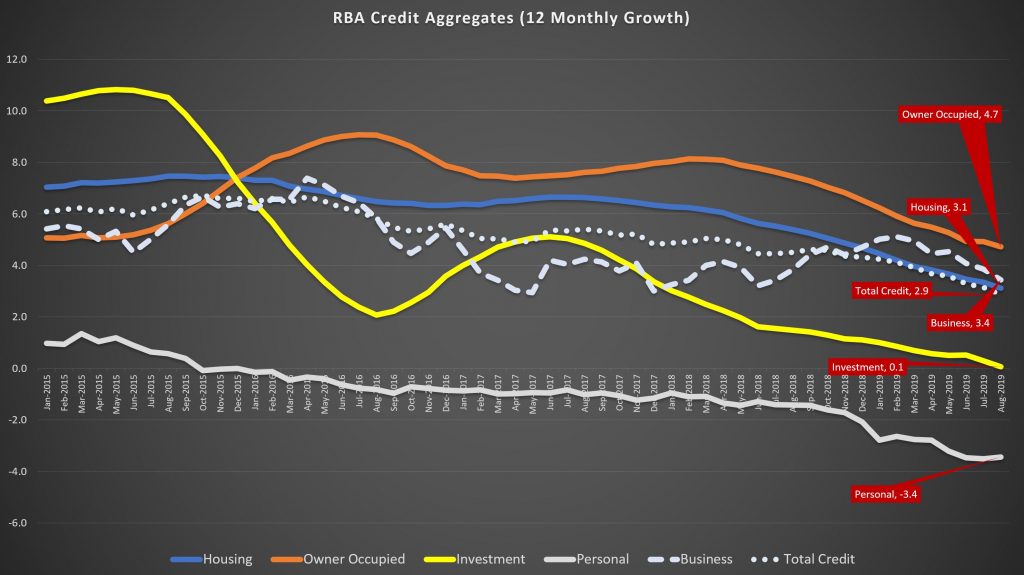
The RBA data over the rolling 12 months showed that credit growth dropped to 2.9%, compared with 4.5% just one year ago. That is the slowest rate of growth since 2011. It peaked in 2015 at 6.6%.
Housing sector growth rose 3.1% over 12 months, compared with 5.4% a year back and from a high of 7.4% back in 2015. Within that owner occupied lending fell to 4.7%, compared with 9.1% back in 2016, and investment lending rose at just 0.1% over 12 months, compared with 10.8% back in May 2015.
Business credit growth eased back to 3.4% annualised, from 3.8% a year ago, and 7.4% back in 2016, reflecting weaker business confidence and concerns about the local and international economic outlook.
Annual personal credit is down 3.4%, compared with down 1.4% a year ago, and up 0.3% in 2015.
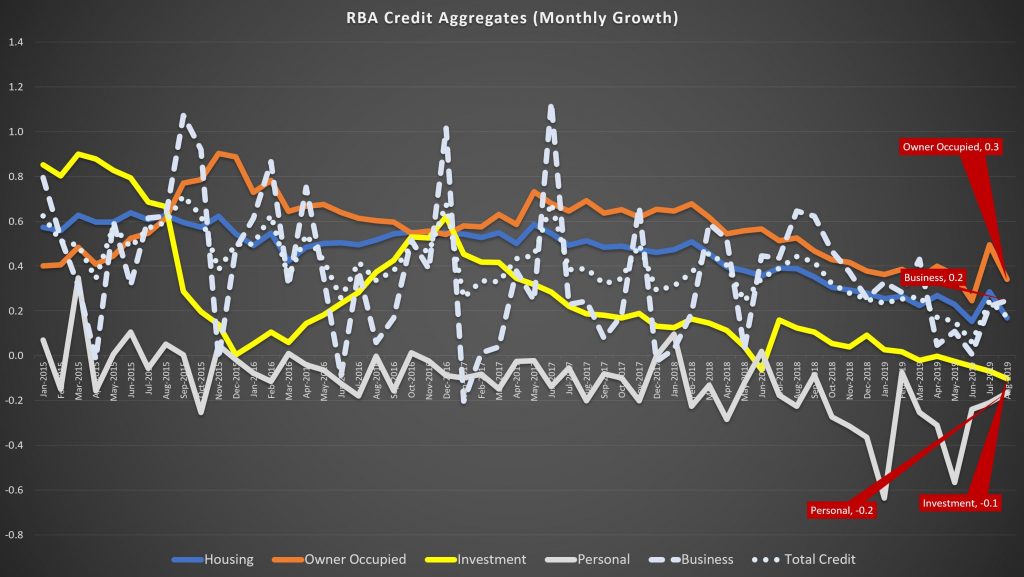
The more noisy one month series shows that owner occupied lending rose 0.3%, compared with 0.9% in 2015, investment lending fell 0.1%, compared with a rise of 0.9% in 2015, business credit rose 0.2%, way lower than peaks of more than 1% in 2015 and 2017, and personal credit fell 0.2% again.
Note the RBA makes seasonal adjustments to the data – though they do not disclose the basis of these adjustment, and this year has been far from typical.
They also say:
Historical levels and growth rates for the financial aggregates have been revised owing to the resubmission of data by some financial intermediaries, the re-estimation of seasonal factors and the incorporation of securitisation data. The RBA credit aggregates measure credit provided by financial institutions operating domestically. They do not capture cross-border or non-intermediated lending.
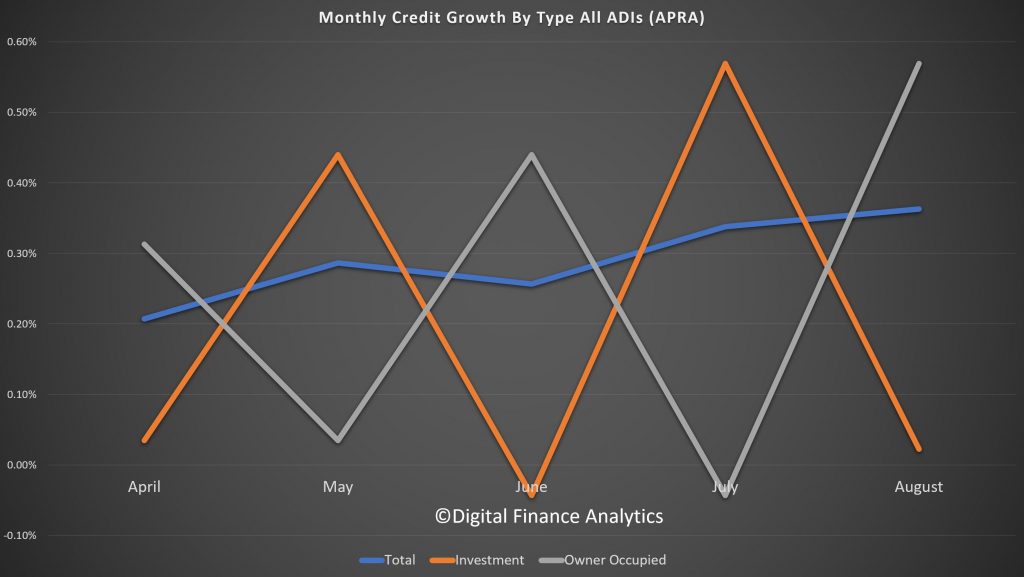
So more data noise. And talking of that the new APRA data is all over the shop. They started running a parallel series in March, and as we discussed last month, the proportion of investment loans in the stock data have risen.
Overall credit stock of housing loans for the ADI’s is running at 0.36% and appears to be rising since April. However, the swings between growth in investor and owner occupied loans are massive, (and in opposite directions). This is not a sign of good data collection in my view.
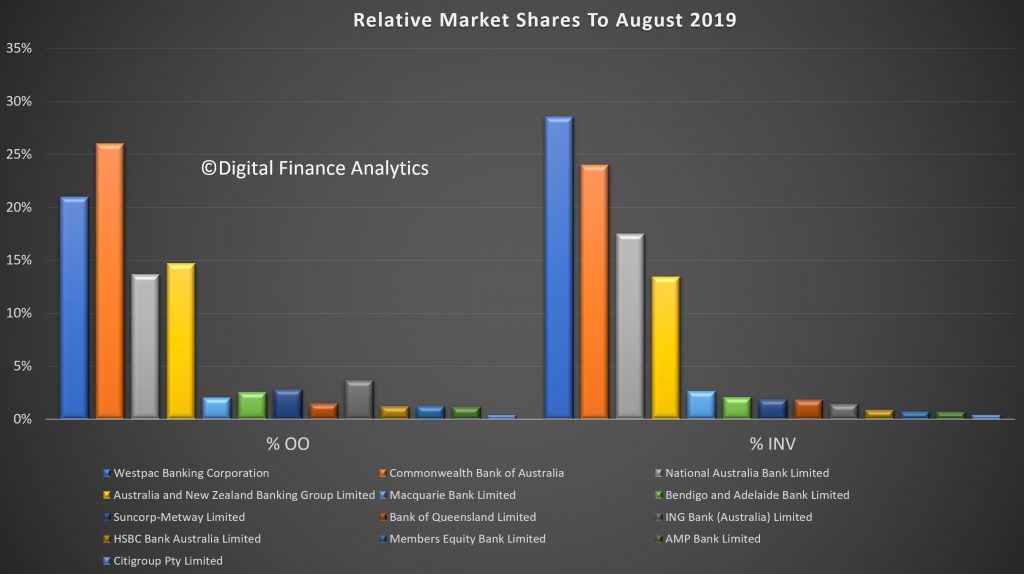
The overall portfolio market shares indicate that CBA remains the largest lender for owner occupied loans, with a 26.1% share, followed by Westpac 21%, and ANZ at 14.7%. In investment lending, Westpac remains a clear leader, with 28.6% of all lending, followed by CBA at 24% and NAB at 17.5%.
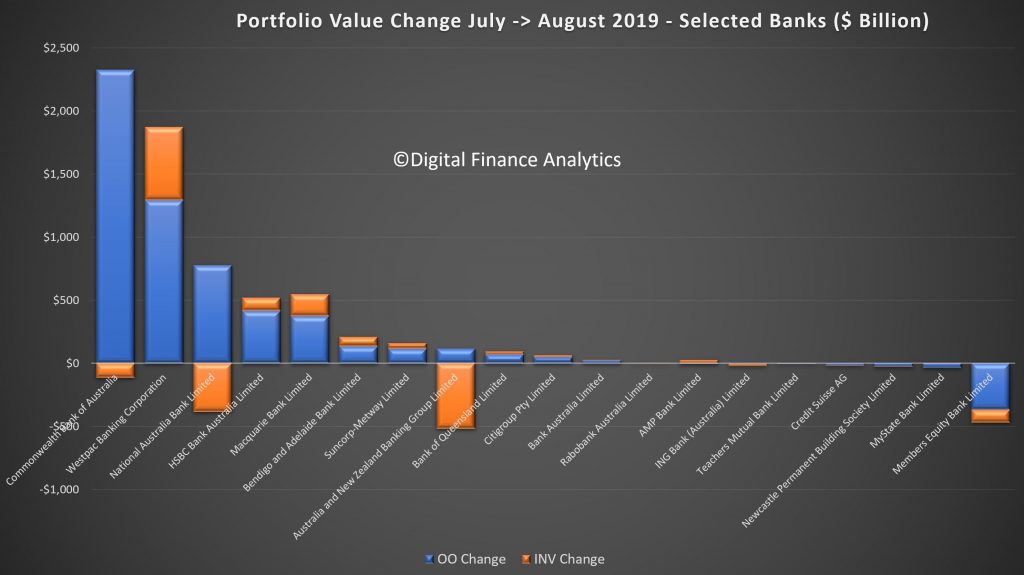
The monthly movements tells an interesting story, with CBA driving the largest growth in owner occupied loans (2.3 billion), while dropping investment loans by a small amount. Westpac extended its investment loans by $0.6 billion, and owner occupied loans by $1.3 billion. NAB and ANZ both lost investor share and ME Bank lost owner occupied and investor loans. Other lenders picked some of these up.
Finally, our analysis of the proportion of individual bank portfolios in investment loans (generally more risky in a down-turn), shows that 44.9% of Westpac’s portfolio is investment lending (worth $185 billion), compared with an ADI market average of 37.4%. NAB is at 43.4% and Macquarie at 43.7% and Bank of Queensland at 42.7%. On the other hand CBA is at 35.6% and ANZ at 35.3%.
Data from our surveys suggests weakening demand for credit, and if this eventuates, it is quite possible recent home prices will be confirmed as a bear trap. While some down traders and more affluent households are in the market, many other segments are sitting this one out.
Remember that falling credit growth will translate to falling home prices, the math is that simple. And more rate cuts won’t help much at all!

 Blog")