Credit Growth Remains In The Doldrums

The RBA released their data to end of July today . Off the bat in should be noted they made a number of reporting changes, and the growth rates have been “adjusted” as well as applying seasonal adjustments (we assume based on earlier years, though this year might be unique!).

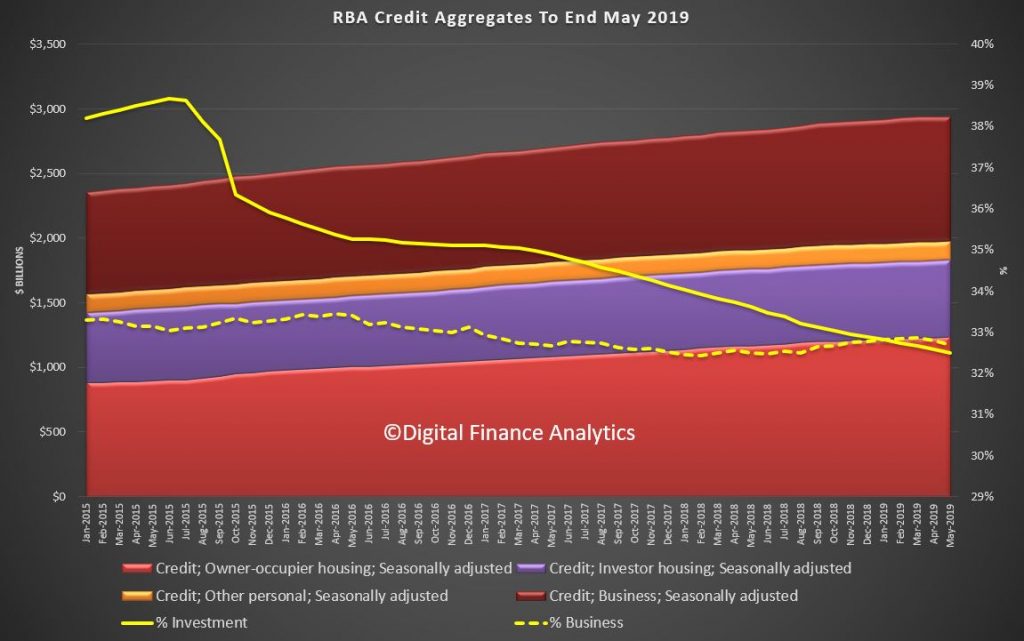
This data shows the total domestic lending commitments (allowing for new loans written, old loans repaid or refinanced – so this is net stock movements.

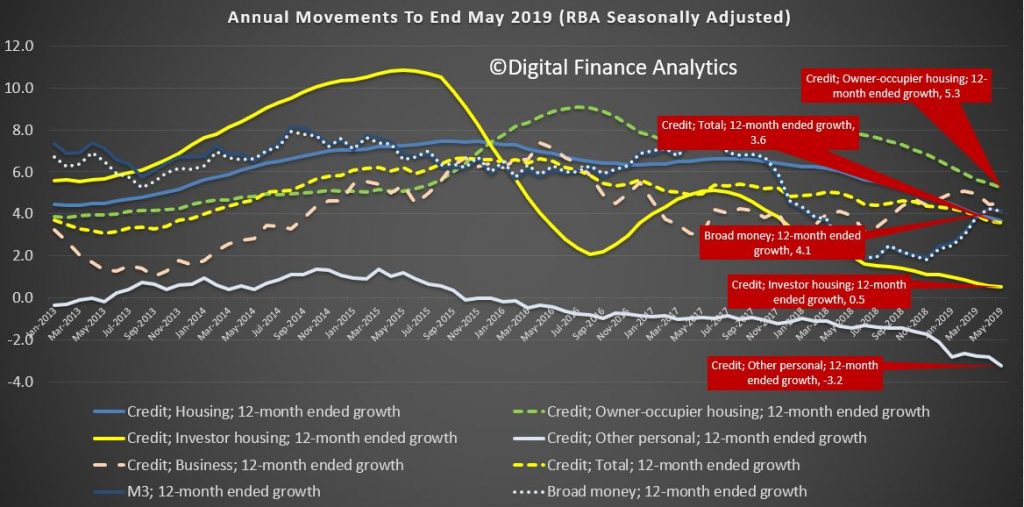
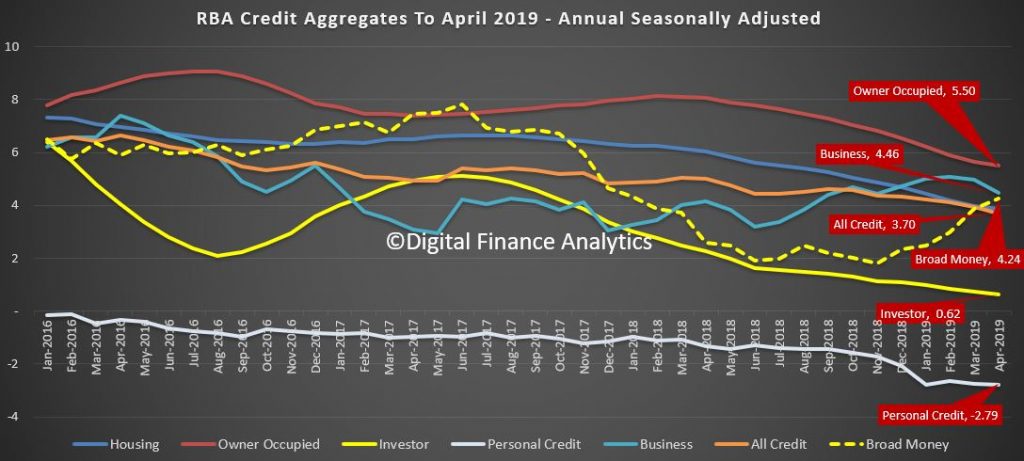
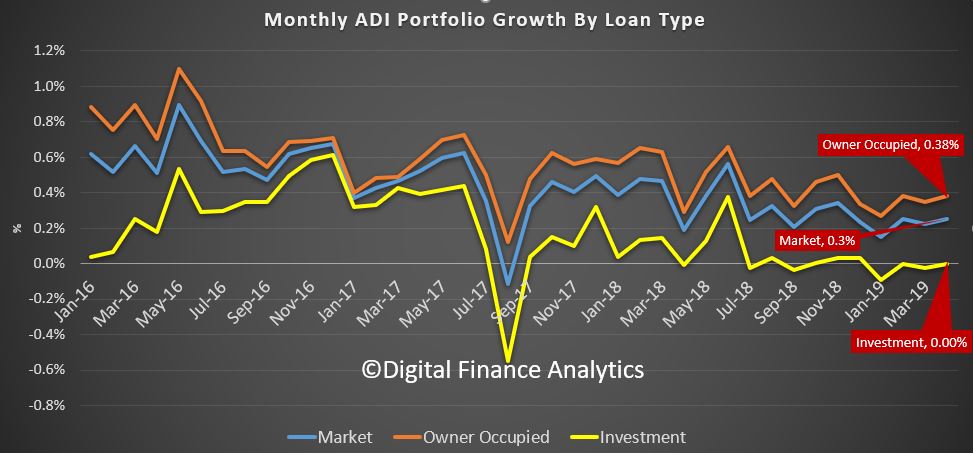
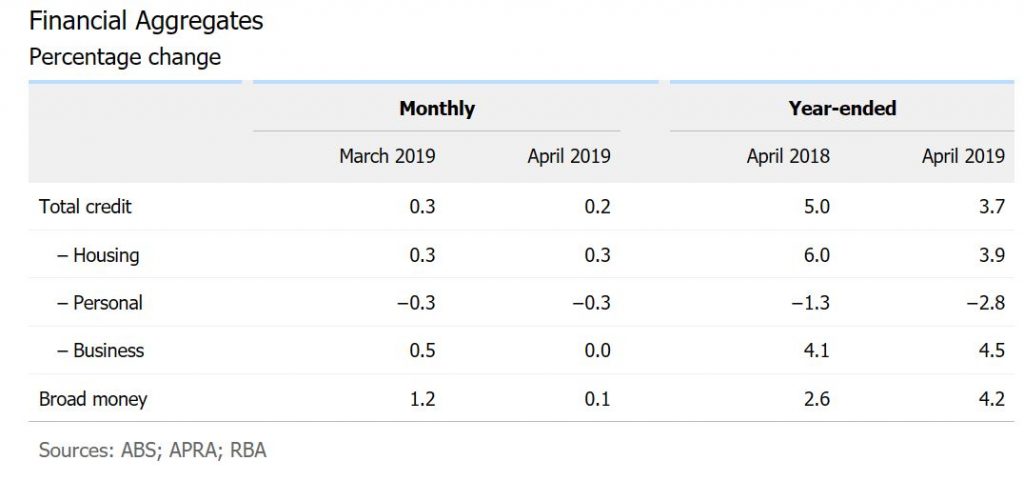
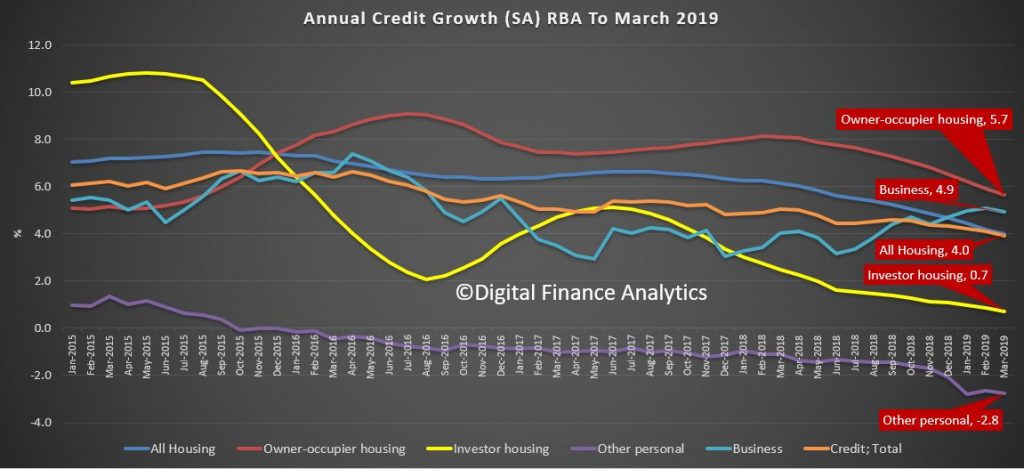
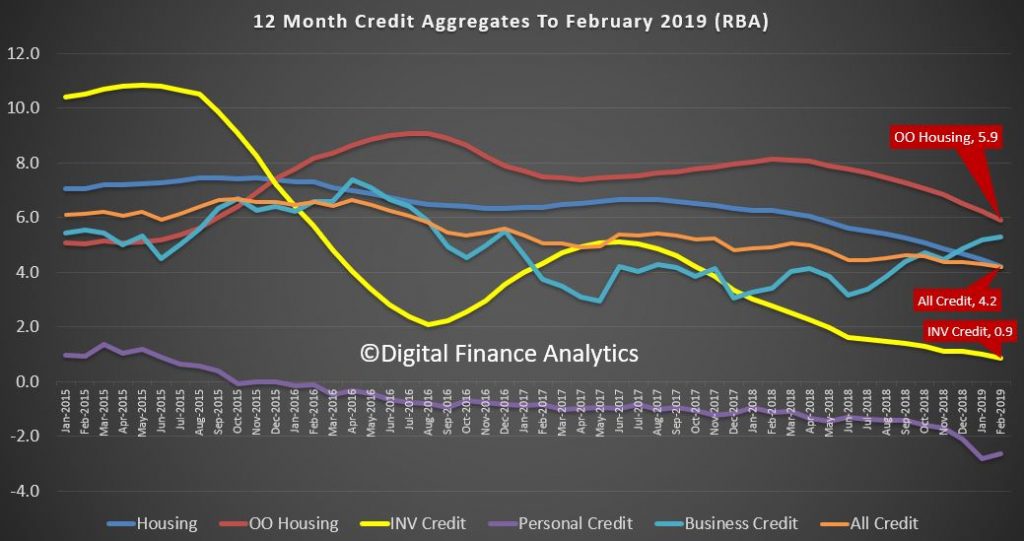
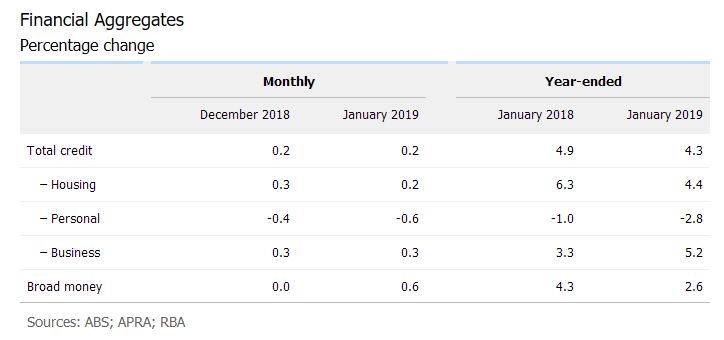
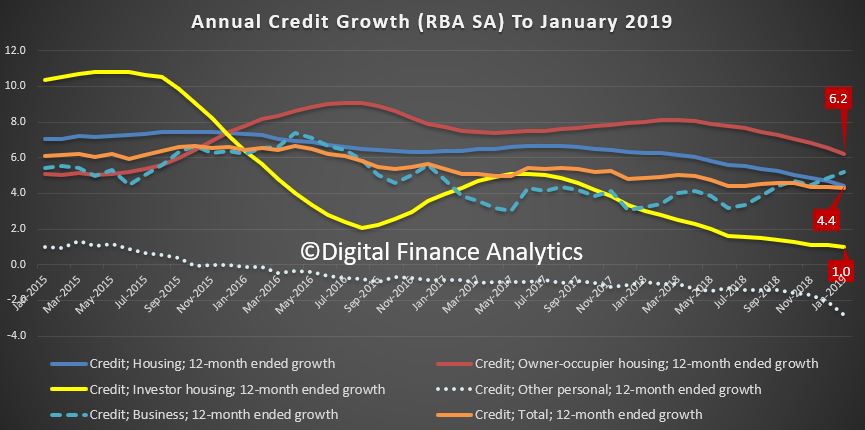
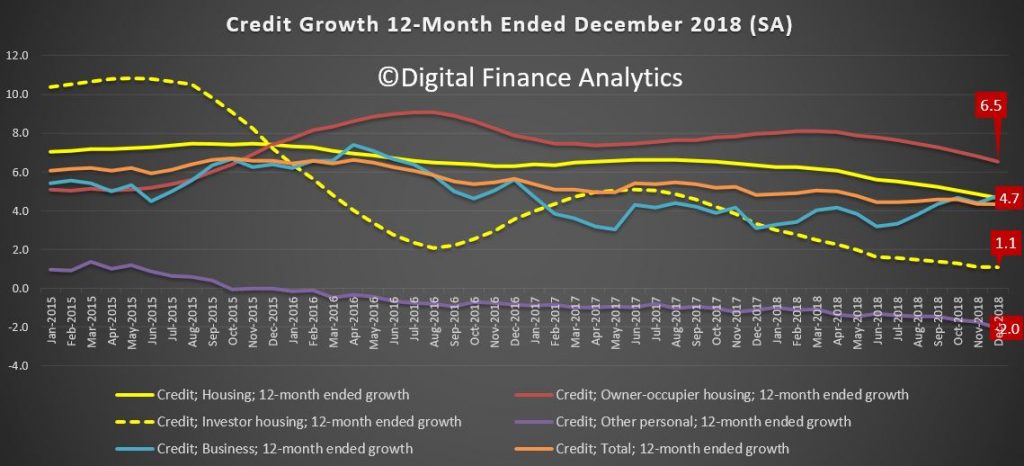
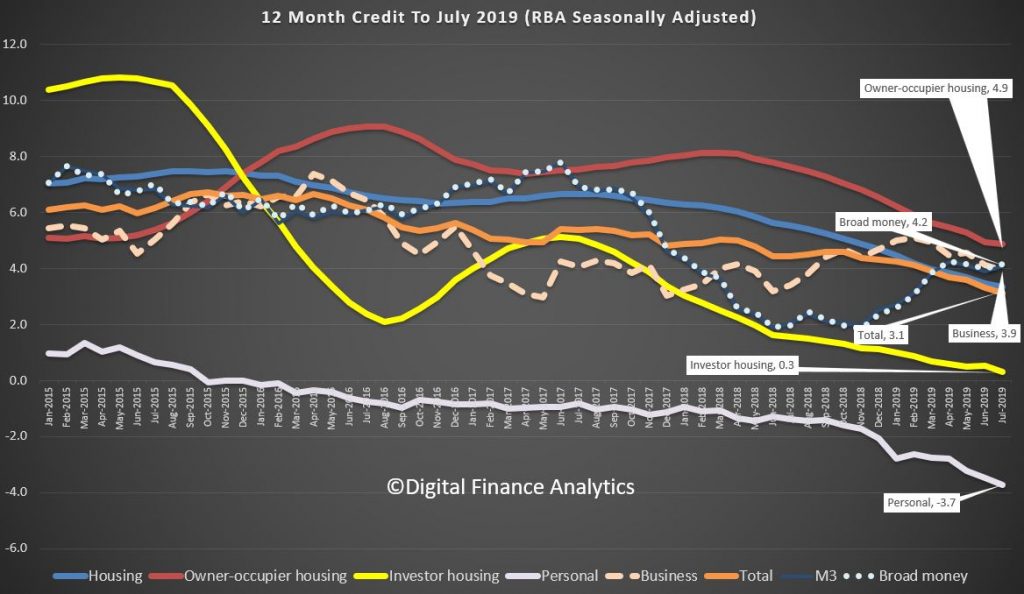
In the D1 data we see that owner occupied lending growth for the past 12 months fell again, down to 4.9%, investment housing lending was down to 0.3%, and so total housing growth fell from 3.5% to 3.3%, another record low. Business lending grew at 3.9% over the past 12 months. Personal lending fell 3.7% and total credit grew 3.1%.

So no evidence of any pick-up on these annualised numbers.

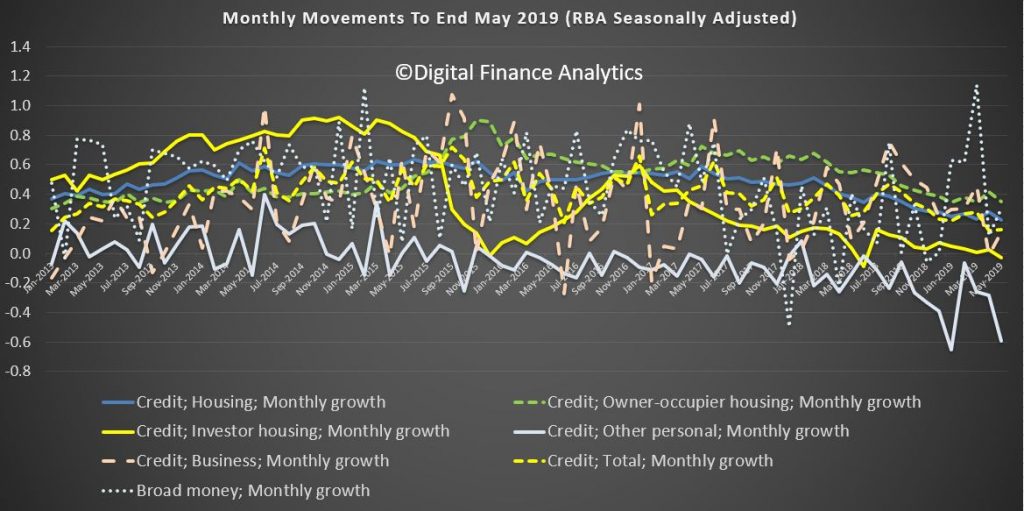
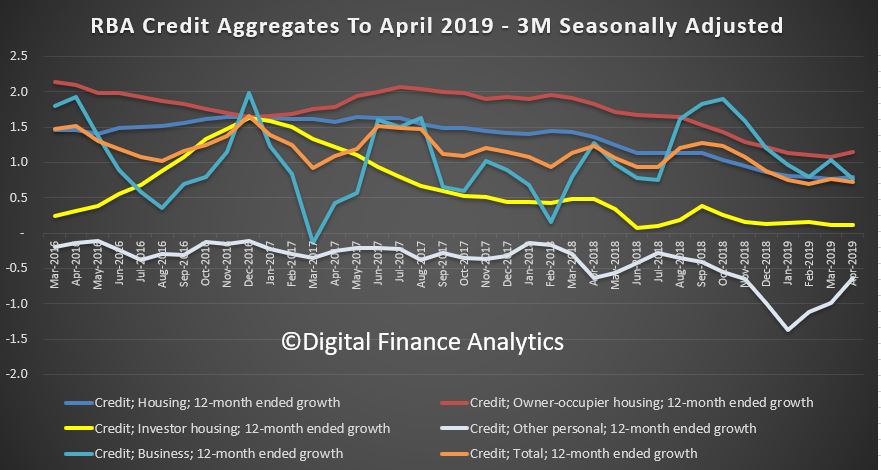
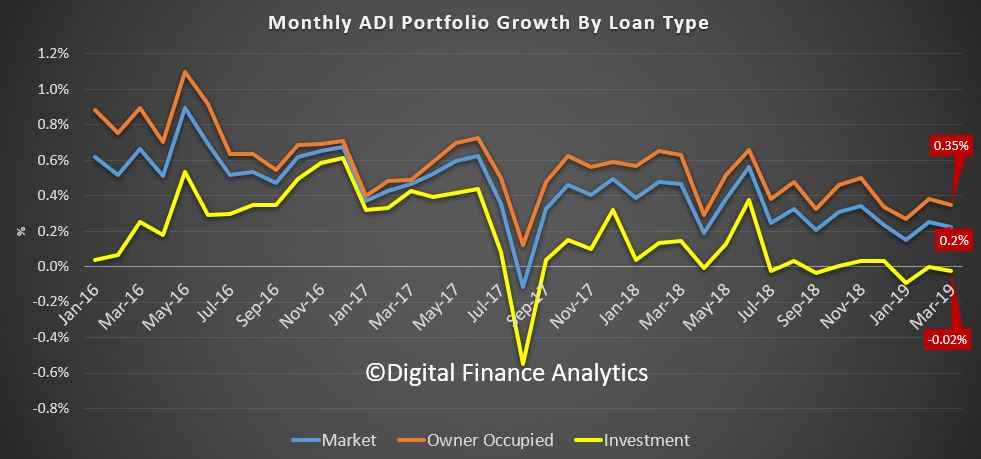
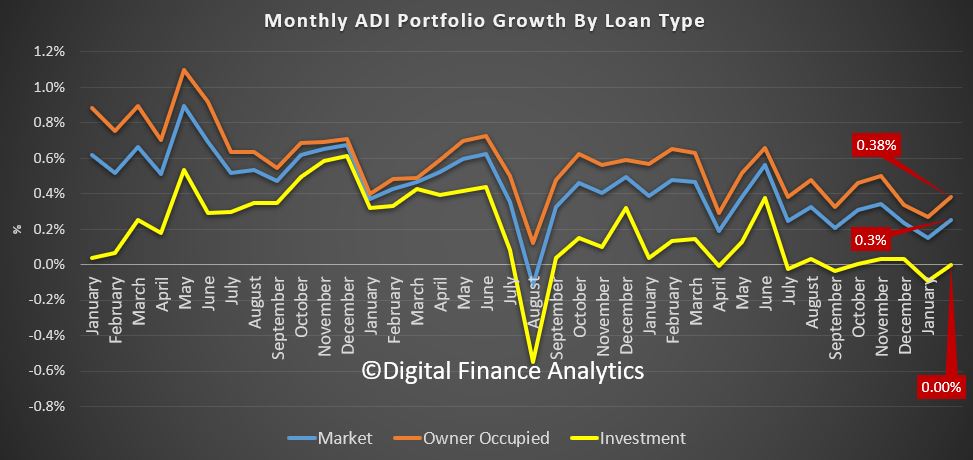
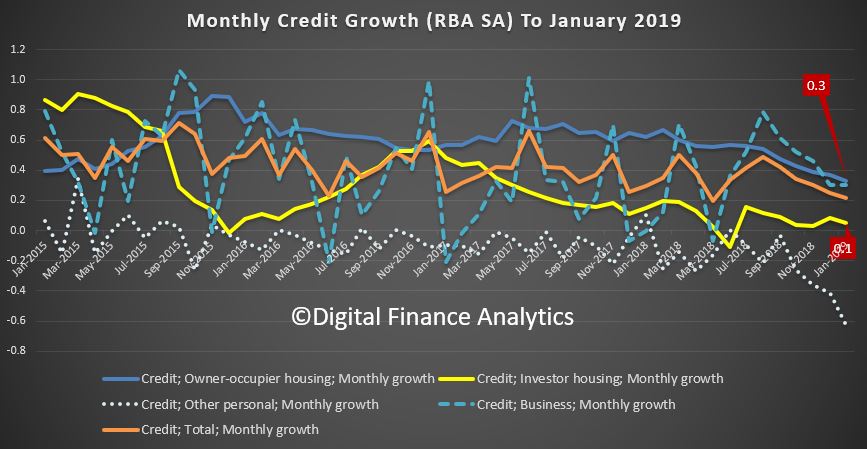
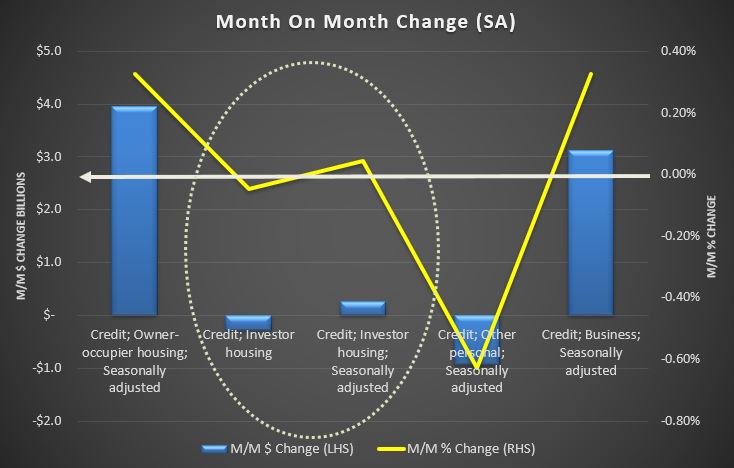
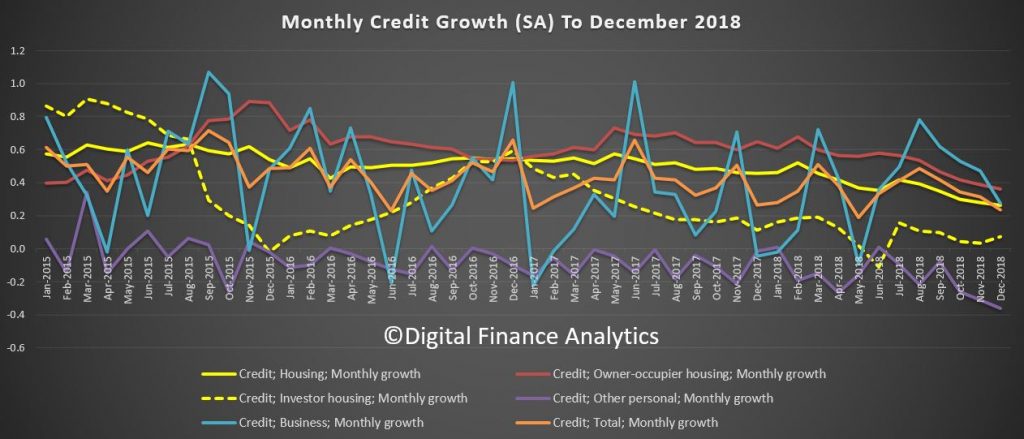
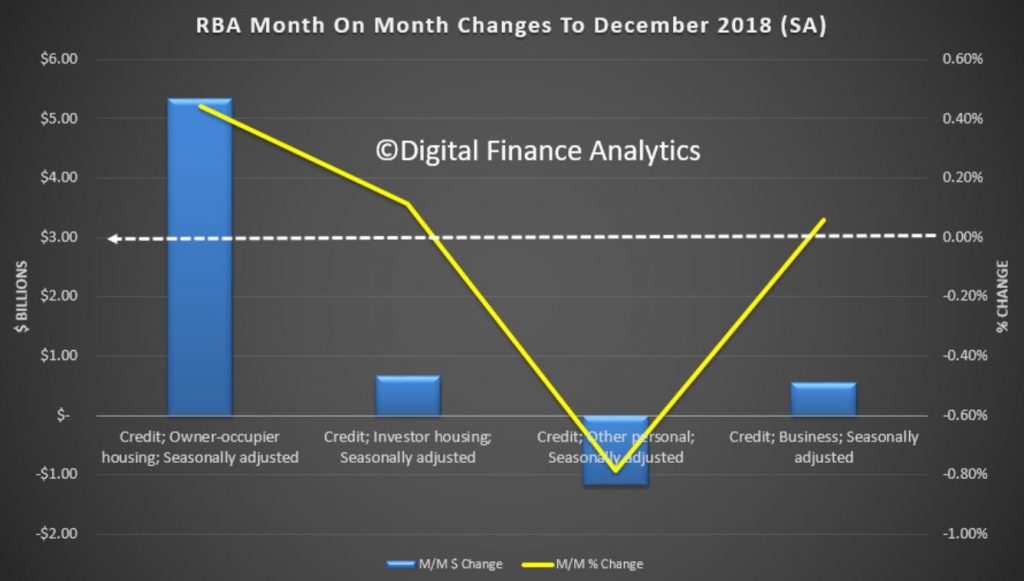
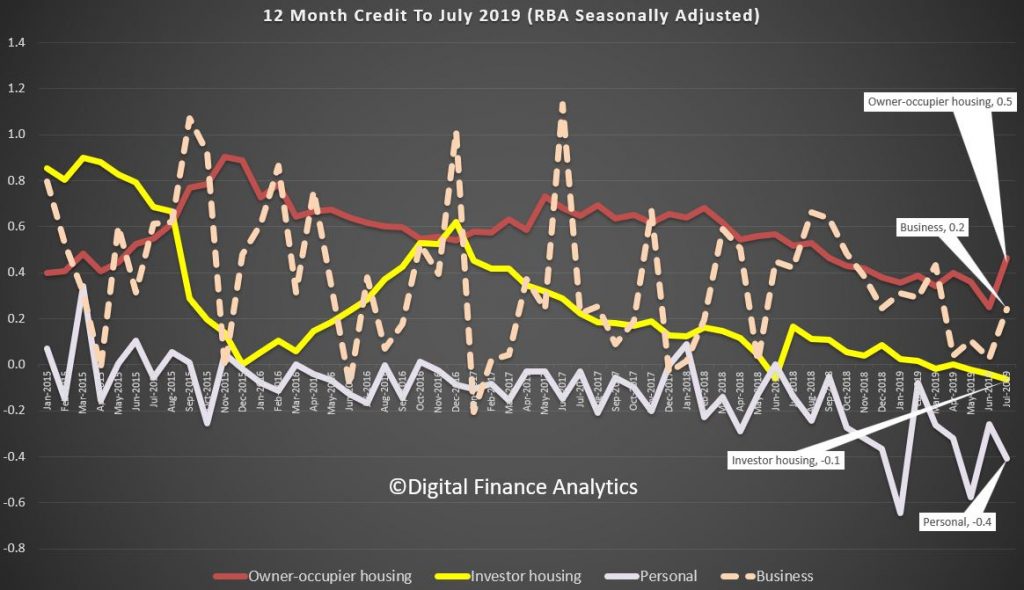
The one month numbers show a small rise in owner occupied loans from 0.2% last month, to 0.5%, a level last seen in September. Investment lending fell down 0.1%. Personal credit fell 0.4% from the previous month, and business lending up from 0.0% to 0.2%. Even with those of the bullish disposition, this is weak. And this data is always noisy, so there is really little to see which signals an improvement.

So, its true to say there is little evidence to show the stimulus from lower cash rates, or APRA’s loosening has made any substantive difference – which by the way chimes with our recent household surveys. Which begs the question, where then are the supposed home price rises coming from. Perhaps the ABS flow data in a few days will tell us more. But I remain skeptical. On any basis, property investors are sitting out still.

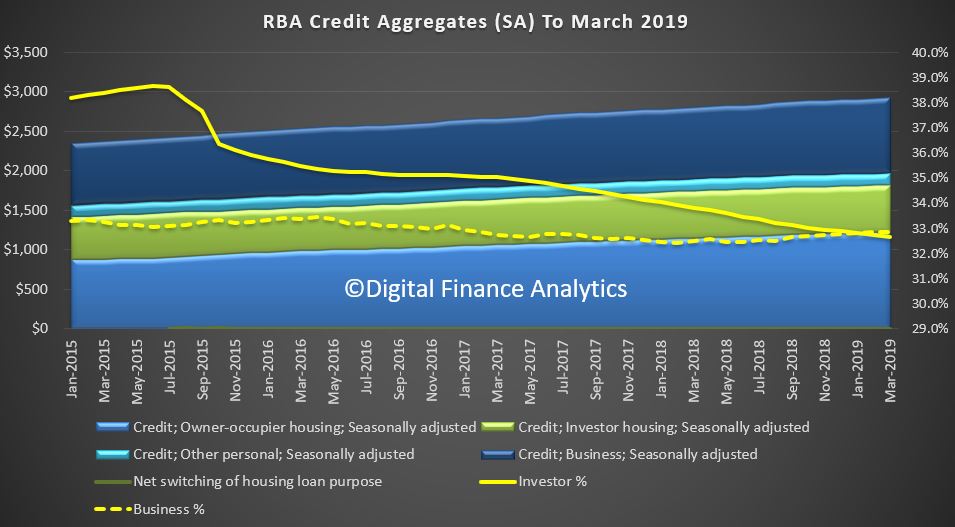
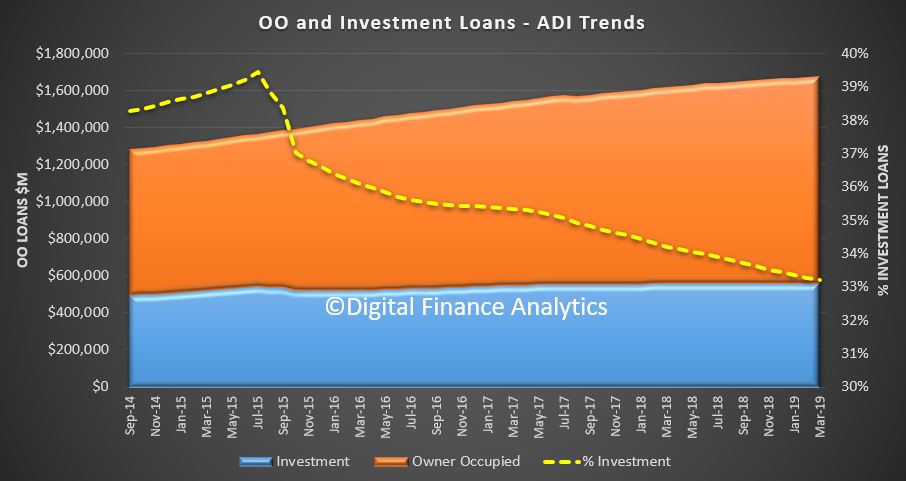
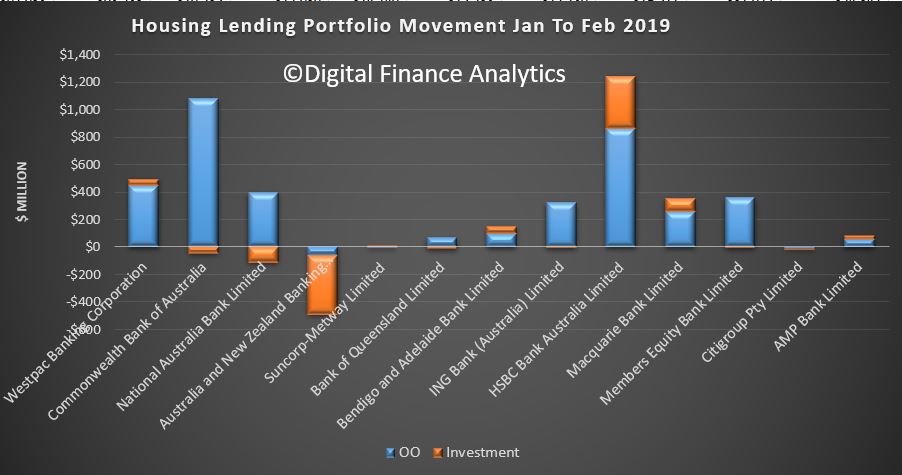
But we also know the RBA has done some heavy tweaking to the data. This is because the raw D2 data shows big swings between owner occupied and investment lending between June and July, thanks to their revisions. This is what they say:

From this release onward, the financial aggregates incorporate an improved conceptual framework and a new data collection. This is referred to as the Economic and Financial Statistics (EFS) collection. For more information, see Updates to Australia’s Financial Aggregates. All growth rates have been adjusted for the effects of series breaks resulting from these changes. Minor revisions to the historical growth rates of the financial aggregates reflect improvements in the RBA’s seasonal adjustment processes. Revisions to the historical growth rates of the money aggregates – specifically M3 and Broad Money – also reflect methodological improvements to their production.

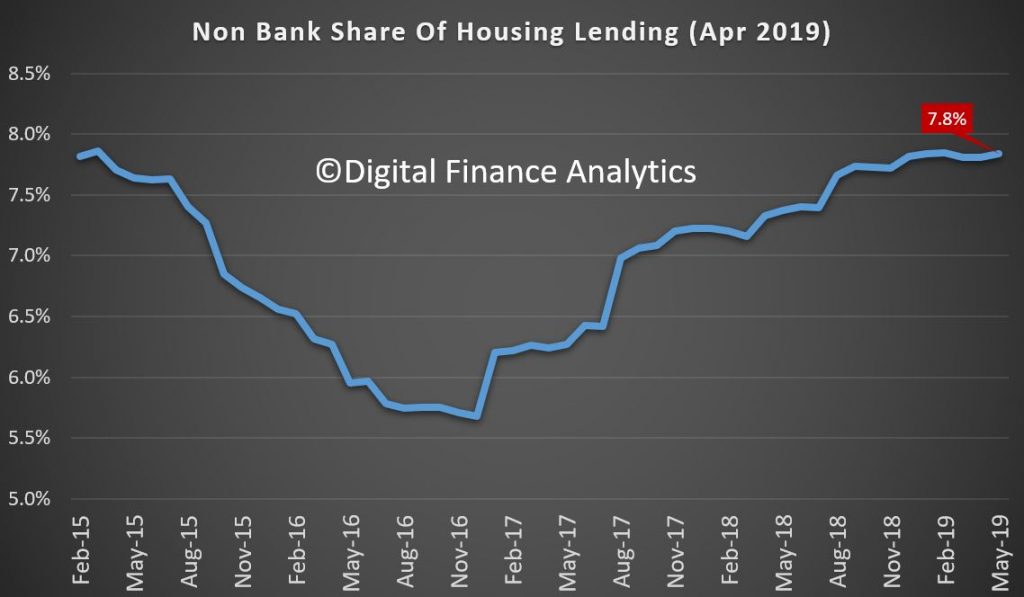
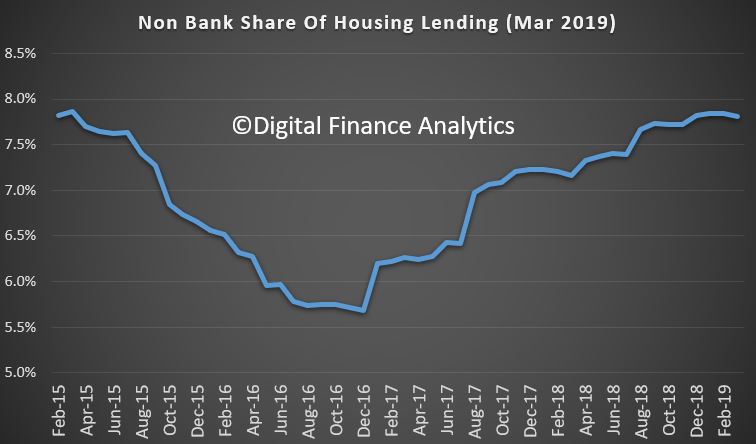
The implementation of the EFS collection has led to larger-than-usual movements in the levels of the outstanding stocks of series published in the table Lending and Credit Aggregates – D2 between June and July 2019. In particular, the EFS collection seeks to resolve ambiguity about the classification of finance according to its purpose and residency. The sample of entities participating in the collection has also changed and the measurement of housing credit extended by non-authorised deposit-taking institutions has improved. Some of the key changes resulting from the EFS collection are reclassifications between: owner-occupier housing loans and investor housing loans; housing loans and other personal loans; and loans to residents and loans to non-residents (loans to non-residents are not included in the credit aggregates). In combination, these changes have led to: decreases in the levels of total credit, business credit, housing credit and owner-occupier housing credit; and increases in the levels of other personal credit and investor housing credit. In contrast to the published growth rates, the levels of the credit aggregates are not adjusted for series breaks. Growth rates should not be calculated from data on the levels of credit.

The table Monetary Aggregates – D3 has changed; for more information, please see the change notice published on 31 July 2019. The history of M1 has been revised to include all transaction deposits, whereas previously some of these deposits were only included in M3. The history of M3 and Broad Money has also been revised, reflecting minor conceptual changes. Beyond these historical revisions, movements in transaction and non-transaction deposits between June and July 2019 are larger than usual. This is because the EFS collection used to compile the monetary aggregates more accurately classifies deposits by their type. The levels of the monetary aggregates are not adjusted for series breaks. Growth rates should not be calculated from data on the levels of money.

Owing to the EFS collection, ‘Net switching of housing loan purpose – from investor to owner-occupied within the same lender’ will now be published with a one-month delay.

As usual, all growth rates for the financial aggregates are seasonally adjusted, and adjusted for the effects of breaks in the series as recorded in the notes to the tables listed below. Data for the levels of financial aggregates are not adjusted for series breaks. The RBA credit aggregates measure credit provided by financial institutions operating domestically. They do not capture cross-border or non-intermediated lending.

More data noise in the machine. We will look at the APRA bank specific data in a later post.

Credit Growth As Weak As…. [Podcast]

We look at the latest lending statistics from both RBA and APRA. Not much evidence of a rebound so far!

Digital Finance Analytics (DFA) Blog
Credit Growth As Weak As.... [Podcast]
Loading
/

May 2019 Credit Weak As…

The RBA released their credit aggregates to May 2019 today, we already covered the APRA ADI series in an earlier post.

Seasonally adjusted owner occupied housing rose by 0.34% to $1.24 trillion dollars while investment lending slid 0.04% to $595 billion dollars, and comprises 32.5% of all household finance, in seasonally adjusted terms. Business lending was down 0.35% to $959.6 billion dollars and was 32.7% of credit, the lowest for the past six months. Personal credit fell again, down 0.59% to $145.8 billion dollars.

The monthly movements were quite volatile once again.

However the annual movements paint a clearer picture. Over the past year owner occupied lending rose 5.3%, investor lending rose just 0.5% while personal credit fell 3.2%. Business lending grew 4.5%. Broad money grew 4.1%, the earlier acceleration in the first past of the year has not been explained.

We can proxy the growth in the non bank sector by comparing the APRA and RBA dataset. Whilst only approximate, it does give a fair indication. Non-bank lending recorded an estimated 7.8% rise over the year, significantly higher than the ADI’s.

Overall growth in the non-bank, non-ADI sector for mortgages was an impressive 7.8% annualised.

Further analysis by category shows that owner occupied lending by non-banks rose 10.7% over the past year, while investment loans rose 5.8%. Both are higher than the ADI’s, suggesting the non-bank sector is able and willing to lend.

Total household credit growth remain above both inflation and wages, so households are getting mired further into debt, the sustainability of which we question. And again, we think regulators are not looking at the non-bank sector sufficiently hard.

Next month we will see the post-election post-rate cut situation. Many are expecting credit to rebound, and home prices to follow – we will see.

Changing The Game

It is also worth noting the RBA will be changing the reporting on the credit aggregates ahead. You can read about their plans. But essentially it will provide more granularity, and make some “significant” revisions to past results. The RBA plans to start publishing the financial aggregates from August 2019 using an improved conceptual framework and a new data collection.

The New Economic and Financial Statistics Collection

Over the past few years, APRA, the ABS and the RBA have worked to modernise the existing set of forms, and banks and other reporting institutions have adapted their infrastructure to be able to report on the new versions of these forms. This has been a large scale and complex project, involving considerable collaboration between the three agencies and the industry. The new set of forms are called the Economic and Financial Statistics (EFS) collection and will better meet the data needs of policymakers.

The EFS collection will be implemented in three phases.

The first phase will focus on data used for the financial aggregates and national accounts finance and wealth estimates.

The second phase will update current forms on housing and business loan approvals. It will also provide much more granular information on banks’ and other reporting institutions’ lending, their liabilities and interest rates.

The third phase will provide information on other aspects of reporting institutions’ activity and performance, including profits, fees charged and activity in specific financial products and markets. The first phase national accounts aggregates will be used in addition to this performance data in the compilation of Australia’s Gross Domestic Product (GDP).

The EFS collection will increase the reliability and accuracy of the inputs used to calculate the aggregates. One of the most important changes in the EFS is more detailed and precise definitions of the data to be reported. These definitions are accompanied by comprehensive guidance to assist institutions in reporting consistent data.

The Credit Monster Still Stalks The Halls! [Podcast]

We look at the latest stats from RBA and APRA on credit growth. Home lending is STILL growing at 3.9% per annum – yet we are about to stir up the monster some more – “you cannot be serious!”

https://www.rba.gov.au/statistics/frequency/stmt-liabilities-assets.html

https://www.apra.gov.au/publications/monthly-banking-statistics

Once again on the last working day we get the latest credit data from both the RBA and APRA. And fair enough, this is before the election, and the recent spate of “unnatural acts designed to kick start credit growth, but the trends before this are clearly down.  Here we are talking about the net stock of loans – rather than new loan flows (so we see the net of old loans closed, refinanced, and new loans written). We will need to wait for the ABS series in a couple of weeks to get the flow stats.

The RBA provides an overview, and a seasonally adjusted series, including the non-bank sector. APRA provides data for the banking sector – ADI’s or authorised depository institutions.

Digital Finance Analytics (DFA) Blog
The Credit Monster Still Stalks The Halls! [Podcast]
Loading
/

The Credit Monster Still Stalks The Halls!

We look at the latest stats from RBA and APRA on credit growth. Home lending is STILL growing at 3.9% per annum – yet we are about to stir up the monster some more – “you cannot be serious!”

https://www.rba.gov.au/statistics/frequency/stmt-liabilities-assets.html

https://www.apra.gov.au/publications/monthly-banking-statistics

Once again on the last working day we get the latest credit data from both the RBA and APRA. And fair enough, this is before the election, and the recent spate of “unnatural acts designed to kick start credit growth, but the trends before this are clearly down.  Here we are talking about the net stock of loans – rather than new loan flows (so we see the net of old loans closed, refinanced, and new loans written). We will need to wait for the ABS series in a couple of weeks to get the flow stats.

The RBA provides an overview, and a seasonally adjusted series, including the non-bank sector. APRA provides data for the banking sector – ADI’s or authorised depository institutions.

Total credit in the system, is still growing, with housing lending up to $1.83 trillion dollars, with owner occupied lending accounting for $1.23 trillion and investor loans 0.59 trillion. Business lending was 0.96 Trillion dollars and personal credit was $146 million dollars. So, you can see how significant housing credit – and yes, it is STILL growing.

Of that $1.83 trillion dollars for housing, $1.68 trillion comes from the banks, as reported by APRA.  Of that $1.12 trillion dollars is for owner occupied housing, and 0.55 trillion dollars for investors. The rest is non-banks, institutions who can lend, but do not fund these loans from holding bank deposits. APRA now have responsibility for these too but is not that actively engaged.  So, to the rate of change of credit growth.

We know that housing credit growth has been slowing as demand has slowed, and lending standards tightened, in response to APRA’s interventions and the Royal Commission. But the stark reality is that business lending is also flat according to the RBA.  

In fact, last month, total credit grew by only 0.16% and this is the weakest since early 2013.

Overall housing credit was up by 0.28% in the month, and personal credit declined by 0.3%

Annual credit growth slowed to 3.7%, the weakest since November 2013 and the trends are clear.

Slowing Housing credit growth is a large element in the numbers, as we have been tracking. The latest annual figure is just 3.9%, and this is the lowest ever in the series which started back in the late 1970s.

Looking at the three-month series you might argue that the rate of decline is easing just a little, there is not much here really to get excited about. Of course, most of the commentators are now looking ahead following the Coalitions return to power. The RBA I think cut rates on Tuesday, which is the first cut since August 2016. And of course, APRA is consulting on a proposal to loosen the interest rate buffer test.

I won’t repeat here the significant downside forces which will make a rebound in housing lending difficult, other than to say, the Coalition has promised a home price recovery, so they have to try and engineer it any cost – even if the debt balloon inflates further.

Investor housing momentum is still very weak, and there is little to suggest this will change soon – though some might try to sell into any more optimistic season. So, its down to first time buyers, and those seeking to trade-up.

Turning to business credit, this grew by 4.5% over the past year, up from 3.0% for 2017 but is easing back from gains of 6.4% in 2015 and 5.5% in 2016.  In fact, this is an important issue, as business lending and confidence are easing back – not a good sign.

APRA’s data showed that owner occupied lending rose 0.38% in the month, investor lending was flat, and the market growth was 0.3%.

And our analysis of the individual bank data shows that housing market shares did not change that much, although CBA and Westpac were more active in net terms last month, though mainly in owner occupied lending.  NAB and ANZ dropped more investor loans.

The 12-month portfolio moves for investor loans reveals the majors below the market. Macquarie and HSBC are leading the charge.

But a comparison of the gap between the Bank lending and RBA data shows the non-banks are still growing their books faster. Overall, they are running at an annualised 7.8%.

And analysis of owner-occupied lending by the non-banks shows it is still at 12.8%, compared with 2.1% for investor loans, but both above system.

So, standing back, the pre-election trends were weakening, the non-banks were making hay, and investors are still on the sidelines. Now it will be interesting to see if the so-called sentiment swing, and hype shows up in the numbers in the next couple of months. But to state the obvious, a growth rate of 3.9% for credit for households even now is way stronger than wages growth or inflation, so the debt burden is building further, and yet the policy settings are about to be shifted to encourage more of the same. Hardly sensible.

Credit Momentum Slows Some More

The RBA’s aggregates to April 2019 shows s further slowing, with housing credit over 12 months down to a growth rate of 3.9%.

We will publish more analysis on this later, but no surprise given the unnatural acts now in the pipeline to try and reverse the trend. Plus an analysis of the APRA data, which also looks pretty weak.

Weaker Credit Impulse Signals More Home Price Falls, Despite New Record Debt

On the last working day of each month the RBA releases their Credit Aggregates and APRA their Monthly Banking Statistics for ADS‘s. Both are now out for March.

The headline news is the overall housing credit is up, to a new record of $1.82 trillion dollars up 0.31% from last month, or 0.31%. Within that owner occupied lending rose 0.32% to $1.22 trillion dollars and investment lending was flat. 32.7% of lending stock is for investment lending purposes, a slight fall from last month, whilst business lending as a proportion of all lending rose from 32.9% from 32.8% to reach $963.7 billion dollars. Personal credit fell 0.27% or $0.4 billion, to $147.1 billion, and continues to fall.

The annualised movements by category shows further weakness, with lending for owner occupied housing now at 5.7%, investment housing lending at 0.7%, giving housing overall growth of just 4% (though still higher than wages growth I would add). Personal credit fell 2.8% over the past year, while business lending rose 4.9% annualised. All these figures are on a seasonally adjusted basis

Turning to the APRA data on the banks, owner occupied lending rose 0.35% in March, while investment lending fell by 0.02%, giving total credit growth of just 0.2%. Over the past year owner occupied loans grew by 4.8% (compared with 5.7% at the aggregate level) and investor loans grew 0.4% (compared with 0.7% at the aggregate level). So the banks loan portfolios are growing more slowly than the market.

This can be illustrated by comparing the RBA and APRA data (warts and all) to show the non-bank sector is growing faster than the banks. Overall, they have over 7.5% of the market, which is up from the low in December 2016.

In addition, the rate of growth is significantly higher than the banks. Non-bank owner occupied loans are growing at an annual rate of 14%, while investment loans are 2.2%; both significantly higher than the ADI’s. Non-banks have weaker regulation, and more ability to lend. APRA has yet to truly engage with the sector.

Turning back to the individual lenders, the changes in their portfolios over the month show that Westpac and CBA offered the most new owner occupied loans, while ANZ dropped back, on both owner occupied and investment loans, while NAB dropped investment lending. HSBC, Macquarie and Member Equity Bank (ME) lend more than the regionals.

Overall market shares hardly moved, with CBA still the largest owner occupied lending, and Westpac the biggest investor lender.

Investment lending growth over the past 12 months has been anemic, but some lenders such as Macquarie are making hay. Of course the old 10% speed limit from APRA has gone now, but the relative growth highlights the fact that the four majors are well below market growth levels – and ANZ the weakest (which is why they said they wanted to lend more).

So finally, the total ADI lending book is at $1.68 trillion dollars, with owner occupied loans comprising $1.12 trillion dollars and investment loans $557 billion dollars, and comprising 33.2% of the portfolio – as the ratio continues to fall.

In conclusion, the credit impulse – the rate of change of credit being written is the most significant forward indicator of house price trajectory. The weak state of the market suggests more and significant price falls ahead. Yet despite all this, household debt will continue to rise. There is absolutely no reason to loosen lending requirements, or drop the hurdle rate on these numbers. More households will get into trouble ahead.

Non Banks Bloom As Credit Impulse Slows Again

The February data from APRA for ADI’s and the credit aggregates from the RBA were released today. The headline news is the rate of housing credit growth continued to slow.

This is quite starkly shown in the RBA’s 12 month series, with total credit annualised growth now standing at 4.2%. Housing credit also fell to the same 4.2% level, from 4.4% a month ago. The fall continues. Within the housing series, lending for owner occupation fell below 6% – down to 5.9% and investment housing lending fell to 0.9% annualised.

The seasonally adjusted RBA data showed that last month total credit for housing grew by 0.31%, up $5.6 billion to $1.81 trillion, another record. Within in that owner occupied lending stock rose 0.42%, seasonally adjusted to $1.22 trillion, up $5.11 billion. Lending for investment property rose 0.09%, or $0.5 billion to $595 billion. Personal credit fell slightly, down 0.07% and business credit rose 0.42% to $960 billion, up $4.06 billion.

The APRA data revealed that ADI growth was lower than the RBA aggregates. Some of this relates to seasonal adjustments plus, as we will see a rise in non-bank lending. The proportion of investment loans less again to 33.3% of loans outstanding.

Total owner occupied loans were $1.11 trillion, up 0.38%, or $4.2 billion, while investor loans were $557 billion, flat compared with last month. This shows the trends month on month, with a slight uptick in February compared to January, as holidays end and the property market spluttered back to life. The next couple of months will be interesting as we watch for a post-Hayne bounce in lending and more loosening of the credit taps, but into a market where demand, is at best anemic.

The portfolio movements are interesting (to the extent the data is reported accurately!), with HSBC growing its footprint by more that one billion across both investor and owner occupied lending. Only Westpac, among the big four grew their investor loans, with ANZ reporting a significant slide (no surprise they said they had gone too conservative, and recently introduce a 10-year interest only investor loan). Macquarie and Members Equity grew their books, with the focus on owner occupied loans.

The overall portfolios did not vary that much, with CBA still the largest owner occupied lender, and Westpac the largest investor lender.

The 12 month investor tracker whilst obsolete in one sense as APRA has removed their focus on a 10% speed limit, is significant, in that the market is now at 0.6% annualised.

But the final part of the story is the non-bank lending. This has to be derived, and we know the RBA data is suspect and delayed. But the gap between the RBA and APRA data shows the trends.

Non Bank annualised owner occupied credit is growing at 17.6%, and investor lending at 4.8%. It is clear the non-banks, with their weaker capital requirements, and greater funding flexibility are making hay. Total non bank credit for housing is now around $142 billion or around 7.8% of housing lending. This ratio has been rising since December 2016, and kicked up in line with the tighter APRA rules being applied to the banks.

We have out doubts that APRA is looking hard enough at these lending pools, especially as we are seeing the rise of higher risk “near-prime” offers to borrowers who cannot get loans from the banks.

So to conclude the rate of credit momentum continues to ease – signalling more home prices ahead. The non-banks sector, currently loosely regulated by APRA is growing fast, and just the before the US falls around the GFC, risks are higher here. And finally, and worryingly, household debt is STILL growing… so more stress and financial pressure ahead.

Non Bank Home Lending Rising

The RBA released their credit aggregates to end January 2019 today, and the data confirms that lending growth continues to slow across home lending and personal credit.

We will get to the detail shortly, but I want first to head to a comparison between the APRA data for the banks, also released today, and the total credit from the RBA.

The gap between the two relates to the non-bank sector, and the fact is, despite all the funnies in the numbers, lending from the non-bank credit sector is booming. Owner occupied non-bank lending is growing at an annualised rate of 17.2% and lending for investment housing is 4%. Both well above the bank sector. This is unsurprising, given the different funding arrangements, and restrictions between the banks and non-banks. Of course both have responsible lending obligations, but evidence suggests non-banks are more willing to lend, at a price. APRA sort of has responsibility for the non-bank sector, but do not seem to be doing much to stem the tide.

Meantime, the RBA lending aggregates shows that annual owner home lending now stands at 6.2%, investment lending at 1% and overall credit growth is 4.4%. There was a considerable drop off in personal credit, and a rise in business lending.

The monthly trends are more noisy, as expected.

Turning to the credit stock, and using the seasonally adjusted figures, we see that overall credit still advanced. Total loans for owner occupation rose by $4 billion dollars to $1.22 trillion dollars, up 0.33% while loans for investors rose $0.3 billion seasonally adjusted to $594.6 billion dollars, up just 0.04%. Investment loans were 32.8% of the total, down slightly from last month.

Business credit rose by $3.1 billion to $956 billion, up 0.33% and comprised 32.8% of all lending, up a little from last month.

Personal credit fell by $0.9 billion dollars to $147.5 billion, down 1.15%,

Its also worth noting the seasonally adjusted figures overstates the investment lending by a net $0.6 billion dollars.

To me the slowing credit impulse is clear, as is the worrying rise in non-bank lending. Adopt the brace position!

RBA Says Credit Hits New High, But Growth Is Lower Again

The December 2018 data from the RBA has been released today, and credit growth continues to slow, led down by both housing and business finance. That said total credit is still expanding, and housing credit reached a new record, $1.8 trillion dollars. Within that Owner occupied loans were reported at $ 1.21 trillion dollars and Investment loans $0.59 trillion, accounting for 32.9% of all housing lending. Credit to business was up a little to 32.8% of all lending stock. Personal credit shrank again.

The share of lending for housing investment fell again, while the business mix was up just a little.

Total credit for housing was an annualised 4.7% compared with 6.3% a year ago. Personal credit was down again, to -2.0% over the past year, compared with -1.1% a year before, and business credit was at 4.8% compared with 3.1% a year back.

Within the housing sector, home lending for investment purposes was at 1.1% and for owner occupation a (still massive) 6.5%. Still way higher than inflation and wages, so household debt ratios will continue to deteriorate.

The monthly movements show a fall in business lending momentum and owner occupied lending, though a small uptick in investor loans, if from a low base.

The APRA data is also out today, so we will look at this later… But we can conclude the overall growth in housing lending is still building more risks in the market, despite all the hype. Credit loosening should be resisted.