The latest edition of our Household Financial Confidence Index is released today. We discuss the results.
 Blog")
/
RSS Feed
Digital Finance Analytics (DFA) Blog
"Intelligent Insight"

The latest edition of our Household Financial Confidence Index is released today. We discuss the results.
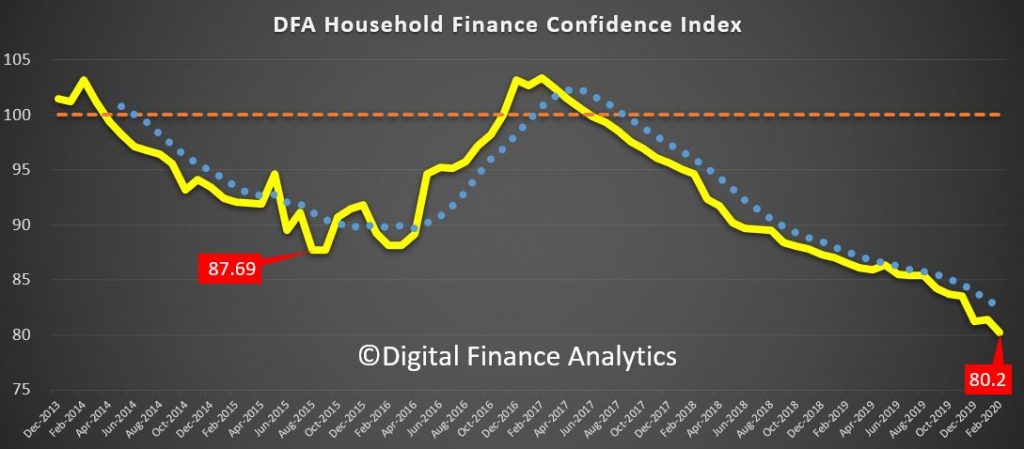
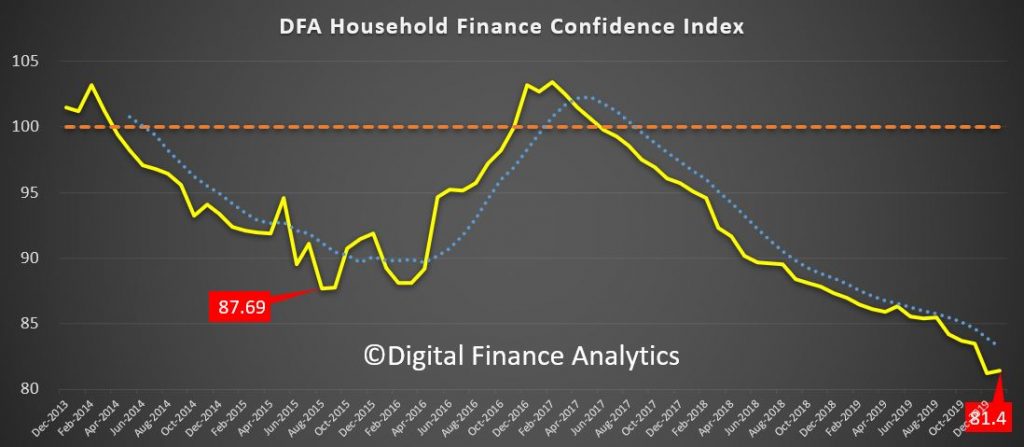
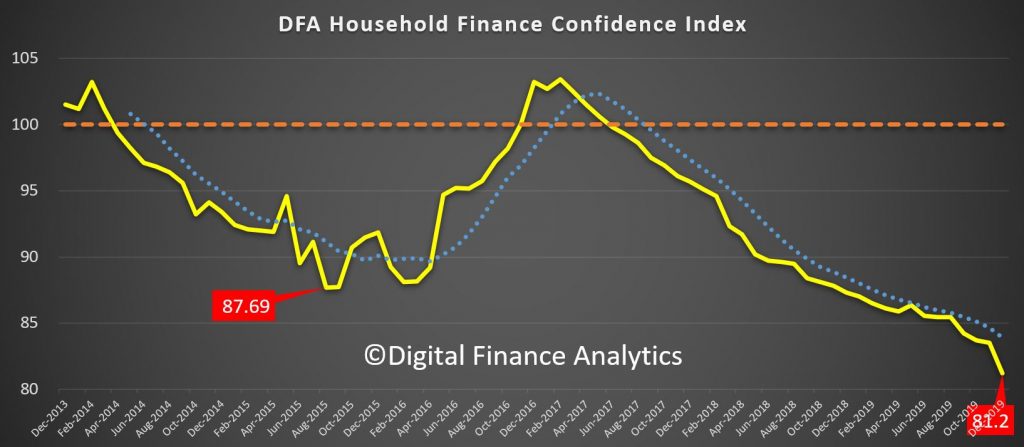
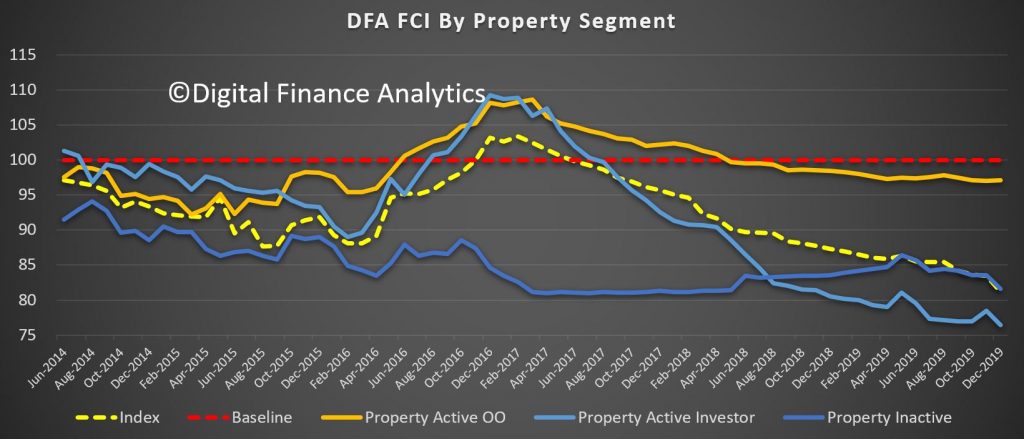
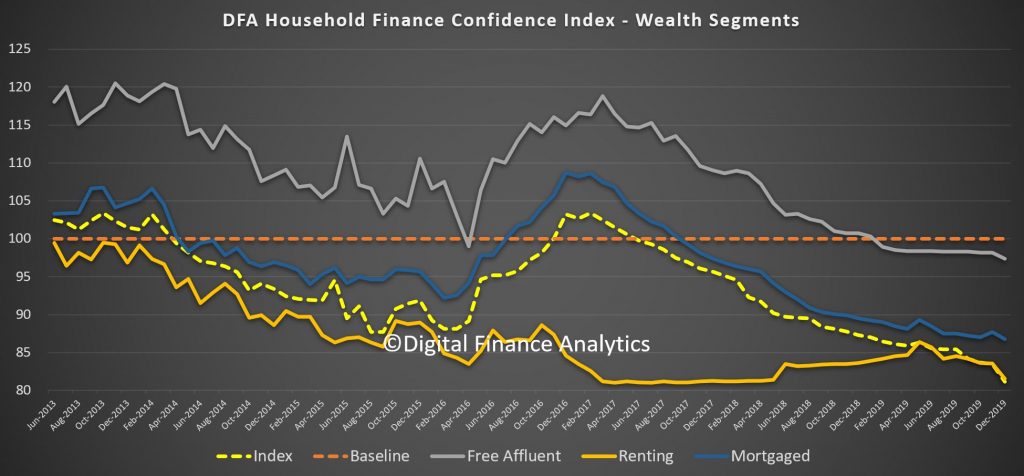
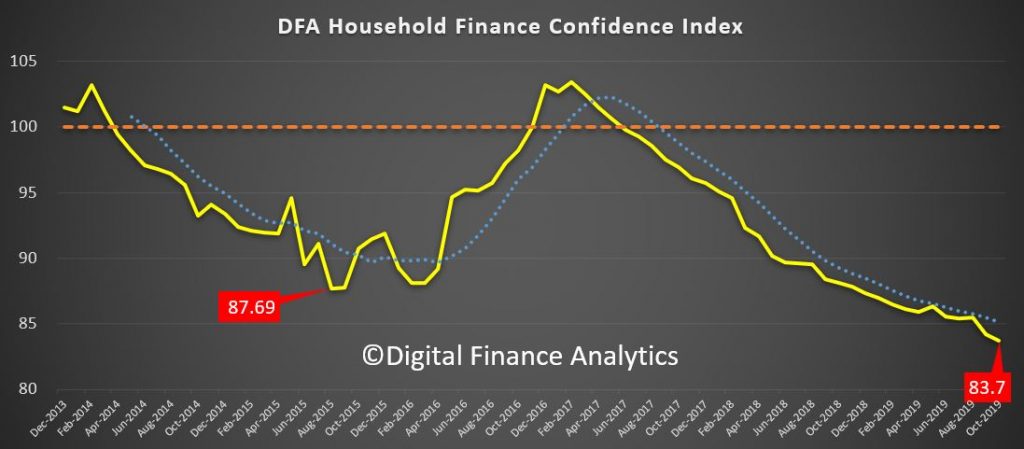
The latest data from our household surveys to the end of February 2020 shows that the impact of Covid-19 are hitting home. The index dropped again, into uncharted territory, to an all time low of 80.2. I even had to change the scale of the chart to accommodate the fall!
We ask households to compare their levels of confidence today compared with a year back across a number of dimensions, from job security, income, costs of living, debt, savings and overall net wealth (assets less debts). This gives us a comparative series from the 52,000 households in the rolling sample.
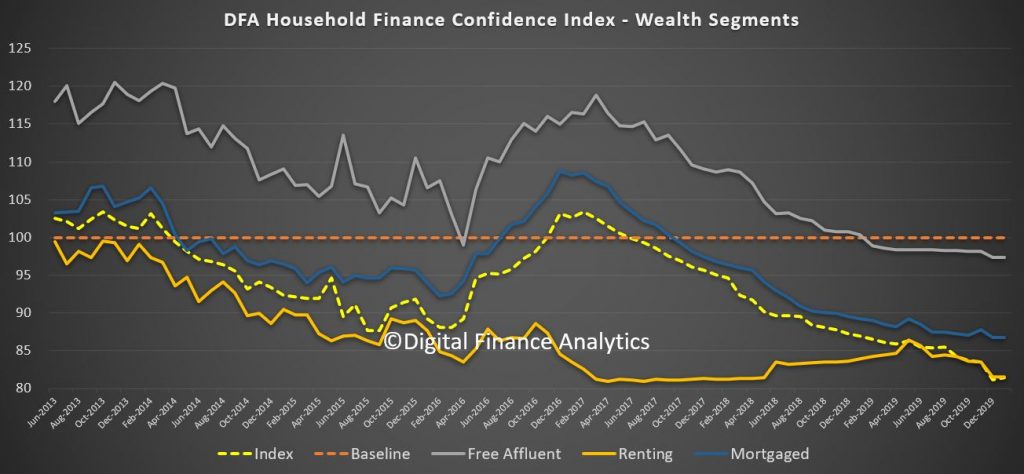
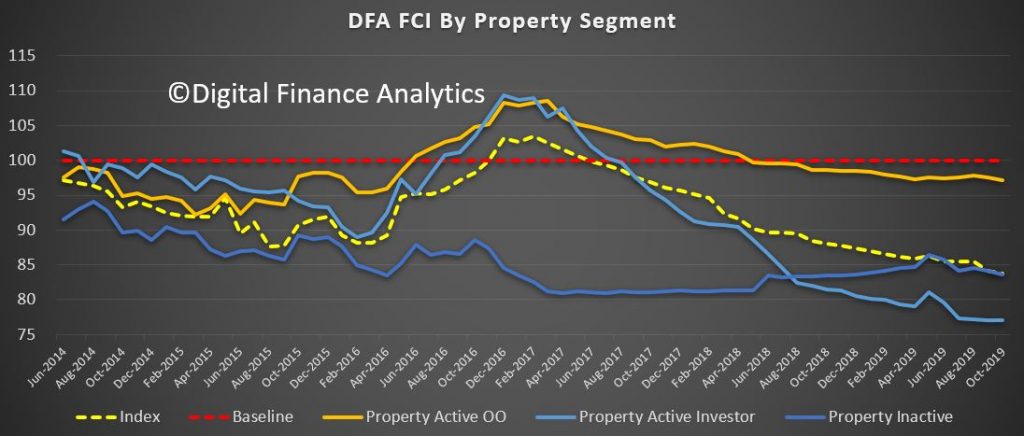
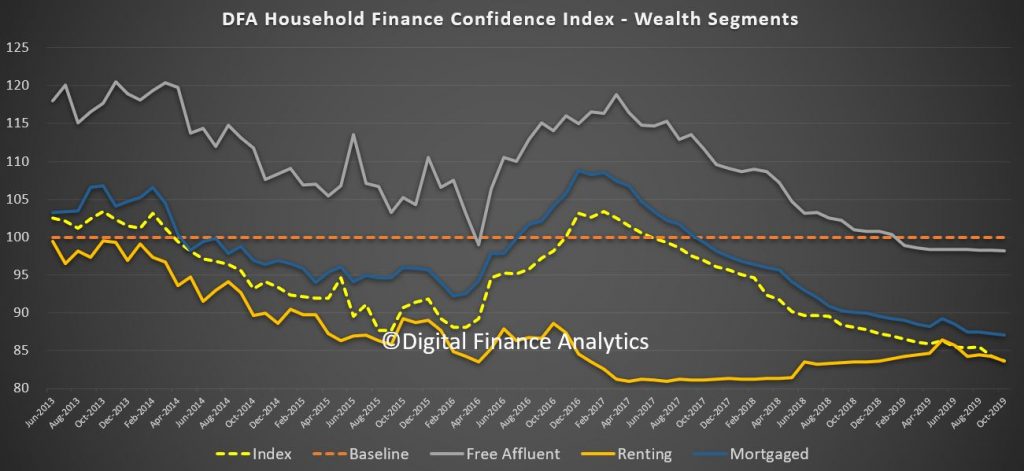
Households are reacting to the uncertainty about the future trajectory of the economy, and recent survey results (we run a rolling series to the 5th March), have captured recent stock market falls. The falls are broad based, though households with a property remain relatively more positive, believing that property remains largely immune – we will see.
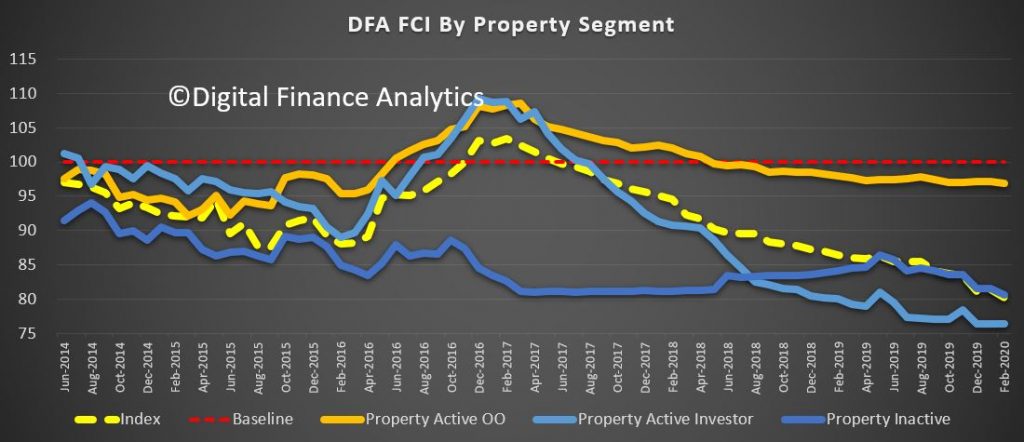
Within the property segmentation, property investors are on the mat now, as rentals continue to grind down, and property values especially among units have not recovered as much as the generic indices may suggest. Households renting are finding more choice, and lower rents in a number of centres (Hobart excepted). Supply is quite strong.
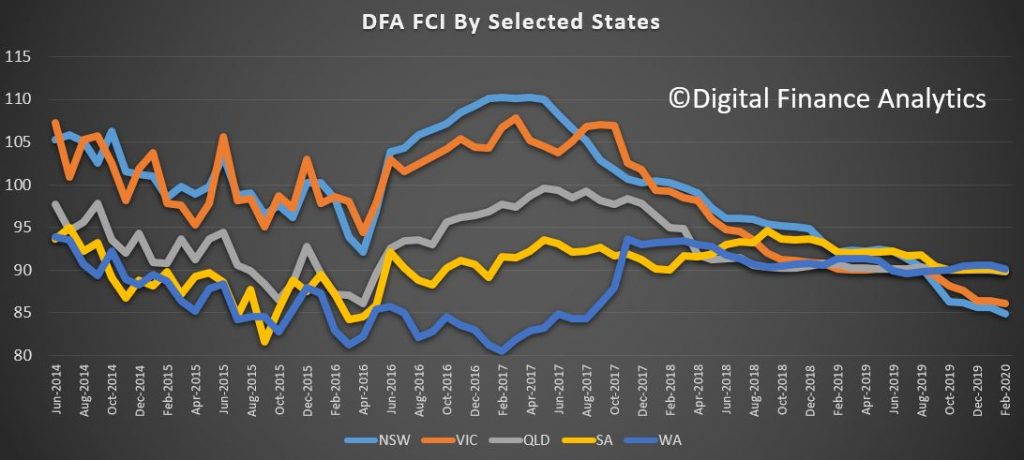
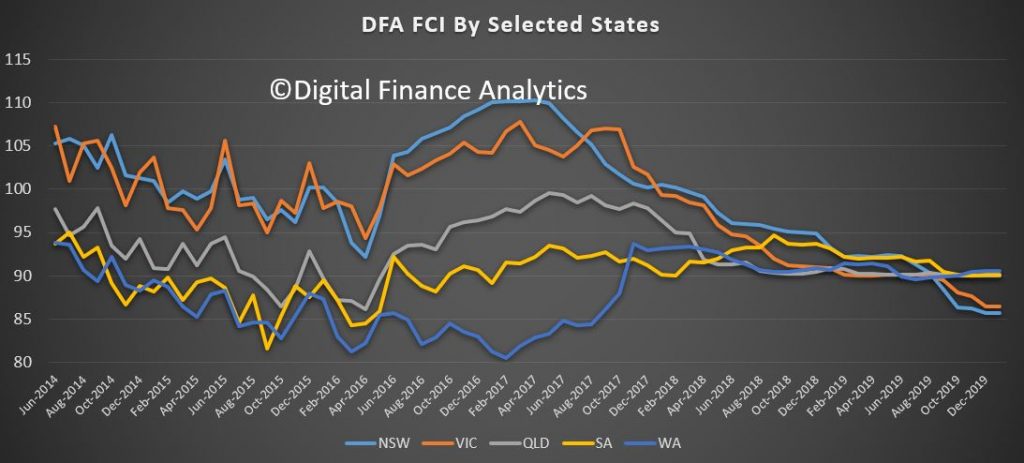
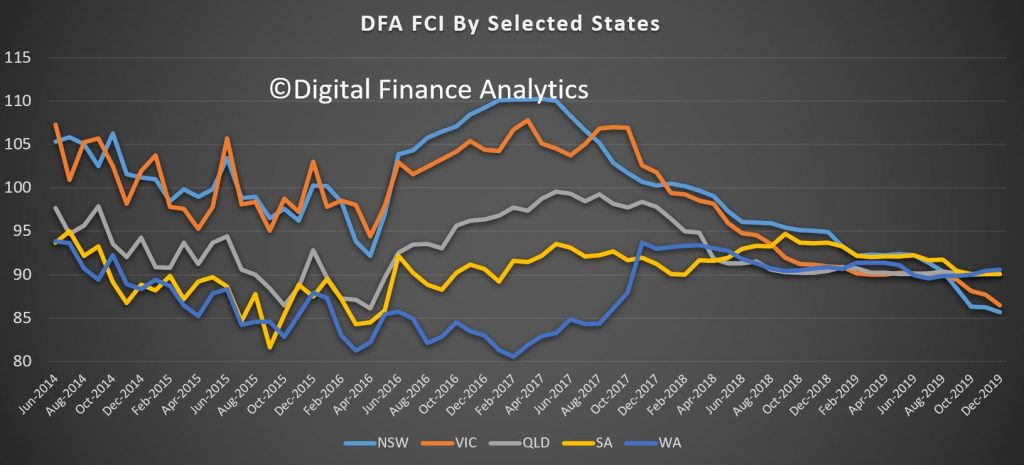
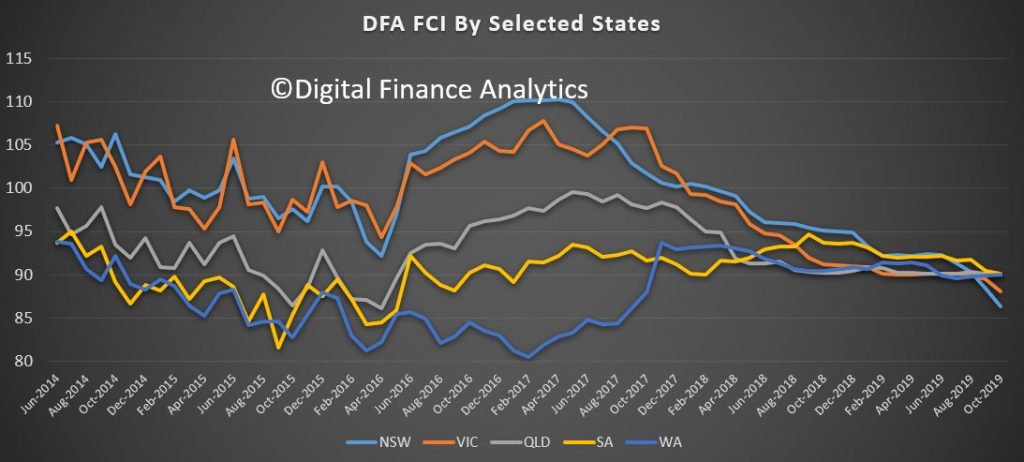
Most states moved lower, with NSW and VIC taking quite a hit this past month. NSW at 84.9 is the lowest scored state now, thanks to the higher debt leverage there where large mortgages predominate. WA, QLD and SA are bunched higher at around 90.
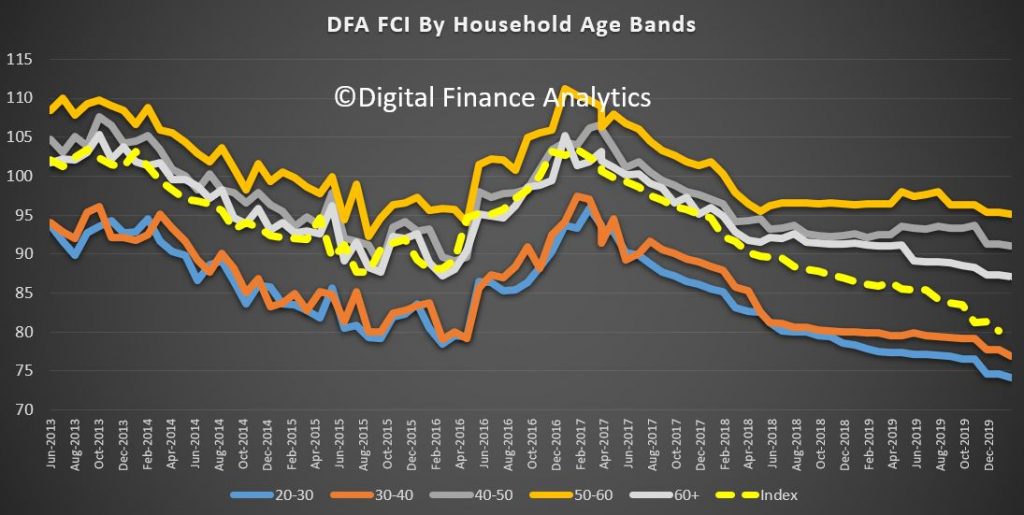
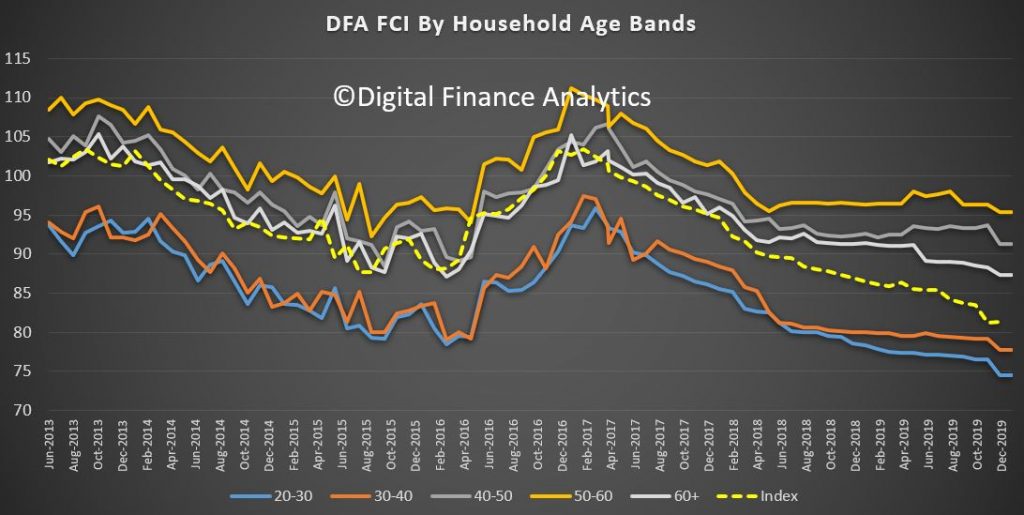
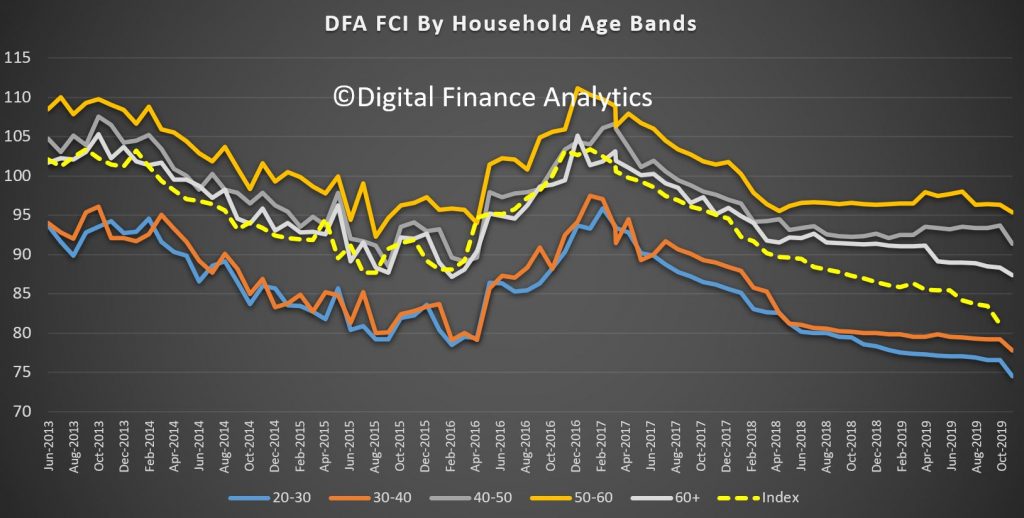
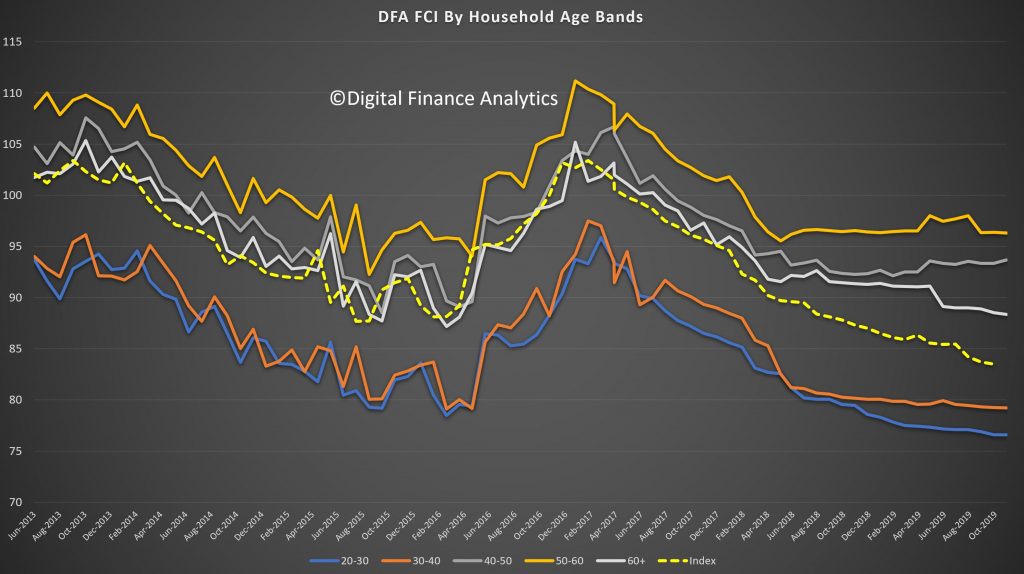
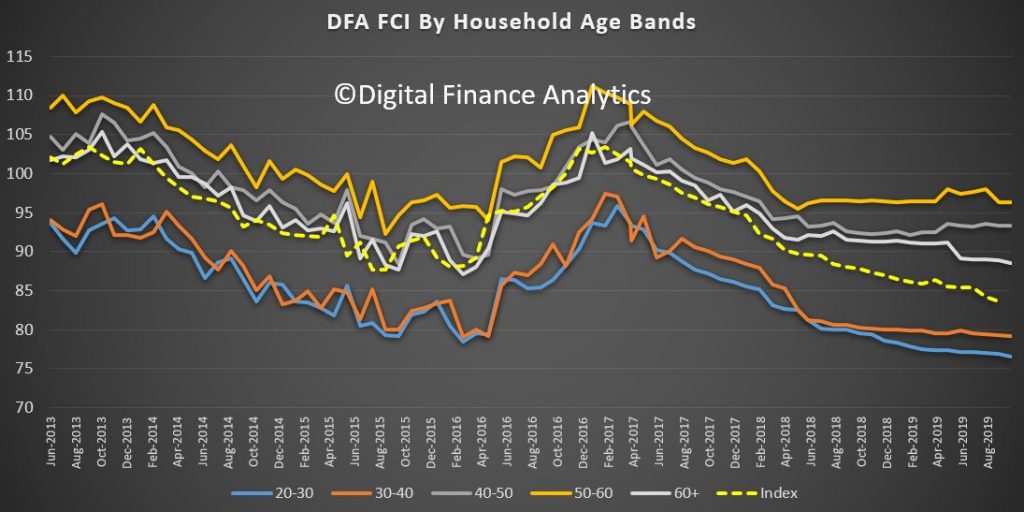
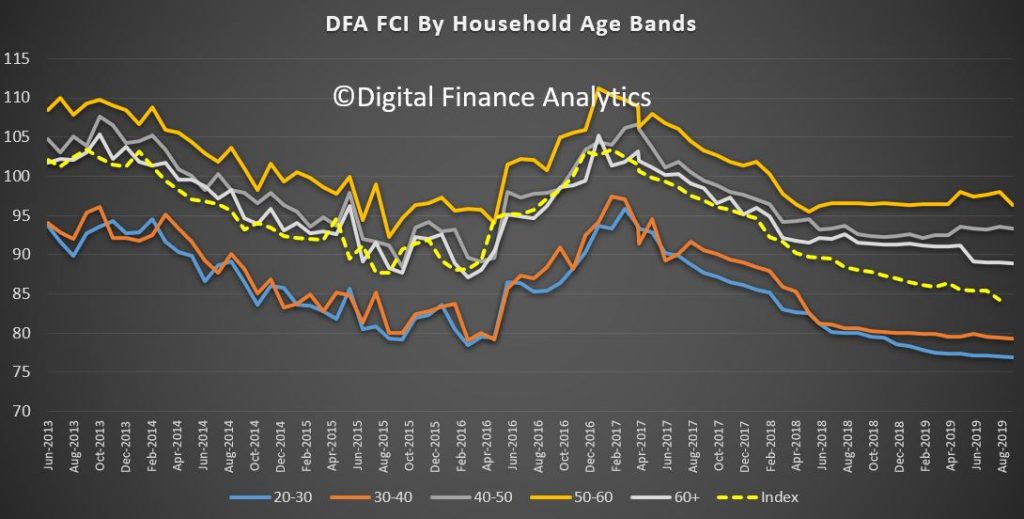
Across the age bands, we see falls across the board. The financial pressures on younger households of 20-30 and 30-40 are piling up as they continue to feel the issues most severely, older households are buttressed a little more by share portfolios (which are falling) and savings (where rates are falling). But all ages bands fell this month.
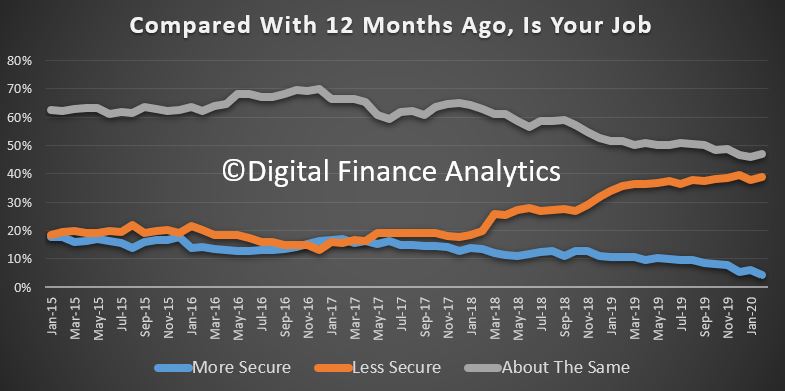
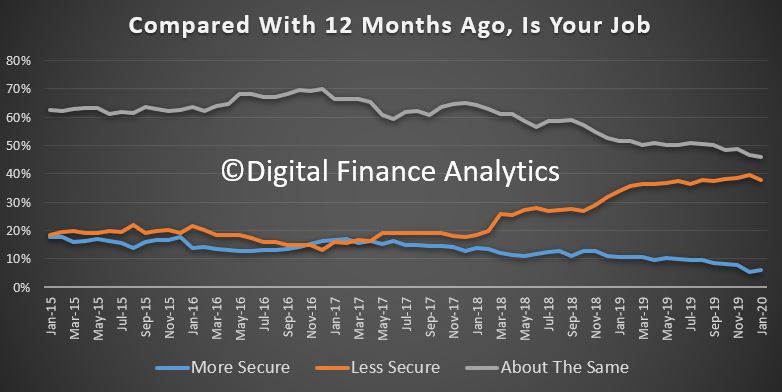
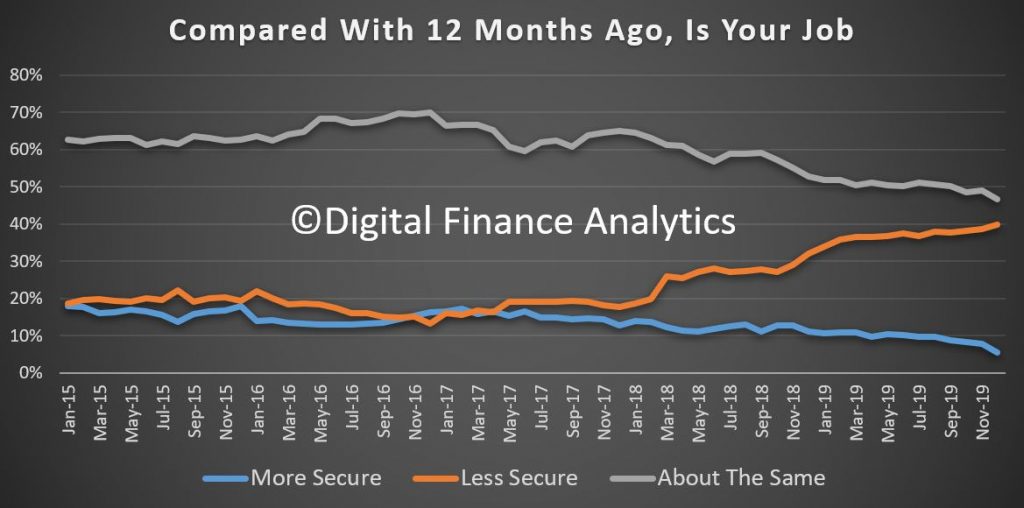
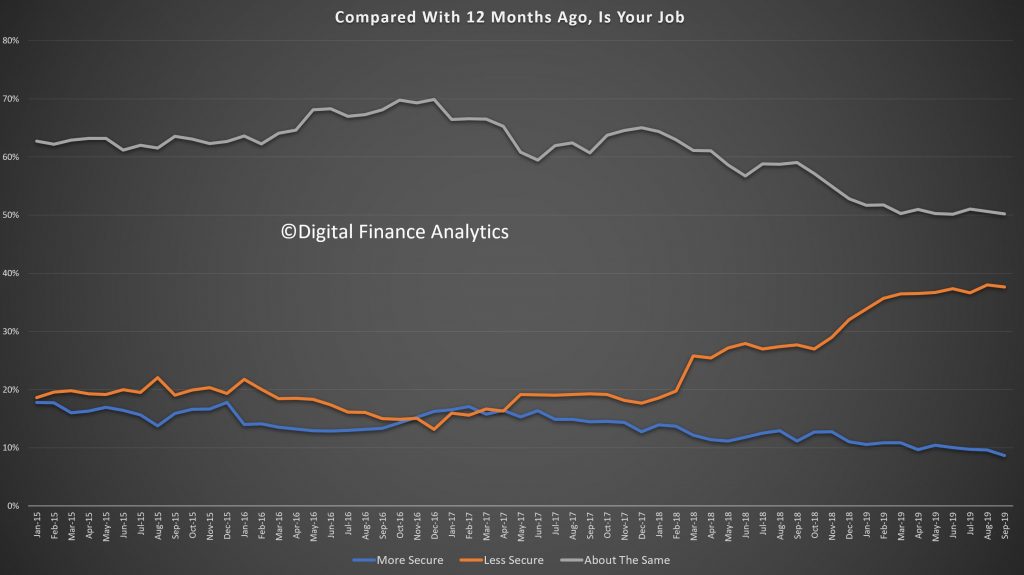
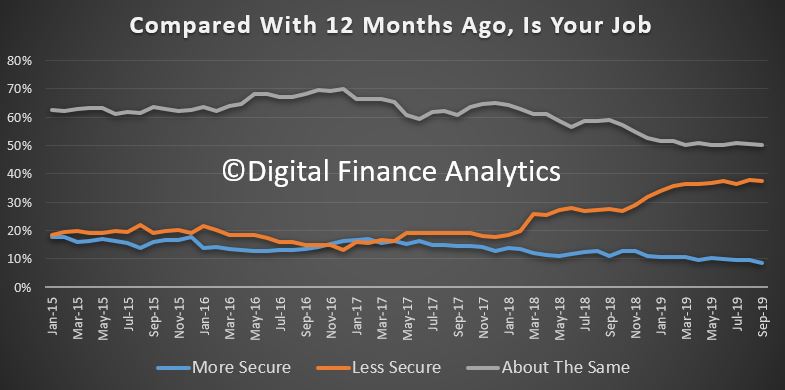
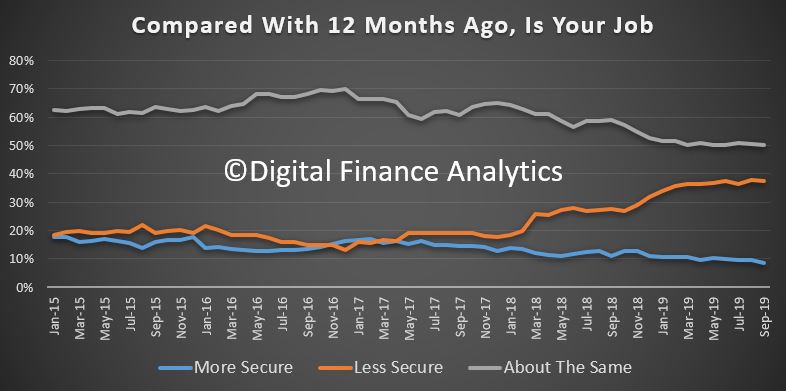
Within the index we can look at the elements which drive the scores. Job security slid 1.66% compared with last month with just 4.3% saying they feel more secure than a year ago. 38% feel less secure, an increase of 1.1% from last month, and 47% about the same. The full potential impact on jobs has yet to be absorbed by the community, but around 3 million are working in gig type “flexible” roles. And others will be “encouraged” to take leave to try to stem cash flow issues among businesses.
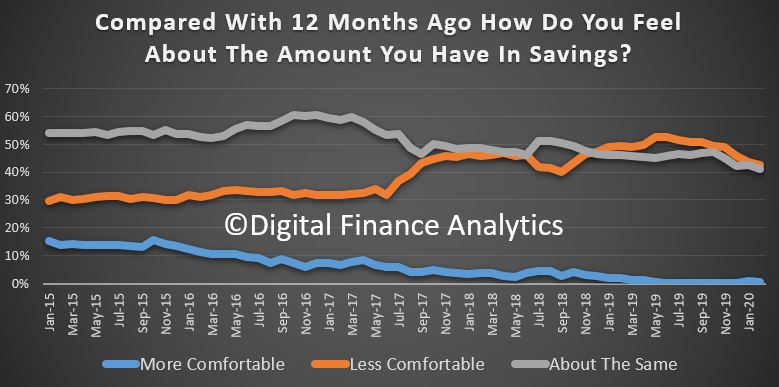
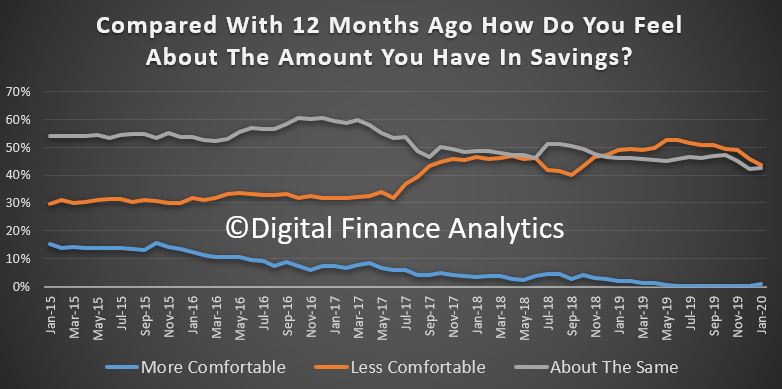
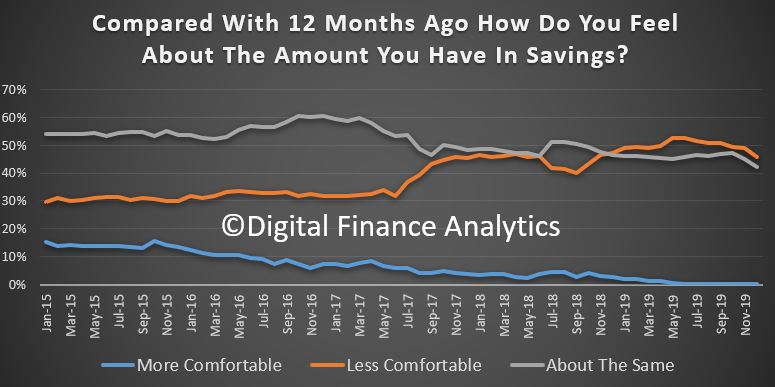
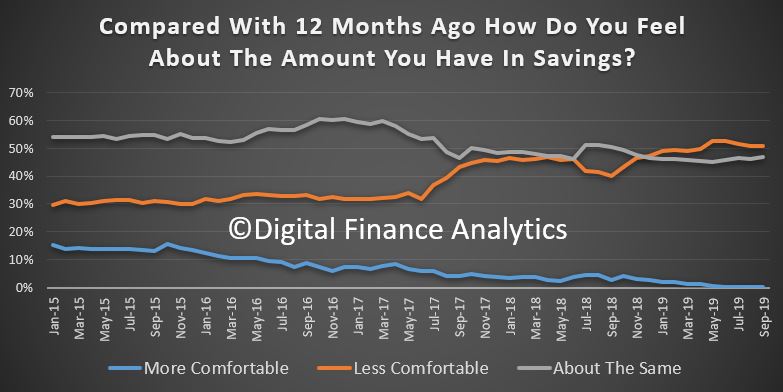
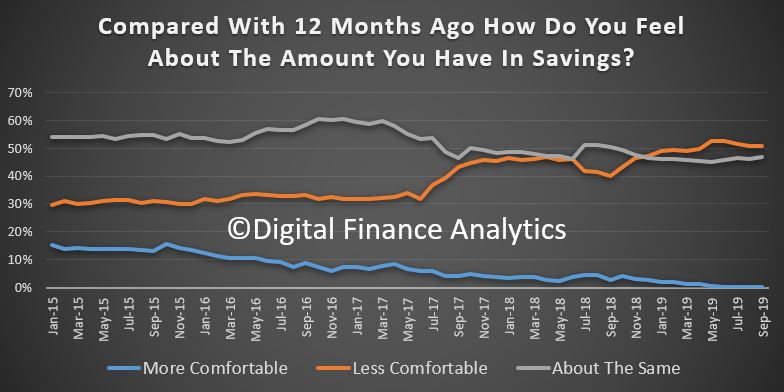
Households are taking a beating on savings at the bank, with rate cuts eroding returns to the point many households are not getting enough income to cover the basics. And the stock market is off (and falling as I write), with the supply side shock of the virus now translating to a potential liquidity crisis. Safe havens are hard to find for the fortunate few who have savings. Many of course have none and live from pay credit to pay credit.
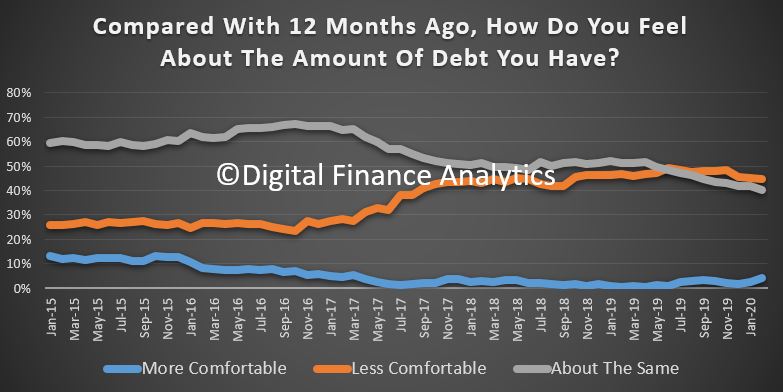
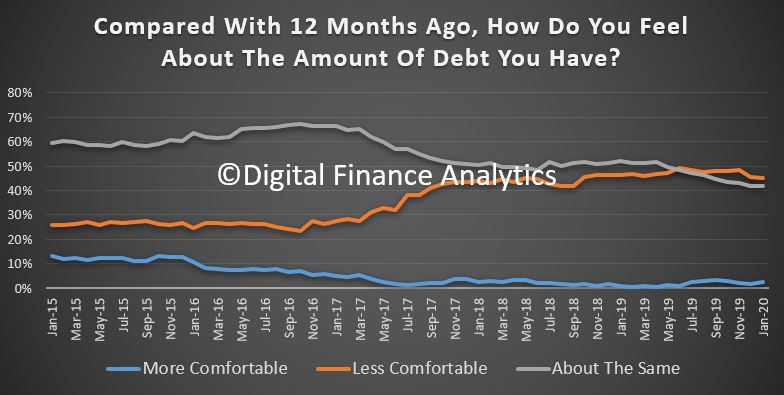
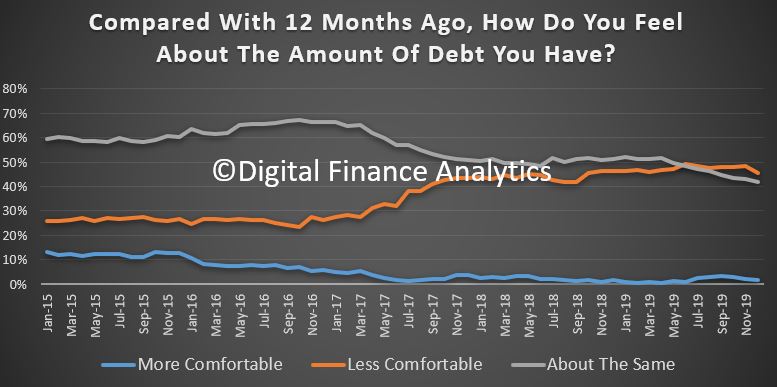
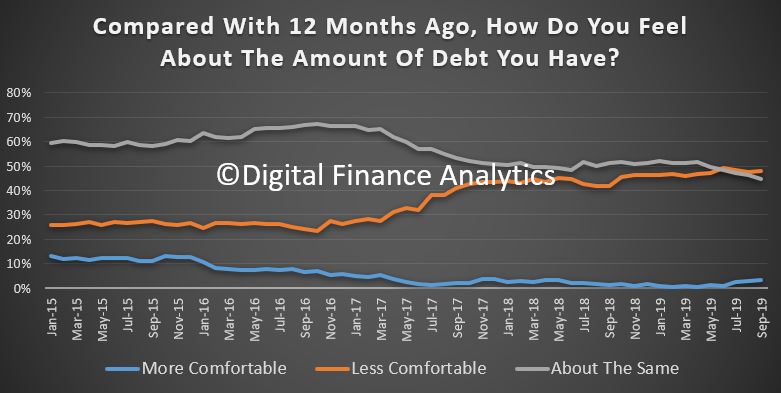
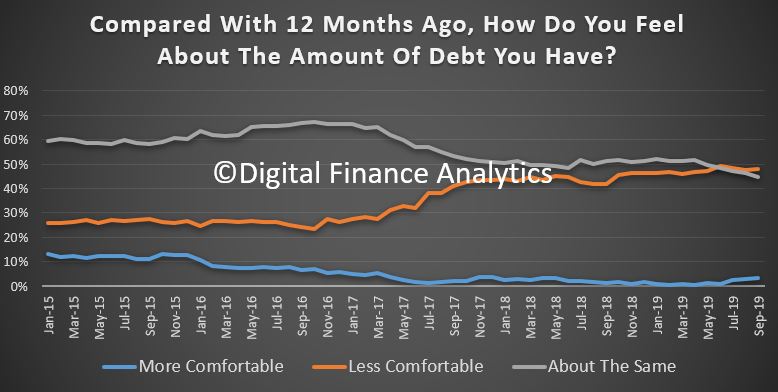
The cost of debt is falling, so many are seeking to refinance (again) to grab the lower rates available to some. However, only 4.2% are more comfortable with their level of debt compared with a year back, and of course if income from employment falls, paying the mortgage becomes a nightmare. 42.5% are less comfortable than a year ago. Those who recently obtained new mortgage finance appear to be in for the biggest shock thanks to looser underwriting standards of late.
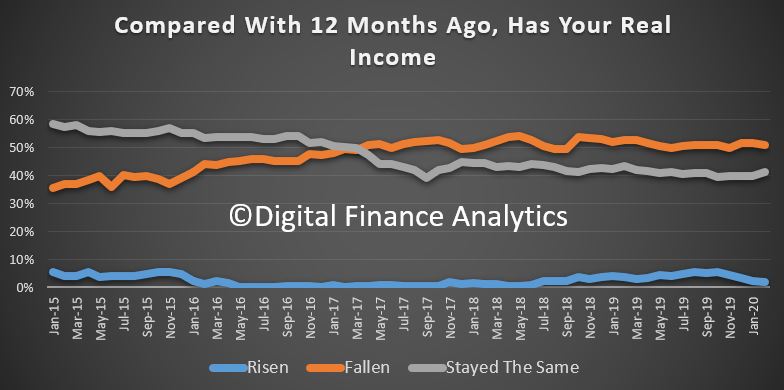
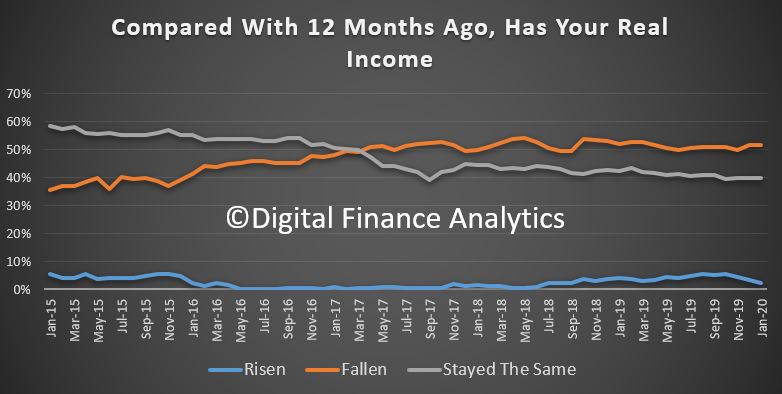
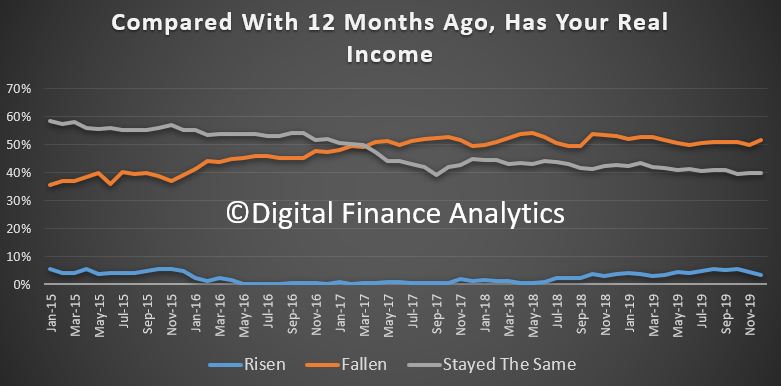
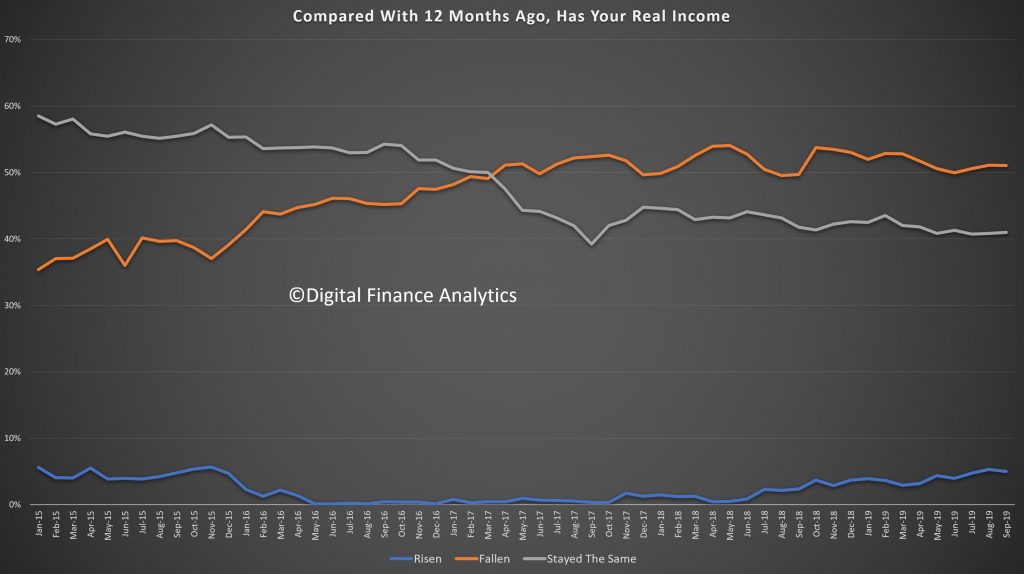
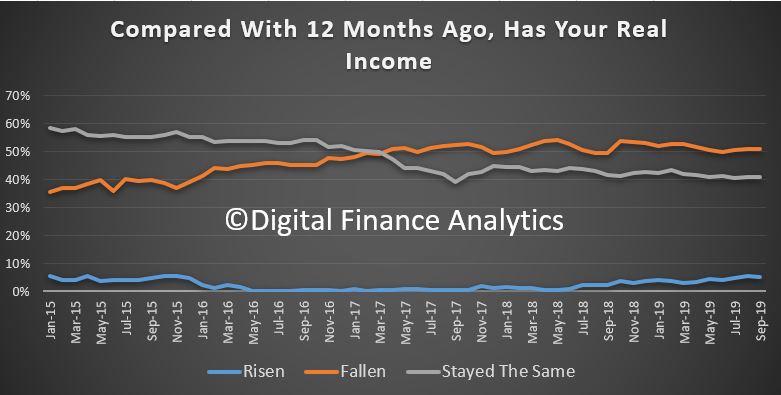
Pressures on incomes remain centre stage with just 1.7% of households saying their real incomes have risen in the past year. More than half of households have seen their incomes fall in real terms over this period, and 40% see no change. Incomes will evaporate for many should the supply side shocks continue.
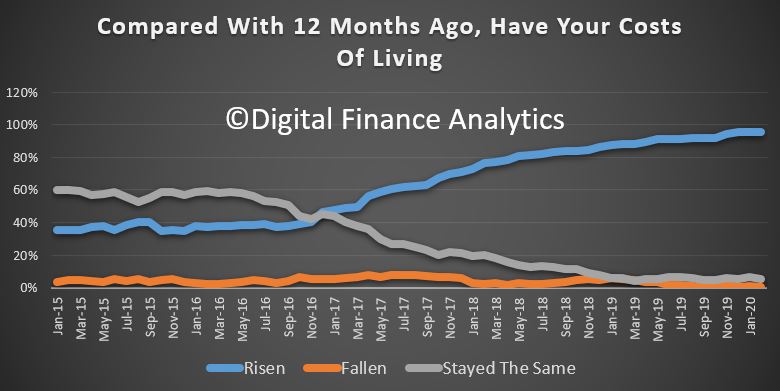
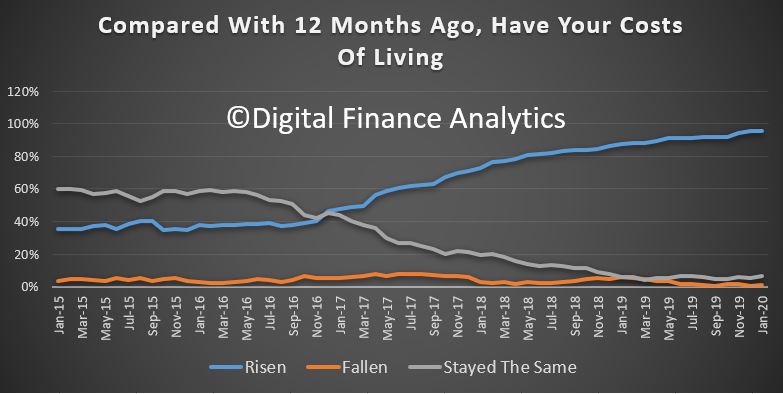
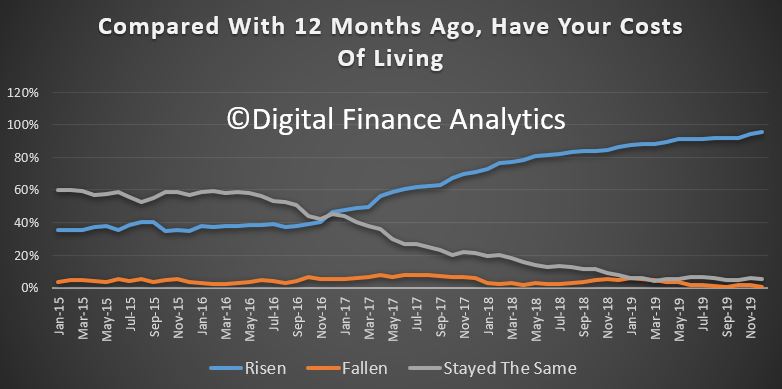
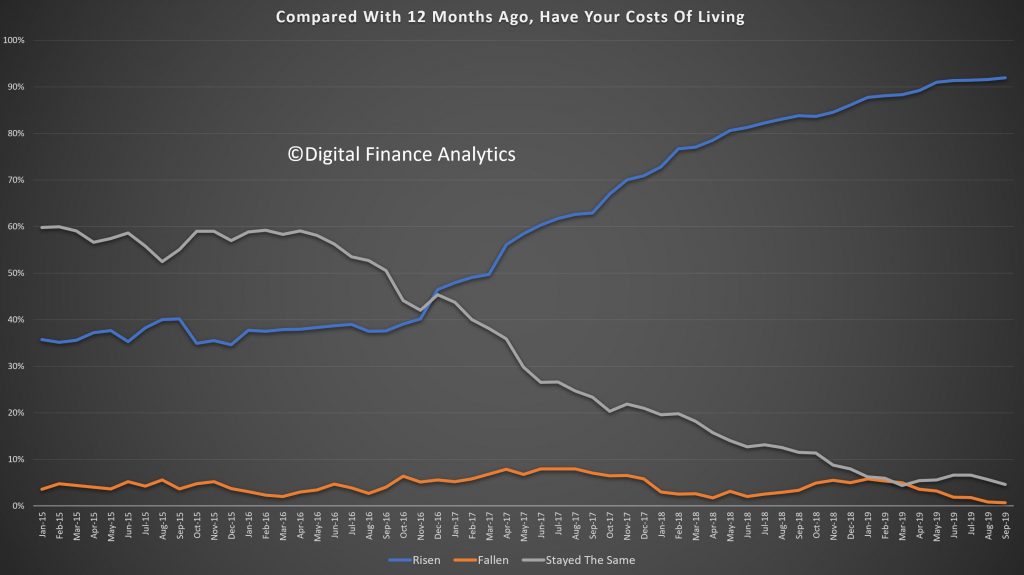
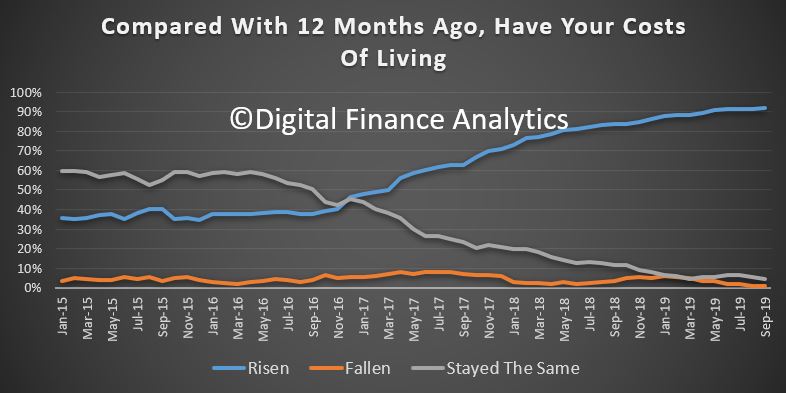
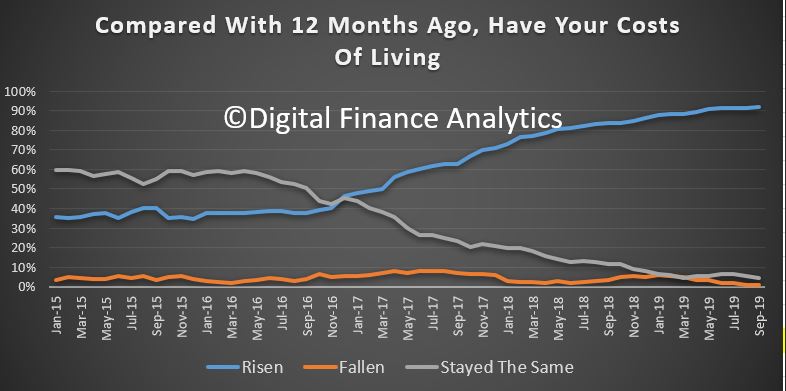
Costs of living on the other hand continue to bite, with more than 95% of households reporting rising costs over the past year. 5% reported no change, almost no households reported they had fallen. Categories of costs which are impacting including the usual suspects, from energy, fuel, child care and health case costs, plus council rates. But the most insidious are those relating to everyday expense at the supermarket, where drought related hikes abound. The falling exchange rate is also hitting some imports and making them more expensive. Around 25% of households have less than 1 months cash available to meet their commitments if they income seized up.
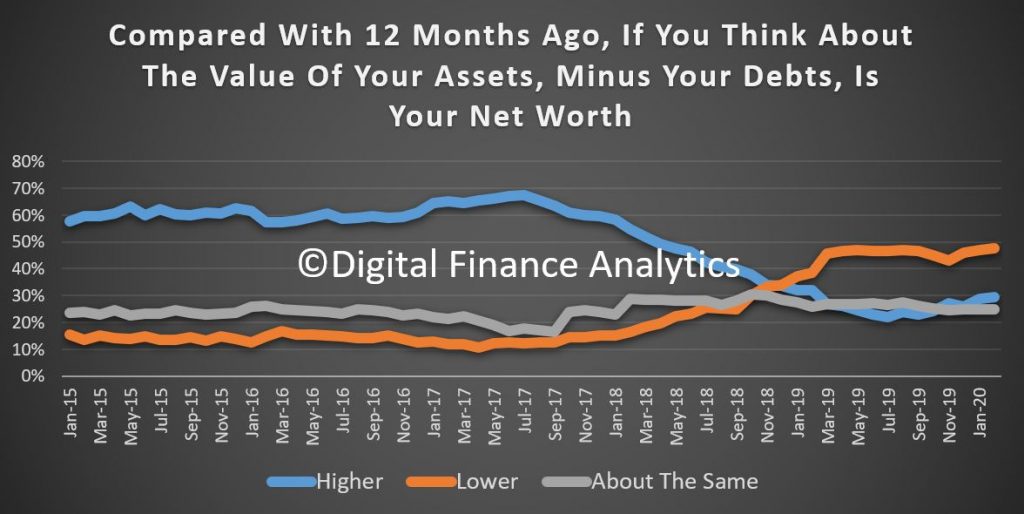
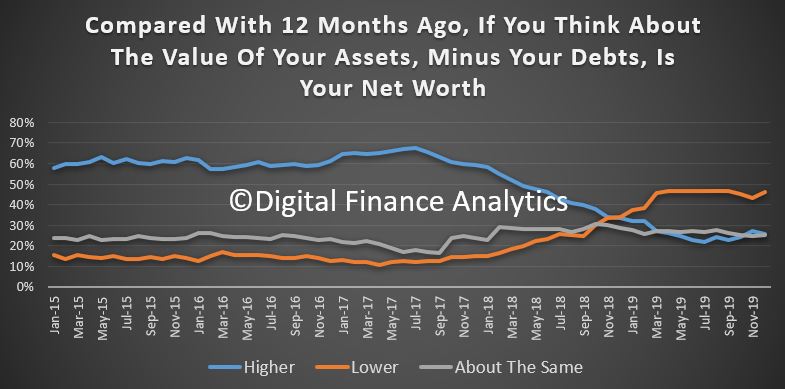
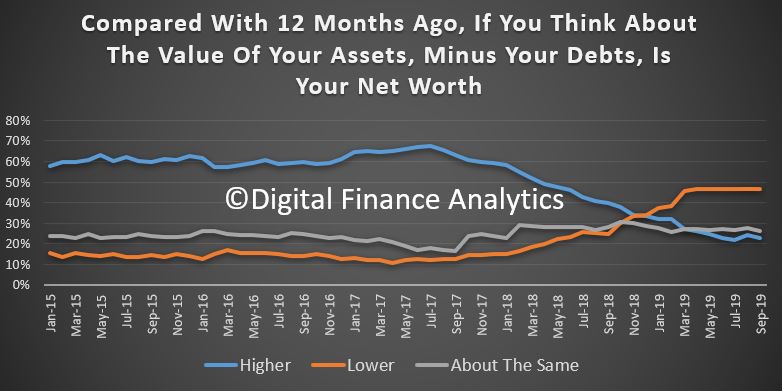
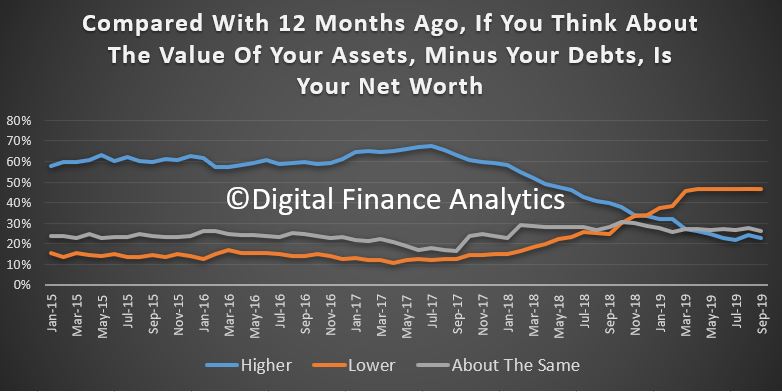
Yet, overall, the net worth of households improved slightly, with property values higher in a number of locations, though recent stock market falls are dragging wealth down for some.
The big strategic question now is whether the Government understands the true significance of what is happening. Whilst they are talking up a $10 billion package, it appears to be shaping towards investment allowances and other tactical measures. In fact, the level of confidence we are recording in our surveys suggests that households will not be able spend (consumption being a significant share of the economy) and many small businesses will struggle to employ, yet alone survive. The quantum they are discussing is too little too late. I expect confidence to erode even more as things play out and the true horror the economic predicament we are in hits home. And then the following financial crisis also strikes.
The latest results from our household surveys revealed that household financial confidence recovered just a little in recent weeks, but is still in ultra-low territory and well below the neutral 100 measure, at 81.4.
So far, the impact of virus concerns have not translated into households finances, whereas the bushfires, floods and other local events are having a more direct impact.
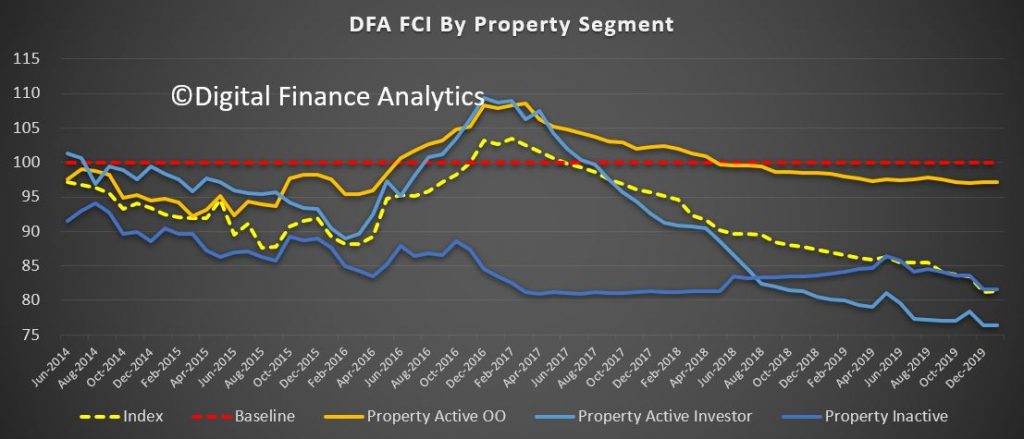
Across the property segments, owner occupied households are the most positive, thanks to rising prices in some locations and lower interest rates on some mortgages. Property investors and those renting remain more bearish, as rental costs continue in the doldrums.
Across the states the recent trends continue, with both NSW and VIC households under greater financial pressure compared with WA, QLD and SA. Much of this is debt related as the average mortgage size grows ever larger in the two largest states.
We continue to see pressure among younger households building relative to those in the older cohorts. Much of the pressure comes from housing costs one way or another.
Those mortgage free and owning property are relatively better placed than those with a mortgage, or renting. This is because housing costs are such a large element in a budget whether servicing a mortgage or paying rent.
Looking in more detail at the moving parts, living costs continue to rise disproportionately, thanks to more expensive fresh food (drought related), child care and school fees rising fast, accelerating healthcare costs and continued high energy and fuel costs. 95% see their costs higher than a year ago. More are having difficulty with council rates and other regular commitments.
Income growth is muted at best, with 51% saying their income has been reduced in real terms over the past year, with both wages growth sluggish, and income from savings on deposits crashing as the cash rate is cut, and banks squeeze margin. Returns from share investments on the other hand are doing better. Those with spare income are preferring to pay debt down, rather than spend.
Job prospects are also sluggish, with just 6% feeling more secure than a year ago, while 38% are feeling less secure. We continue to see a pattern of multiple jobs, rising part-time jobs, less overtime and gig economy roles on the rise; all creating greater concerns about job security. Underemployment remains a critical issue for many.
Turning to loan finances, some have been able to refinance to lower rate mortgages (and others appear to be missing the opportunity to switch and save), while some households are unable to transfer to a lower rate thanks to underwriting constraints. Households are able to grab a larger loan now lending standards have been loosened. Lower rates mean that 42% remain about the same with regards to confidence, while 45% are less comfortable than a year ago. We also note a rise in the use of unsecured debt, and buy-now pay-later (which will be the subject of an upcoming article based on new data we have captured). De-leveraging continues among those who can afford it.
On the savings front, those with market investments continue to enjoy paper capital growth, while dividends remains relatively stable. But those with term deposits continue to see rate compression and there is a move from term accounts to call accounts as the margin between the two have fallen further. More than 3 million households rely on income from bank deposits, and the reduction in the returns from deposits is having a dramatic impact on many. That said, many households remain adamant that they do not want to take on more market risk, so reluctantly accept lower income – which in turn flows to lower spending. 43% feel less comfortable than a year ago. Many are dipping to savings, and using capital for living expenses, something which may not be sustainable.
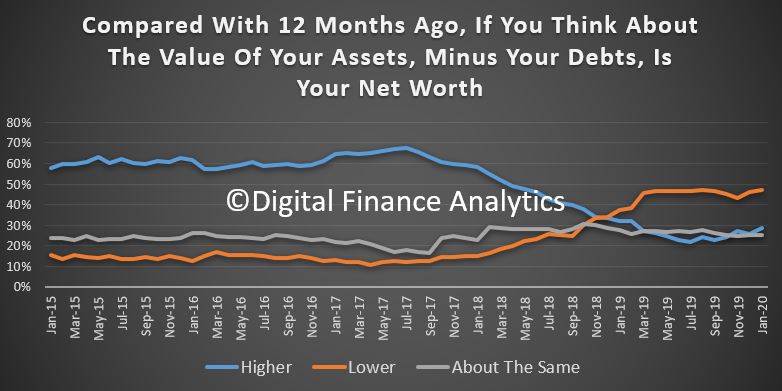
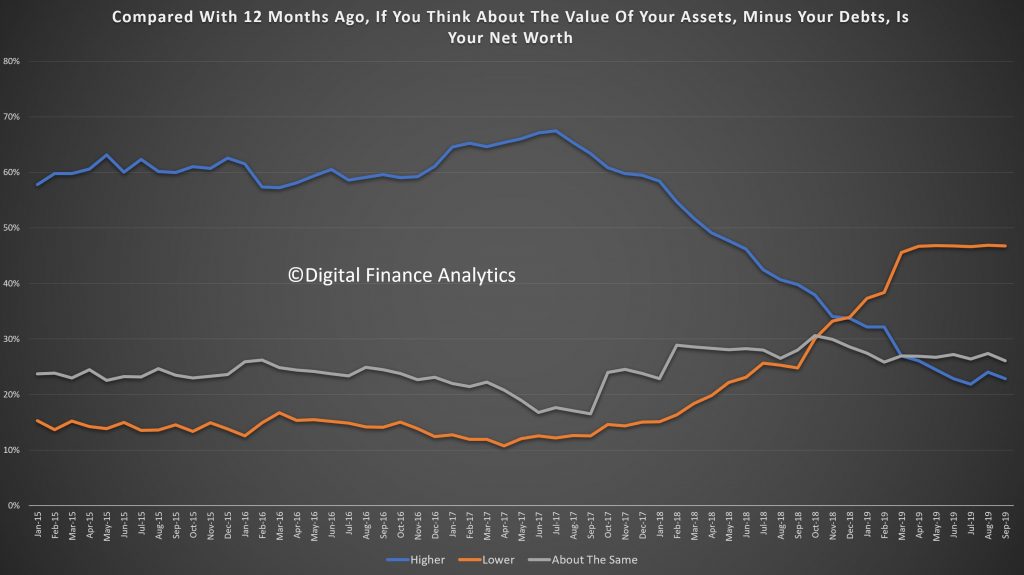
Finally, putting all this together we look at net worth – assets minus loans and other liabilities. The upturn in home prices reported in the media have flowed through to more expectations of growing wealth. 28% now have higher net worth than a year ago. That said 47% have lower net worth, thanks to rising expenses, and little in the way of savings. 24% reported no change. We note some significant differences between the more affluent segments and suburbs where net worth is rising (and supported by rising market investments) compared with regional areas and the urban fringe where there is no evidence of any wealth effect – so far. This is continue to dampen spending.
So, to conclude, we appear to have reached something of a floor in household financal confidence, but the journey back to more balanced settings will only be achieved once real incomes start to rise. Meantime the property recovering and wealth illusion may help a bit, but there is little here to suggest a rise in consumer spending. Many households are trapped in a high housing cost situation (either mortgage debt or rent) and with continued pressure in costs of living, the pressures will remain for some time to come.
The question is, what if anything might break the trend? Well income growth if it came, would assist on the upside, but then if growth stalls further thanks to the second order impacts from the virus, the confidence floor might just disappear. Households are in a finely balanced predicament.
We look at the latest results from our surveys to discover how households are reacting to the bush fires and other economic factors. Who are the winners and losers?
DFA is releasing the latest in our 52,000 household survey series examining household financial confidence. The score to mid January is an all-time low of 81.2, well below the neutral setting and the previous low back in 2015.
A series of events, including the bushfires and the perceived weakness in the Federal Government response, the volatility of the financial markets, and weak Christmas spending are all taking their toll. It is the biggest movement we have seen in the monthly series, so we expect a rebound next time, perhaps. But weak wages growth remains the underlying cause.
The survey did not reach those in the regional areas impacted by the bushfires directly, but is still statistically reliable elsewhere.
By way of background, these results are derived from our household surveys, averaged across Australia. We have 52,000 households in our sample at any one time. We include detailed questions covering various aspects of a household’s financial footprint. The index measures how households are feeling about their financial health. To calculate the index we ask questions which cover a number of different dimensions. We start by asking households how confident they are feeling about their job security, whether their real income has risen or fallen in the past year, their view on their costs of living over the same period, whether they have increased their loans and other outstanding debts including credit cards and whether they are saving more than last year. Finally we ask about their overall change in net worth over the past 12 months – by net worth we mean assets less outstanding debts.

Looking across the age bands, all household cohorts dropped, though younger households more so than older groups. Those aged 40-50 showed a significant fall. So this is a broad-based decline.
Across the states households in NSW and VIC dropped the most, and VIC was significantly impacted. These two states are net lower now than QLD, WA and SA, due to largest decline over the past year. Major urban centres here have been hit by smoke haze and poor environmental conditions which have really brought home the severity of the current bushfires. Plus jobs are an issue, and wages weak.
All property segments took a hit, but owner occupied households less so than property inactive (renting or living with friends or family) or property investors. Property investors continue to report weak rental returns, and higher vacancies, and little if any capital growth.
Looking at the moving parts within the index, those feeling more positive about job security fell 2.48% to 5.35, and those feeling about the same dropped by 2.35%, while those feeling less secure rose by 1%. This is caused by more underemployment (including bushfire related), more zero hours and gig economy jobs, and more households working in multiple part-time jobs. Retail, construction and tourism were specifically hit, as well as the agricultural sector. Those employed in the small business sector are specifically exposed.
As a result of the jobs issues, plus no growth, income is also under pressure. More than half of households reported lower income than a year ago, up 1.74%. Only 3% reported a real rise, down 0.98%, while 40% saw no change. These income pressures are significant and mounting. Those relying on income from bank deposits are seeing returns being trashed, but many households are not willing to switch to higher risk alternatives, preferring to trim their spending instead.
On the other hand, costs of living continue to outpace wages growth. A massive 95% of households reported higher costs than a year ago, up 1%. Costs are increasing across food staples (thanks partly to the drought and supply issues), school fees, childcare, healthcare, power and fuel. More households are considering cutting back on health insurance, and are seeking cheaper goods more generally. Those accessing food banks and other charitable assistance rose significantly.
Those with savings are continuing to dip into them to support their finances, though this is not necessarily sustainable. Those who received tax refunds, or some relief from lower mortgage rates are preferring to save the funds, or repay debt. They have no intention of increasing spending. Those with stocks and shares, or bonds – who tend to be more affluent – are fairing better, but even here, returns are under pressure from bank stocks. Concerns about the security of the banking system are on the rise.
The impact of lower interest rates have assisted at the margin, but two thirds of households receiving a cut preferred to maintain their original payments, thus paying off debt faster. However those in financial difficulty were able to extend their credit line, though multiple credit cards, personal loans, and structured payments like Afterpay. In addition, demand for short-term loans rose. As a result only 2% of households were more comfortable with their debts than a year ago, 46% less comfortable and 42% about the same.
Household net worth – assets minus debts – remain under pressure, with higher stock and property values for some offsetting pressures elsewhere. One quarter of households said their net worth was higher than a year ago (remembering that home prices dropped in the first half of 2019), while 46% said their net worth was lower now, and one quarter said there was no change.
Looking across our wealth segments, all three dropped, though those holding property, but no mortgage were relatively more positive (though below neutral) compared with those with mortgages or those renting.
This is a serious signal of more economic trouble ahead, despite the fact that now the Federal Government has announced $2 billion in stimulus, plus state money, charitable donations and Government benefits for those impacted by the bushfires. However, the structural issues surrounding flat or falling real incomes and rising costs signals more financial pressure ahead. And as a result, we expect retail to remain slow, despite lower mortgage rates. We suspect the anomaly of strongly rising property prices (where they are occurring) will abate ahead. In many areas, though there has been no, or only a very limited recovery.
As a result, growth will remain anemic for some time yet, and household confidence will remain in the doldrums, though we would expect to see a small bounce next month as the bad news around the bushfires is absorbed. We think more fiscal stimulus will be required to turn this round, but the key is real wages growth, and we cannot see a route to that for some time yet.
We continue to release the data from our household surveys to end November 2019. Today we look at our Household Financial Confidence Index, which examines how households are feeling about their financial status, relative to a year ago.
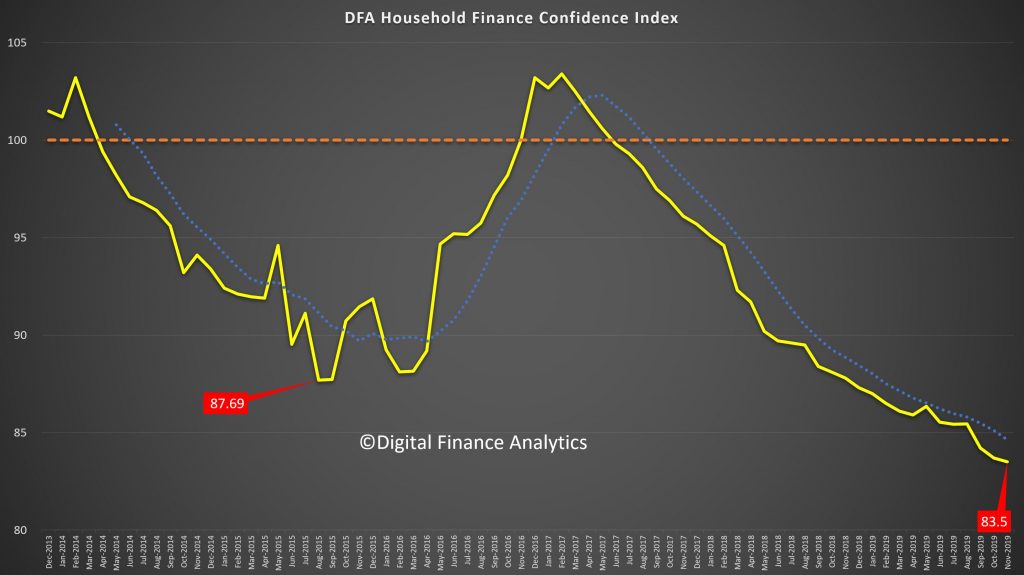
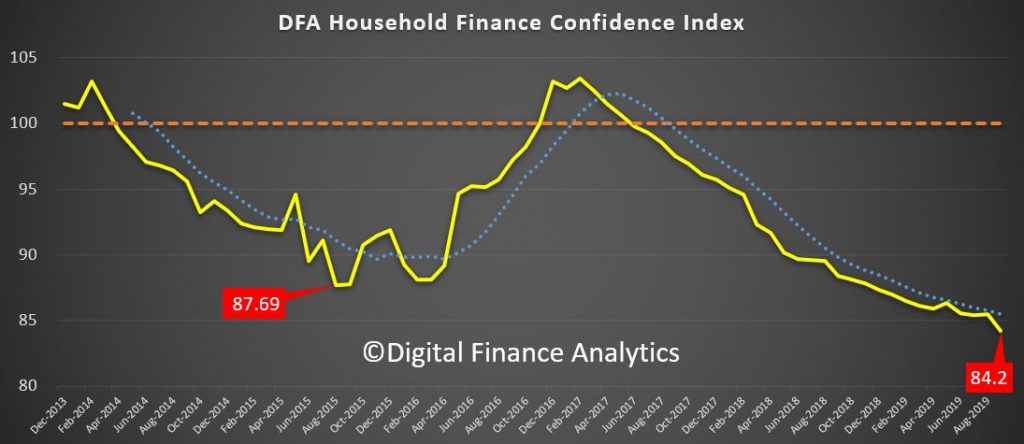
The index dropped again to 83.5, which is a new low in the series, and well below the previous 87.69 back in 2015. This level of concern suggests households will be keeping their wallets firmly in their pockets, so expect more retail weakness and household consumption easing lower ahead. The one “bright” spot was that more households are now believing their net worth is higher, thanks to the perceived recovery in home prices, and recent stock market highs, though offset by lower returns on deposits, flat incomes in real terms and rising costs. Recent rate cuts and tax refunds do not seem to have touched the sides!
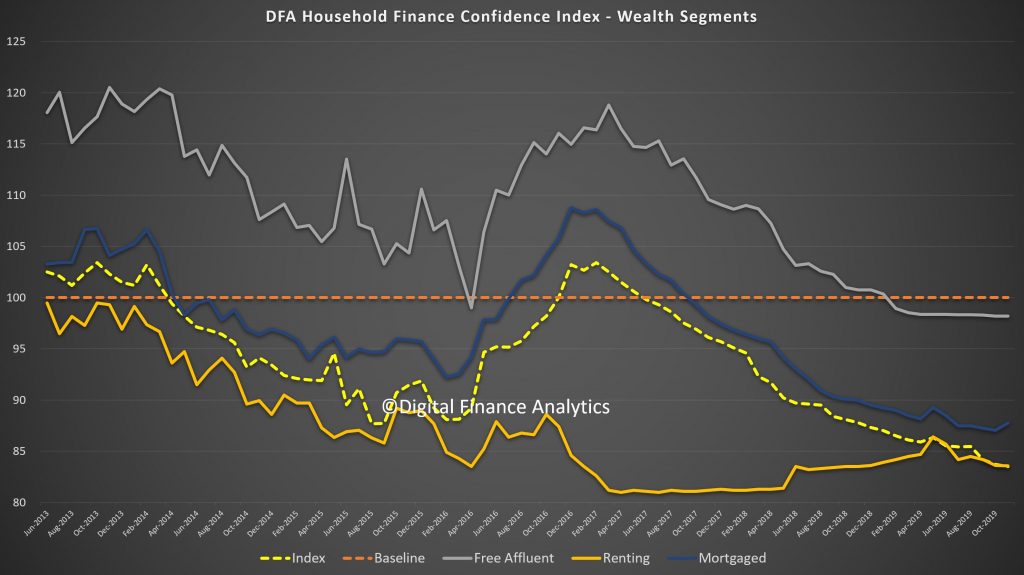
The declines in confidence are broad based, with those mortgage free still below neutral, while those with a mortgage still more negative, and those in the rental sector (without property) even more down than that.
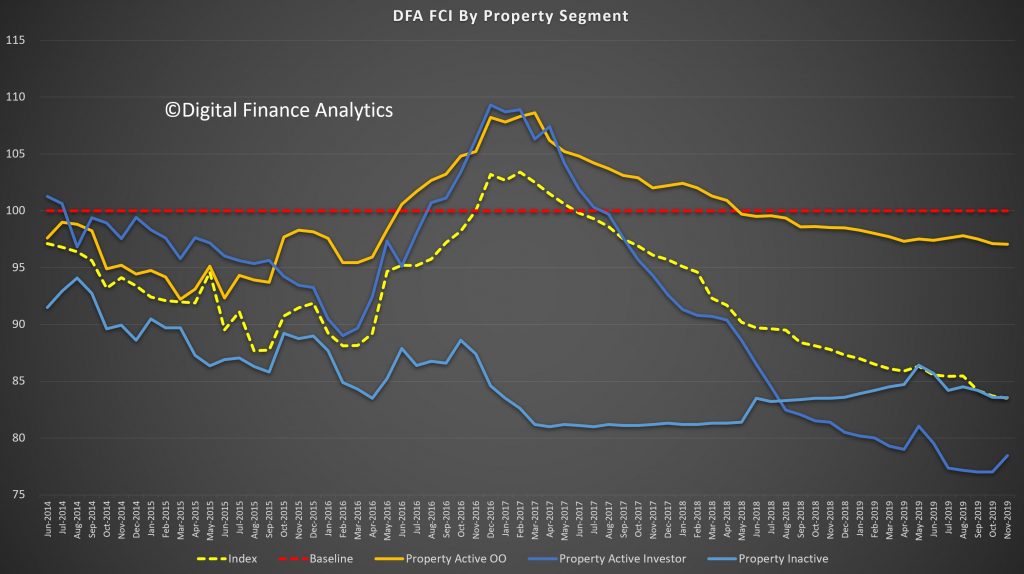
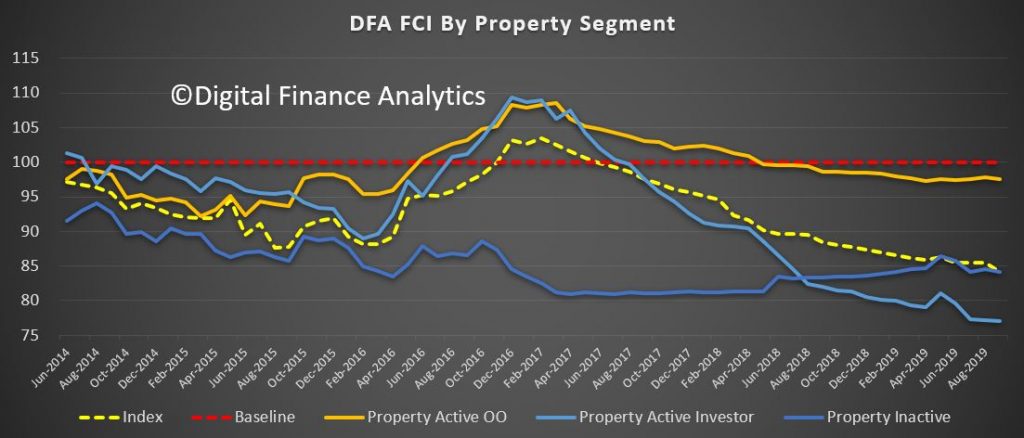
The news about rising home prices as impacted property investors, despite the continued weakness in rental income, thus we see a rise from very low levels for this cohort, from 77.01 to 78.45 in the month. On the other hand, property active owner occupied households were a little less positive, moving from 97.1 to 97.05. Property inactive households also drifted lower.
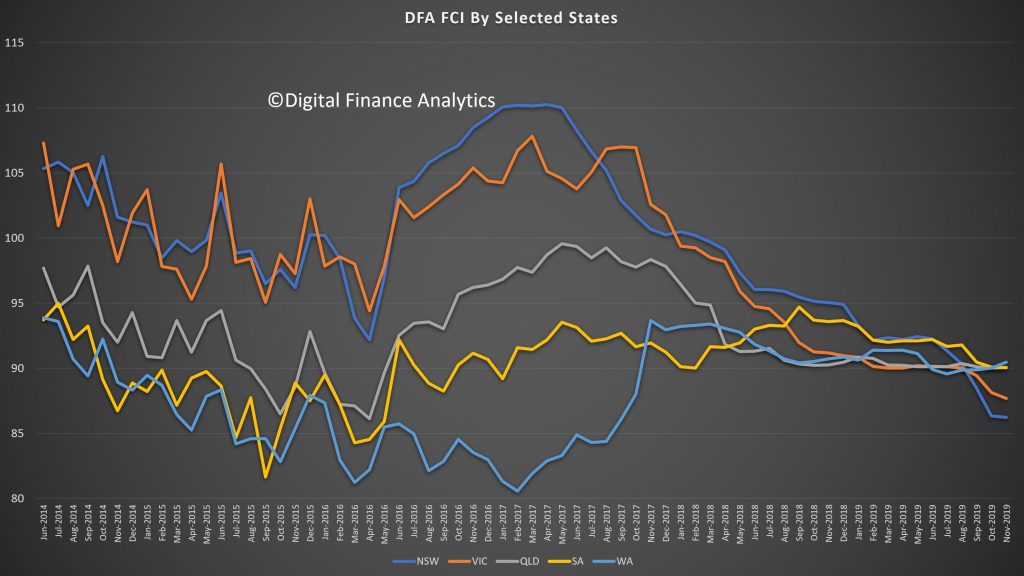
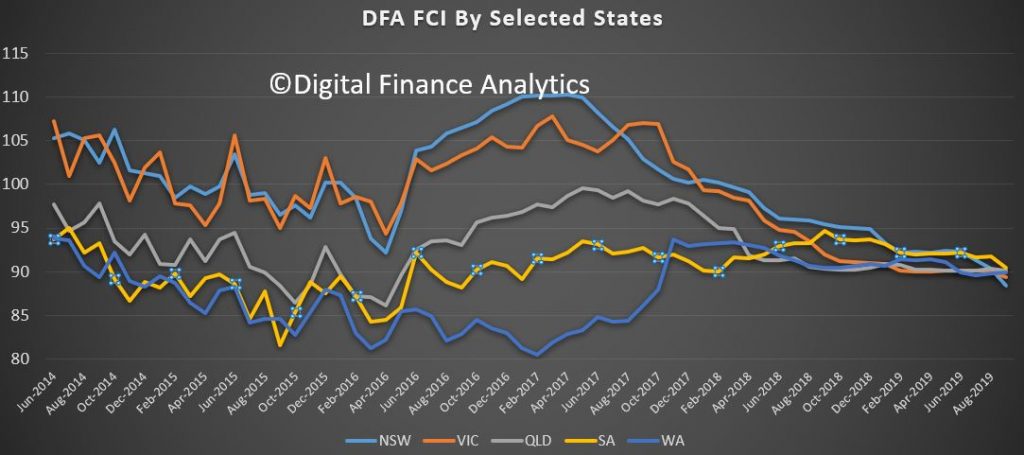
Across the states there was a significant decline in NSW, from 88.4 to 86.2, and this is connected with rising household budget pressures, and large mortgages in Sydney, plus the fires and drought across the state. VIC fell a little too, while there was a small rise in WA.
Across the age bands, those aged 20-30 reported the largest fall, thanks to pressure on incomes and rising costs. A number of new first time buyers who bought in recent months reside here. On the other hand, older cohorts are a little more positive this month, thanks to recent stock market rises, and some better home price news. We note, for example the headline of 6% plus rises in prices across Sydney have been interpreted by households in ALL post codes as appropriate to them – which shows the impact of a tricky headline, remembering that price rises are much higher in the more affluent upmarket postcodes.
Turning to the moving parts within the index, job security is under pressure, thanks to underemployment, weakness in retail and construction, and the upcoming holidays. 7.8% felt more secure than a year ago, down from 8.23% last month. 38.65% said they were less secure compared with 38.12% last month.
Incomes remain under pressure, with just 4.3% saying in real terms their incomes were higher than a year back, down from 5.3% last month. Pressure on household budgets is a pincer movement, as incomes are compressed (and returns from some investments and deposits fall). But costs of living are rising. In fact 94.2% reported higher costs than a year back, thanks to higher prices for fuel, electricity, school fees, childcare, and every needs. Only 1.3% said their costs of living had fallen.
Debt remains a major issue for many households, despite the rate cuts. Some households are paying down their mortgage faster than required, and are using the lower rates, and tax refunds for this. In an era of uncertainty, this is not a surprise. We also see a rise of households under pressure turning to payment options like AfterPay to support their purchases. Just 2% of households were more comfortable with their debt levels than a year ago, while 48% were less comfortable.
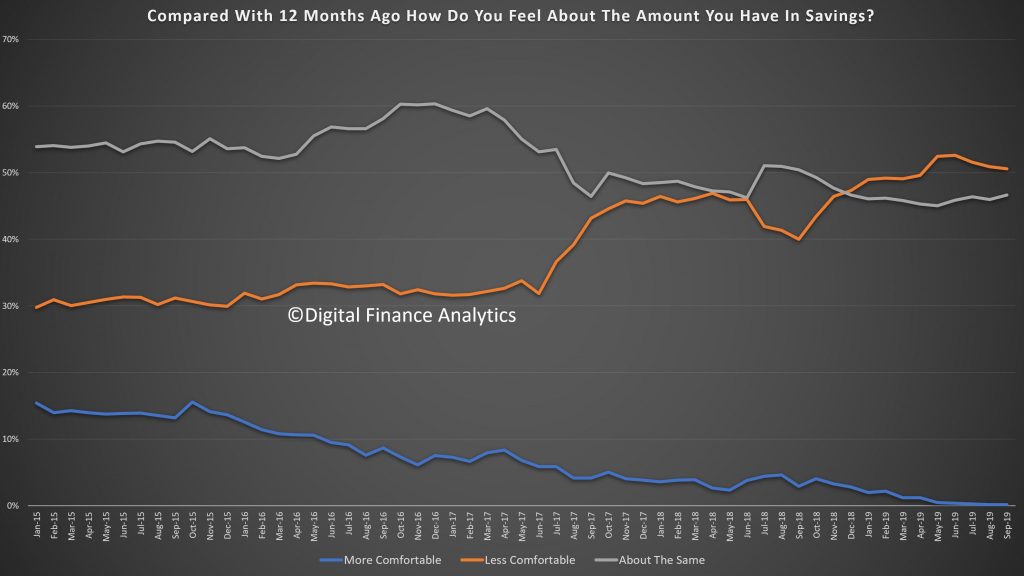
Some households have been building their savings (using lower mortgage rates and tax refunds) to build resilience for later. However, lower interest rates on deposits are creating its own pressures, while those with stocks and shares are seeing some dividend pressures too. Around 20% of households have insufficient funds to cover a month without work. Just 0.42% of households were more comfortable than a year ago, 49% were less comfortable and 45% about the same.
Finally, net worth – assets less liabilities, reacted to the higher reported home prices so that 27% say their net worth was better than a year ago up from 24% last month, while 43% were lower, and 24.65% about the same. Net worth was also boosted by high stock market prices and exchange rate movements.
So in conclusion, the household sector remains under pressure, and as a result financial confidence is bruised beyond immediate repair, that is until such time as wages growth really starts to accelerate in real terms. In addition the broader discussions about lower cash rates and quantitative easing are also helping to degrade confidence. The only bright spot, real or illusory, is the recovery in home prices (which are of course not uniform across the main centres and post codes). On this front, households are hoping for the best. We will see.
The bad news keeps coming, with the latest DFA Household Financial Confidence Index for October at the lowest ever of 83.7.
This continues the trends of recent months, since dropping through the neutral 100 score in June 2017.
The falls were widespread across our property segments, with investors still way down, under the pressure from low net rental yields, the need to switch to principal and interest from interest only, and worries about construction defects. Owner occupied households were less negative, but those renting continue to struggle with higher levels of rental stress.
Across the states there were significant falls in NSW and VIC, whilst other states continued to track as in recent months. The main eastern states are now lower than WA and SA, which is a surprising new development.
Across the age bands, the falls are mainly among lower aged groups, while those aged 50-60 are feeling more positive thanks to recent stock market rises.
This is also reflected across our wealth segments, with those holding property mortgage free and other financial assets more positive (though still below neutral) compared with mortgage holders and those not holding property at all.
We can then turn to the moving parts within the index, based on our rolling 52,000 household surveys. Employment prospects continue to look shaky, both in terms of under-employment and job security. Jobs in retail and construction and also finance are under-pressure, and the impact of the drought is also hitting some areas. 8% of household felt more secure than a year ago, the lowest read ever in this part of the survey. More households have multiple part-time jobs.
Income remains under pressure, with 51% saying their real incomes have fallen in the past year, while 5% reported an increase, often thanks to switching jobs or employers.

Household budgets are under pressure as costs of living rise, with 91% reporting higher real costs that a year ago, this is a record in our survey. Expenses rose across the board, from child care, health care, school fees and rates. Food costs were higher partly thanks to the drought. There was a small fall in the costs of power, and fuel, but not enough to offset rises elsewhere. Mortgage interest rate falls were blotted up quickly, and the tax refunds where they were received were much lower than people had been expecting.
Some households are deleveraging (paying down debt) , while others are more concerned about the amount they owe from mortgages to credit cards and on other forms of credit. 48% of households are less comfortable than a year ago. Lower interest rates are only helping at the margin.
Savings are under pressure from several fronts. Some households are tapping into savings to keep the household budget in check – but that will not be sustainable. Others are seeing returns on term deposits falling away, yet are unwilling to move into higher-risk investment assets. Those in the share markets are enjoying the current bounce, but many expressed concerns about its sustainability. 49% of households are less comfortable than a year ago, while 47% are about the same. Significantly around 27% of households have no savings at all and would have difficulty in pulling $500 together in an emergency. Around half of these households also hold a mortgage. Worth reflecting on this with 32.2% of households in mortgage stress as we also reported today!
And finally, we consider net worth (assets less liabilities). Here the news is mixed as some households are now convinced their property is worth more citing the recently if narrowly sourced data on rises in Sydney and Melbourne. However other households reported net falls. 24% of households said their net financial position was better than a year ago (up 1.3%), while 45% said they were worse off (down 1.6%). There are also significant regional differences with households in Western Australia and Queensland significantly worse off, while some in inner city areas of Sydney and Melbourne claimed significant advances.
So, overall the status of household confidence continues to weaken, which is consistent with reduced retail activity, and a focus on repaying debt. Unemployment is lurking, but underemployment is real. We also see weaker demand for mortgages ahead, and we will discuss this in more detail in our upcoming household survey release. Without significant economic change, these trends are likely to continue for some time. If the RBA and Government is relying on households to start spending, they will need a very different strategy – including a significant fiscal element. Lower interest rates alone will not cut the mustard.
Our September surveys show households remain in a careful state given the latest local and international economic news.
In our latest release to September 2019, the DFA Household Financial Confidence Index fell again, having move sideways more recently. In essence households are simply reflecting that rate cuts, a lower dollar and the international bad news from Trump’s Trade Wars, Brexit and Hong Kong are all making them more concerned, and less willing or able to spend. On top of that the local pressure on wages and rising costs, plus the heavy toll on savers with funds on bank deposit are also hitting. Finally, property is not in recovery mode and buying intentions are down again, after being a little higher after the election. The economy is in deep trouble. The Government and Regulatory response is not cutting the mustard from a household and small business perspective.
Overall the index fell to a new low of 84.2, compared with 85.5 last time, this is a significant one month fall.
All wealth segments faded, but those holding property without mortgage, and with market investment (stocks and shares) did a little better than those with a mortgage and those renting. All three segments are below their 100 neutral setting.
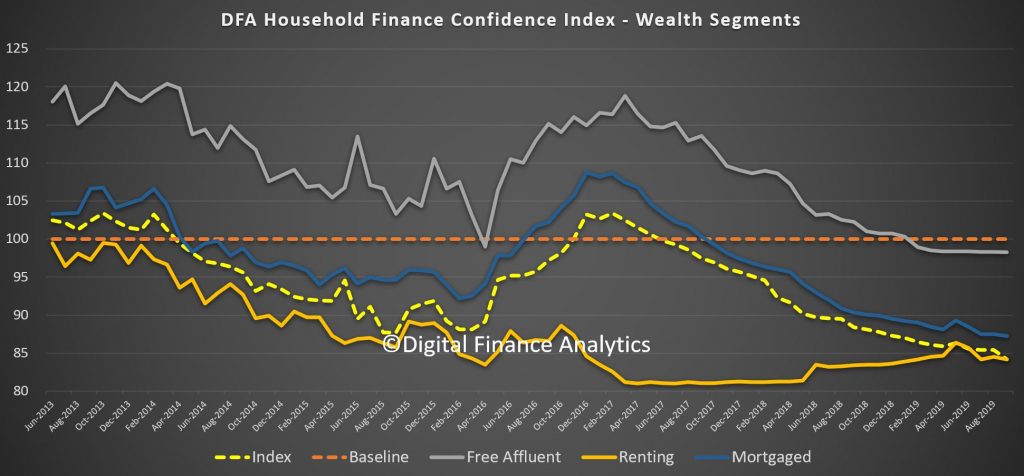
Across the property segments, those owner occupied households with a mortgage are relatively more positive compared with property investors who continue to see their rental streams under pressure, and now even those renting or living with family or friends are also reacting to costs of living rises, and flat incomes. We also registered a number who say landlords recently lifted their rental agreements, adding to the pain.
Across the states, the falls are relatively uniform, with the confidence levels bunching at low values in the eastern states. Falls in SA and QLD were offset by a slight rise in WA. But NSW and VIC both fell.
Across the age bands, those aged 50-60 registered a significant decline as falling income from bank deposits hit home following the recent cash rate cuts. All other segments fell too. This is a broad based decline.
Turning to the moving parts, household incomes remain under pressure, with little evidence of any recovery in the system. More than half have real incomes lower than a year ago.
Costs of living continue to rise, and recent petrol prices are making an impact, along with council rates and childcare costs. Food bills are also rising and here the impact of the drought is hitting some costs hard now. 92% of households reported a rise in living costs compared with one year ago.
Savings are under pressure, as many households continue to tap into their savings to support their life-styles. But those with savings in bank deposits continue to see rates falling, meaning that incomes from deposits are being crushed. That said, of the 3 million relying on income from savings, less than one third are considering seeking out higher risk saving options to boost returns. The rest are moderating their spending patterns to suit the new low rate environment. However, there are limits to this approach as rates continue to tumble. Those on fixed term rates are facing a real challenge when their funds are due to roll next!
Rate cuts have helped at the margin, but there was a further rise in those feeling less comfortable about their level of debt. We see a rise in concern about making monthly repayments on time, but also an issue with paying off debt in due course (given home price growth is anemic at best). Many continue to pay down credit card debt, though a minority continue to accumulate more debt, in order to balance their budgets.
Employment prospects are under pressure in the retail and construction sectors, across all states. There was a 1% fall in those feeling more comfortable, to 8.6%. But there is a marked fall in NSW and VIC and there residential construction has stalled. Employment prospects are brighter in the Public Sector, so Canberra is showing more positive news here.
Finally, net worth has taken a hit again, as property values are not rising for many (and the evidence of negative equity is growing). The oft quoted recent rises in Sydney and Melbourne clearly do not tell the full story. Property investors with units across the country are increasingly nervous about the true value of their property in the light of the poor quality certification and construction issues which are rife in the sector.
So, there is really little here to offset the gloom. Whilst lower cash rates may translate to lower mortgage rates for some, this is not sufficient to counter the negative news. And more households are seeking to pay down debt in an attempt to protect themselves ahead.
This signals more economic weakness ahead.