Australian Debt Servicing Ratios Higher and More Risky

The Bank for International Settlements released their updated Debt Service Ratio (DSR) Benchmarks overnight. A high DSR has a strong negative impact on consumption and investment.

Australia (the yellow dashed line) is second highest after the Netherlands. We are above Norway and Denmark, and the trajectory continues higher. Further evidence that current regulatory settings in Australia are not correct. As the BIS said yesterday, such high debt is a significant structural risk to future prosperity.

The DSR reflects the share of income used to service debt and has been found to provide important information about financial-real interactions. For one, the DSR is a reliable early warning indicator for systemic banking crises.

The DSRs are constructed based primarily on data from the national accounts. The BIS publishes estimated debt service ratios (DSRs) for the household, the non-financial corporate and the total private non-financial sector (PNFS) using standardised data inputs for 17 countries.

UK Tightens Banking Controls

The Bank of England released their June 2017 Financial Stability Report. They announced a number of measures which together tighten controls on the banks, in response to growing risks in the system from strong lending momentum. They confirmed the need to act, ahead of any impending crisis, by thinking about “tail risks” in the system.

They reintroduced a counter-cyclical capital buffer, which was removed after the Brexit vote.

They are concerned about systemic risks from high loan-to-income mortgage lending, and said lenders should use a 3% serviceability buffer from their standard variable rate and also confirmed the limit on lending with a LTI of 4.5 times will be an ongoing feature of the market.

Mortgage lending at high loan to income ratios is increasing and the spreads and fees on mortgage lending have fallen. If lenders were to weaken underwriting standards to maintain mortgage growth, the FPC’s measures would limit growth in the number of highly indebted households. This would have material benefits for economic and financial stability by mitigating the further cutbacks in spending that highly indebted households make in downturns.

Here are a some of the interesting slides. The proportion of investor loans in the UK sits at around 17% of all loans, compared with 35% in Australia – yet the UK authorities are concerned at this level and have taken a number of steps to reduce momentum in this sector of the market.

Higher DSR households are much more likely to default, the UK are tracking this, yet in Australia there is no reporting on DSR by the regulators. We are relying on LVR, which is a poor measure of risk, as it depends on property values.

Likewise, they also show that Loan to Income (LTI) is important in that higher LTI households have less disposable income, and in a crisis are more at risk; plus their inability to spend has a depressive impact on economic growth. Once again, they track this, and have policy on the limit of mortgages above 4.5 times. In Australia, there is no regular flow of information on LTI, no policy on this, and yet we face significant economic slow-down as highly leveraged households cut their spending.

You can watch the presentation.


The Financial Policy Committee (FPC) aims to ensure the UK financial system is resilient to the wide range of risks it faces.

The FPC assesses the overall risks from the domestic environment to be at a standard level: most financial stability indicators are neither particularly elevated nor subdued.

As is often the case in a standard environment, there are pockets of risk that warrant vigilance. Consumer credit has increased rapidly. Lending conditions in the mortgage market are becoming easier. Lenders may be placing undue weight on the recent performance of loans in benign conditions.

Exit negotiations between the United Kingdom and the European Union have begun. There are a range of possible outcomes for, and paths to, the United Kingdom’s withdrawal from the EU.

Some possible global risks have not crystallised, though financial vulnerabilities in China remain pronounced.

Measures of market volatility and the valuation of some assets — such as corporate bonds and UK commercial real estate — do not appear to reflect fully the downside risks that are implied by very low long-term interest rates.

To ensure that the financial system has the resilience it needs, the FPC is:

  • Increasing the UK countercyclical capital buffer rate to 0.5%, from 0%. Absent a material change in the outlook, and consistent with its stated policy for a standard risk environment and of moving gradually, the FPC expects to increase the rate to 1% at its November meeting.
  • Bringing forward the assessment of stressed losses on consumer credit lending in the Bank’s 2017 annual stress test. This will inform the FPC’s assessment at its next meeting of any additional resilience required in aggregate against this lending. The FPC further supports the intentions of the Prudential Regulation Authority and Financial Conduct Authority to publish, in July, their expectations of lenders in the consumer credit market.
  • Clarifying its existing insurance measures in the mortgage market, designed to prevent excessive growth in the number of highly indebted households. This will promote consistency across lenders in their application of tests to assess whether new mortgage borrowers can afford repayments.
  • Consistent with its previous commitment, restoring the level of resilience delivered by its leverage ratio standard to the level it delivered in July 2016 before the FPC excluded central bank reserves from the leverage ratioexposure measure. The FPC intends to set the minimum leverage requirement at 3.25% of non-reserve exposures, subject to consultation.
  • Overseeing contingency planning to mitigate risks to financial stability as the United Kingdom withdraws from the European Union.
  • Building on the programme of cyber resilience testing it instigated in 2013, by setting out the essential elements of the regulatory framework for maintaining cyber resilience. It will now monitor that each element is being fulfilled by the relevant UK authorities.

Debt Servicing Ratio Update Highlights Risks

The BIS has released the latest DSR data for major economies. Australia sits firmly near the top, alongside Norway, Netherlands, Canada and Hong Kong. USA and UK are significantly lower.

The DSR reflects the share of income used to service debt and has been found to provide important information about financial-real interactions. For one, the DSR is a reliable early warning indicator for systemic banking crises. Furthermore, a high DSR has a strong negative impact on consumption and investment. The DSRs are constructed based primarily on data from the national accounts. You can read more about the index here.

Here are comparative charts to September 2016.

The trends over time are also interesting, as interest rates and debt levels change. I have removed a few countries to make the chart easier to read.

The BIS says:

Debt forms a central part of the narrative of financial crises and financial cycles more generally. Leverage, often proxied at the aggregate level by the ratio of the stock of liabilities (ie debt) to income, has received much attention as an indicator of financial excesses and vulnerabilities. Less discussed, but equally important, is the debt service ratio (DSR), which captures the share of income used for interest payments and amortisations. These debt-related flows are a direct result of previous borrowing decisions and often move slowly as they depend on the duration and other terms of credit contracts. They have a direct impact on borrowers’ budget constraints and thus affect spending.

Since the DSR captures the link between debt-related payments and spending, it is a crucial variable for understanding the interactions between debt and the real economy. For instance, during financial booms, increases in asset prices boost the value of collateral, making borrowing easier. But more debt means higher debt service ratios, especially if interest rates rise. This constrains spending, which offsets the boost from new lending, and the boom runs out of steam at some point. After a financial bust, it takes time for debt service ratios, and thus spending, to normalise even if interest rates fall, as principal still needs to be paid down. In fact, the evolution of debt service burdens can explain the dynamics of US spending in the aftermath of the Great Financial Crisis fairly well. In addition, DSRs are also highly reliable early warning indicators of systemic banking crises.

Household Debt Service Ratio Latest Data

The BIS has just released their December 2016 update of comparative Debt Service Ratios for Households. Australia sits below Netherlands and Norway, but well above most other countries, including USA, UK and Canada. We are awash with household debt, but remember our current interest rates are ultra low. The ratio will deteriorate as rates rise, which is what we expect to happen.

By way of background, the debt service ratio (DSR) is defined as the ratio of interest payments plus amortisations to income. As such, the DSR provides a flow-to-flow comparison – the flow of debt service payments divided by the flow of income.

It takes the stock of debt, and the average interest rate on the existing stock of debt. To accurately measure aggregate debt servicing costs, the interest rate has to reflect average interest rate conditions on the stock of debt, which contains a mix of new and old loans with different fixed and floating nominal interest rates attached to them. The average interest rate on the stock of debt is proxied by the average lending rates on loans from  financial institutions.

So whilst there will be some cross-border statistical variations, we can be confident the results are relatively accurate.

But Australian Firms Have High DSR’s Too

Australian firms have some of the highest Debt Service Ratio’s in the world according to data from the Bank for International Settlements. Alongside the household Debt Service Ratios, which we discussed earlier BIS also published a series on the DSR’s of non-financial companies.

Australian and Canadian companies have the highest DSR’s and both show a strong upward trajectory. Many other countries have lower, and flatter profiles. The higher the DSR, the greater the strain on company cash flow.

This many well explain the relatively slow rise in additional debt being drawn down by Australian firms (other than funding for investment property!) and the knock-on effects of lower real productive growth.

coy-dsr-bis-mar-2016We think DSR’s should be more widely studied as a bellwether for future economic performance.

New DSR Comparisons Confirms High Australian Household Debt

Australian households have the third highest, and rising debt service ratio, when compared to a wide range of advanced western economies, according to new data released by the Bank for International Settlements (BIS).

This is a timely update from BIS who calculated DSR’s for households and non-financial companies using data from countries national accounts. You can read about their approach here.

The comparative results are interesting, especially give low global interest rates. There are significant variations and the last results are to March 2016.

Australia is near the top of the DSR scores at 15.1, well behind Netherlands and just below Norway. Many other advanced economies are much lower. However, we also see a different trajectory in Australia, with stronger growth here, compared with a static or falling pattern elsewhere.

This is further evidence of the household debt problem here. Of course we had cash rate cuts later in the year, but debt has continued to rise, and our estimate is average household DSR currently sits around 16. If we are right, the rising trajectory has continued.

dsr-bis-mar-2016You can read our more detailed DSR analysis of Australian households, where we discuss the profile across postcodes.

How Much Income is Used for Debt Payments?

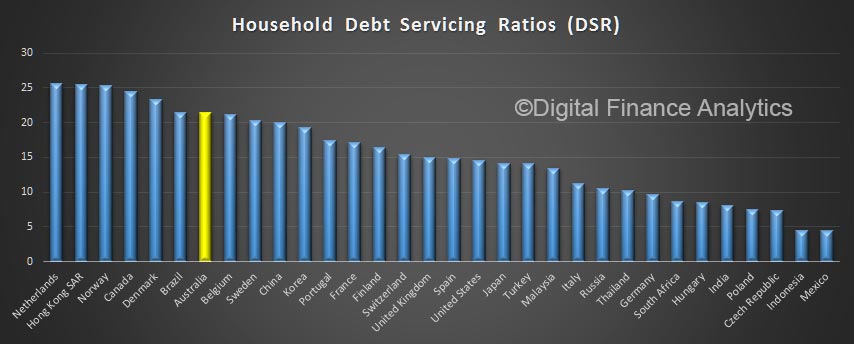
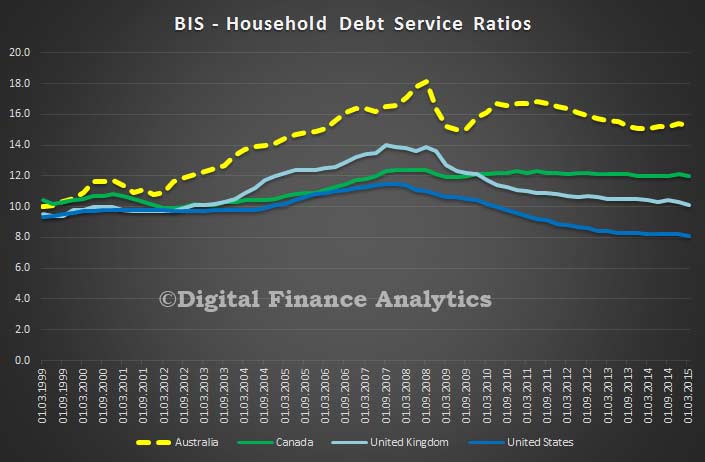
Australian Households have some of the highest debt service ratios (DSRs) in the world according to a new database from the Bank for International Settlements. In this post we overview the BIS analysis and discuss some of the results. They confirm earlier analysis that households here are highly leveraged and so at risk should interest rates rise, especially when incomes are static or falling in real terms.

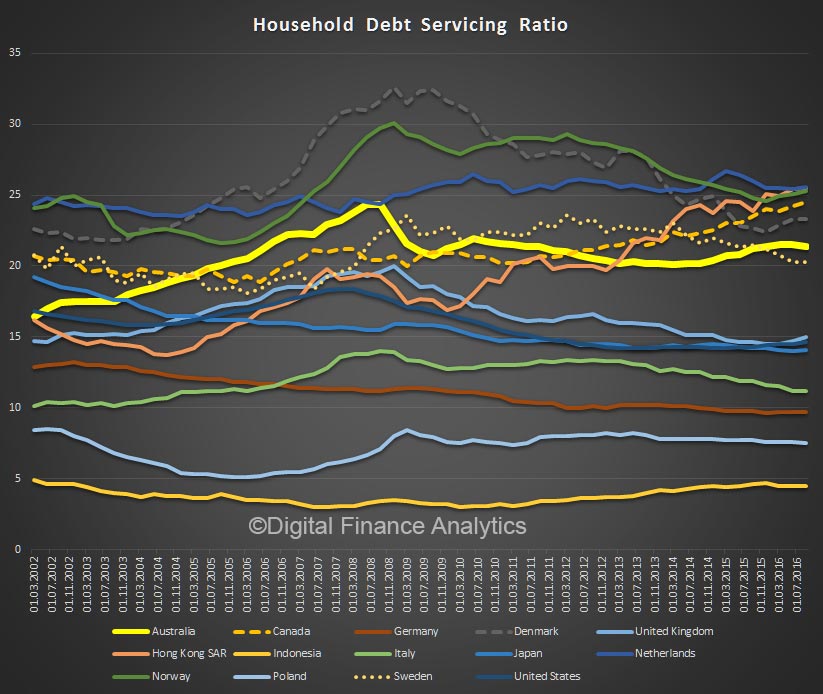
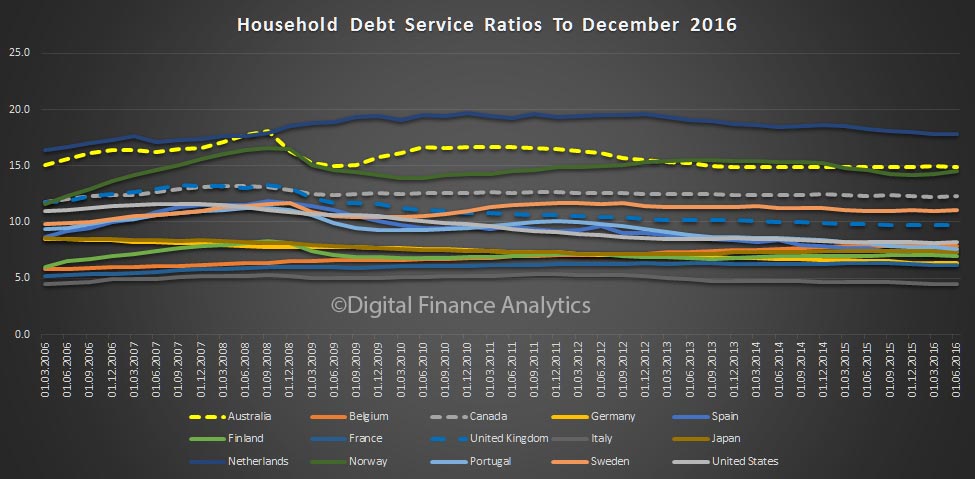
We have charted the raw outputs, for the main countries, and focused on households. If we look at the relative position of Australia, UK, Canada and USA, Australia has a higher DSR, not least because we have so far not experienced a significant drop in house prices, and mortgage lending is very high. This is consistent with previous analysis and is also the recommended measure for macroprudential purposes.

BIS-DRS-1
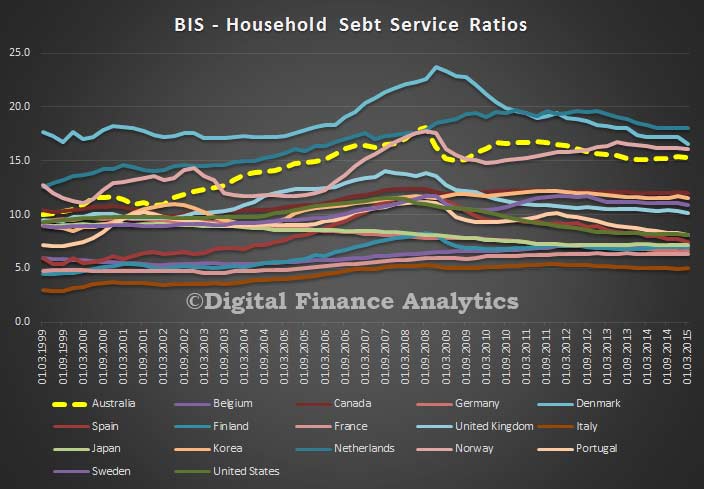
Looking more broadly at the 17 countries showing similar data, we sit fourth behind Netherlands, Sweden and Denmark. Note also the significant gap between these four and the rest of the set.

BIS-DSR-2
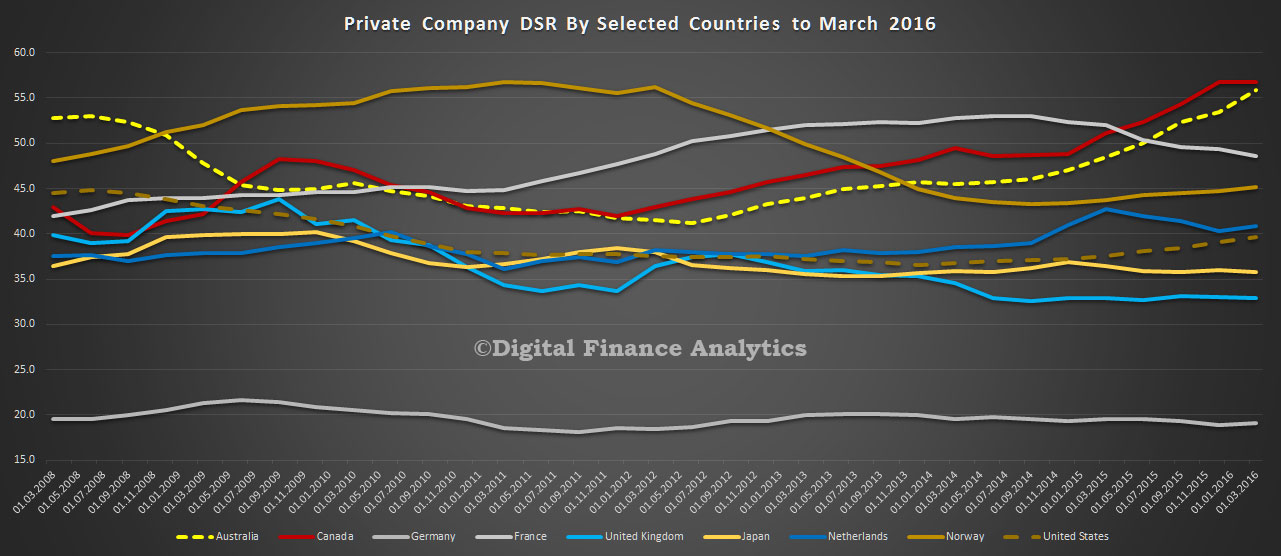
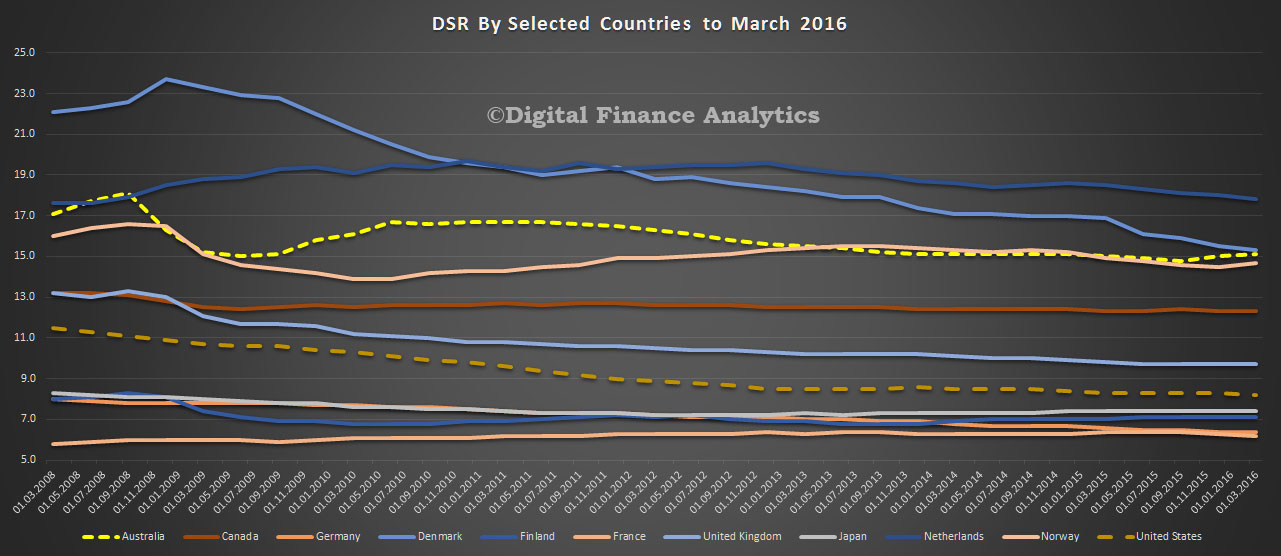
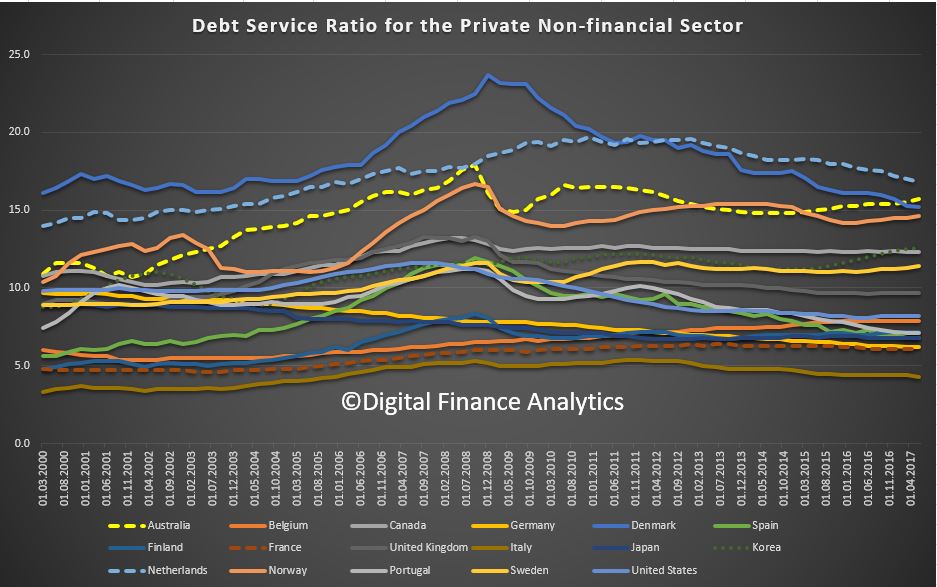
By way of background, DSRs provide important information about the interactions between debt and the real economy, as they measure the amount of income used for interest payments and amortisations. Given this pivotal role, the BIS has started to produce and release aggregate DSRs for the total private non-financial sector for 32 countries from 1999 onwards. For the majority of countries, DSRs for the household and the non-financial corporate sectors are also available.

DSR is important, as it captures the share of income used for interest payments and amortisations. These debt-related flows are a direct result of previous borrowing decisions and often move slowly as they depend on the duration and other terms of credit contracts. They have a direct impact on borrowers’ budget constraints and thus affect spending. Despite this, in Australia there is no comprehensive reporting, just gross household debt and household repayments.

Since the DSR captures the link between debt-related payments and spending, it is a crucial variable for understanding the interactions between debt and the real economy. For instance, during financial booms, increases in asset prices boost the value of collateral, making borrowing easier. But more debt means higher debt service ratios, especially if interest rates rise. This constrains spending, which offsets the boost from new lending, and the boom runs out of steam at some point. After a financial bust, it takes time for debt service ratios, and thus spending, to normalise even if interest rates fall, as principal still needs to be paid down. In fact, the evolution of debt service burdens can explain the dynamics of US spending in the aftermath of the Great Financial Crisis fairly well. In addition, DSRs are also highly reliable early warning indicators of systemic banking crises.

BIS has developed a methodology to enable comparisons to be made across countries.  The DSR is defined as the ratio of interest payments plus amortisations to income. As such, the DSR provides a flow-to-flow comparison – the flow of debt service payments divided by the flow of income.

At the individual level, it is straightforward to determine the DSR. Households and firms know the amount of interest they pay on all their outstanding debts, how much debt they have to amortise per period and how much income they earn. But even so, difficulties can arise. Many contracts can be rolled over so that the effective period for repaying a particular loan can be much longer than the contractual maturity of the specific contract. Equally, some contracts allow for early repayments so that households or firms can amortise ahead of schedule. Given this, deriving aggregate DSRs from individual-level data does not necessarily lead to good estimates. And such data are rarely comprehensive, if available at all. For this reason, BIS derive aggregate DSRs from aggregate data directly.

While interest payments and income are recorded in the national accounts, amortisation data are generally not available and hence present the main difficulty in deriving aggregate DSRs. To overcome this problem, BIS follow an approach used by the Federal Reserve Board to construct debt service ratios for the household sector which measures amortisations indirectly. It starts with the basic assumption that, for a given lending rate, debt service costs – interest payments and amortisations – on the aggregate debt stock are repaid in equal portions over the maturity of the loan (instalment loans). The justification for this assumption is that the differences between the repayment structures of individual loans will tend to cancel out in the aggregate. They also make a range of assumptions about average loan durations.  You can read about the full methodology here.