The Growing Skill Divide in the U.S. Labor Market

The St. Louis Fed On The Economy Blog has highlighted a polarization in the labor market, between skilled employees capable of performing the challenging tasks in the cognitive nonroutine occupations and entry-level employees that are physically strong enough to perform the manual nonroutine tasks.

Over the past several decades, the skill composition of the U.S. labor market has shifted. Employers are hiring more workers to perform nonroutine types of tasks (such as managerial work, professional services and personal care) and fewer workers for routine operations (such as construction and manufacturing). This shift in the type of skills in demand is referred to as job polarization.

One way to see evidence of job polarization is to look at employment growth in certain occupational classifications. The figure below divides occupational employment growth into four groups:

  • Cognitive Nonroutine: managers, computer scientists, architects, artists, etc.
  • Manual Nonroutine: food preparation, personal care, retail, etc.
  • Cognitive Routine: office and administrative, sales, etc.
  • Manual Routine: construction, manufacturing, production, etc.

average annual employment growth

The black lines represent the average growth rate across all occupations within a group, while the bars represent the growth rate in that particular occupation.

The fastest growing occupational groups are cognitive nonroutine and manual nonroutine, both growing about 2 percent every year on average since the 1980s. Cognitive routine and manual routine occupations are growing significantly slower, less than 1 percent on average (or shrinking, in the case of production occupations).

Physical Demands of Work

One of the implications of job polarization is a shift in the type of work required to be performed by the average employee. A new survey from the Bureau of Labor Statistics—the Occupational Requirements Survey—gathers data on the type of work performed in each occupation.

The figure below looks at two physical task requirements:

  • The percentage of hours in an eight-hour day spent standing or walking
  • The percentage of workers required to perform pushing or pulling tasks with one or both hands

physical task requirements

The most physically demanding occupational groups are manual nonroutine and manual routine. In both of these groups, on average more than half of the employees are required to push or pull with their hands, and over half of their day is spend standing or walking.

In contrast, less than 35 percent of workers in the cognitive nonroutine and cognitive routine groups push or pull with their hands. These groups also spend much less time standing/walking.

Decision-Making at Work

The last figure looks at two cognitive task requirements:

  • The percentage of workers where decision-making in uncertain situations or conflict is required
  • The percentage of workers whose supervision is based on broad objectives and review of results

These requirements are easier to think about in terms of a spectrum. For example, occupations that require less cognitive activity either lack decision-making entirely or involve straightforward decisions from a predetermined set of choices.

Similarly, occupations with a greater cognitive requirement usually involve broad objectives with end-result review only, while more manual occupations require detailed instructions and frequent interactions with supervision (for example, a consultant’s quarterly performance review versus daily quality control checks in a factory).

cognitive task requirements

By a large margin, the cognitive nonroutine occupations involve more challenging decision-making and less frequent interactions with supervision. The other occupational groups all have fewer than 10 percent of employees engaging in these types of cognitive tasks.

Job Growth According to Skill Requirements

The figures above show a stark contrast between the skill requirements in the two occupational groups growing the fastest. The cognitive nonroutine group requires complex decision-making, independent working conditions and less physical effort, while the manual nonroutine group still requires quite a bit of physical effort and does not involve a high level of cognitive tasks.

Unemployment Rate at 5.8 per cent for the Fourth Consecutive Month

The latest employment data from the ABS does not look too bad on first blush, it beat expectations, especially if you go for the wobbly seasonally adjusted series. However the continued rise in part-time employment (up 3.6%) compared with full-time (up 0.1%) highlights the problem with low take home pay, and when added to the falling wage growth in real terms, it explains why household finances are taking a battering, and why mortgage stress is up again.  Also significant differences if you compare WA with NSW.

Trend employment increased by 19,900 persons to 12,071,300 persons in April 2017, according to figures released by the Australian Bureau of Statistics (ABS) today. Total employment growth over the year was 1.3 per cent, which remains below the average growth rate over the past 20 years of 1.8 per cent.

Over the past year there was a larger increase in trend part-time employment (102,800) than full-time employment (49,300) – around two-thirds of the total increase in employment. This was considerably more pronounced in the trend hours worked, which grew by 3.6 per cent for the part-time employed, and 0.1 per cent for those employed full-time.

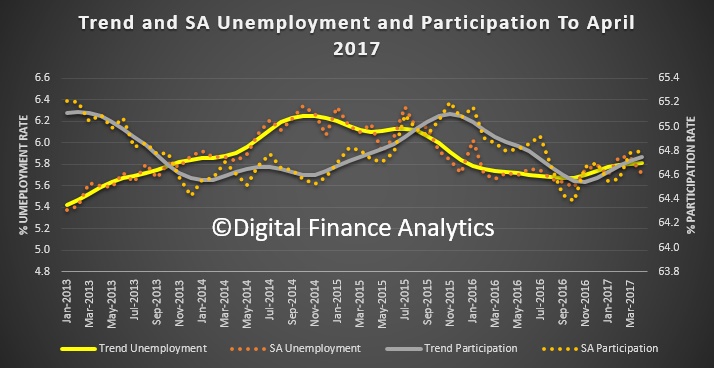
Australia’s trend unemployment rate remained at 5.8 per cent for the fourth consecutive month.

“For almost 18 months, the trend unemployment rate has been relatively stable, at around 5.7 to 5.8 per cent” said Bruce Hockman, General Manager of the ABS Macroeconomic Statistics Division. “We haven’t seen this stability since the May 2007 to October 2008 period, when it remained around 4.2 to 4.3 per cent.”

The trend participation rate increased by less than 0.1 percentage points to 64.8 per cent.

Trend series smooth the more volatile seasonally adjusted estimates and provide the best measure of the underlying behaviour of the labour market.

The seasonally adjusted number of persons employed increased by 37,400 in April 2017. The seasonally adjusted unemployment rate decreased 0.2 percentage points to 5.7 per cent, and the seasonally adjusted labour force participation rate remained steady at 64.8 per cent.

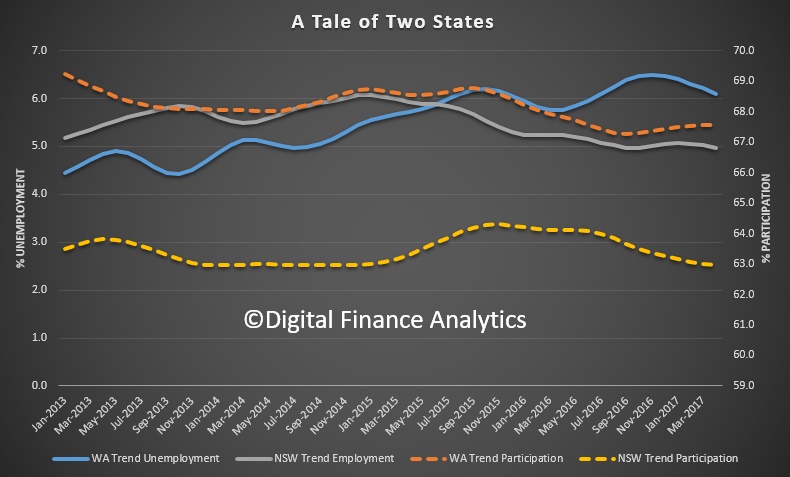
The comparison between the numbers in WA and NSW (the last and first placed states from an economic perspective) tells an interesting story.

Unemployment has been falling in NSW, and has turned the corner in WA, after a steady climb. However the participation rate in WA is significantly higher and is rising, whilst it is lower and falling in NSW. This reflects a range of factors, including demographic distribution, industry mix and part time work options.  The falling rate in NSW should be regarded as a warning of trouble ahead when it comes to looking at household finances.

Trend employment growth strengthens in March

Trend employment increased by 16,500 to 12,033,400 persons in March 2017, according to figures released by the Australian Bureau of Statistics (ABS) today. Total employment growth over the year was 1.0 per cent, just over half the average growth rate of the past 20 years (1.8 per cent).

“We have seen strengthening in full-time growth over recent months, following falls in full-time employment recorded through much of 2016” said the Acting General Manager of ABS’ Macroeconomic Statistics Division, Jacqui Jones.

The trend monthly hours worked decreased by 0.4 million hours (0.02 per cent), with decreases in total hours worked by both full-time and part-time workers.

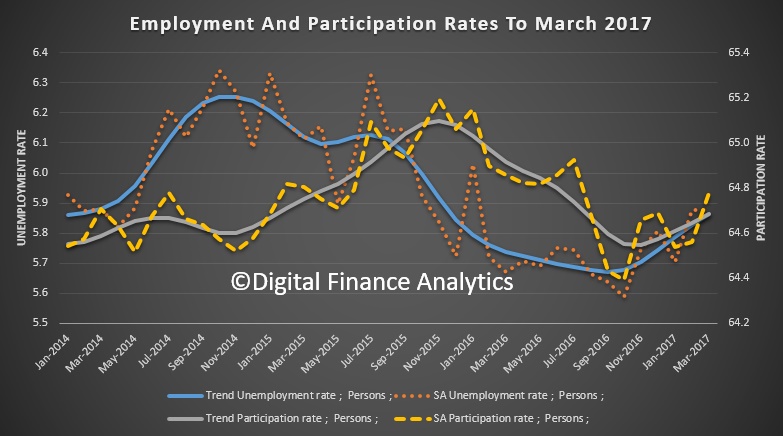
The trend unemployment rate in Australia increased by less than 0.1 percentage points, to 5.9 per cent in March 2017. The trend participation rate also increased slightly, to 64.7 per cent.

Trend series smooth the more volatile seasonally adjusted estimates and provide the best measure of the underlying behaviour of the labour market.

The seasonally adjusted number of persons employed increased by 60,900 in March 2017. The seasonally adjusted unemployment rate remained steady at 5.9 per cent, and the seasonally adjusted labour force participation rate increased 0.2 percentage point to 64.8 per cent.

US Unemployment Rate was 4.5 percent in March

According to the US Bureau of Labor Statistics, the unemployment rate was 4.5 percent in March 2017. The last time the unemployment rate was 4.5 percent was during the first half of 2007.

The March unemployment rate of 4.5 percent resulted from there being 7.2 million unemployed people among the 160.2 million people in the labor force. People were counted as unemployed if they did not work for pay during the week that included March 12, had actively sought employment during the preceding 4 weeks or were waiting to be recalled from a temporary layoff, and could have started a job if they had received an offer of employment. The labor force is the sum of employed and unemployed people.

BLS publishes six “alternative measures of labor underutilization,” known as U-1 through U-6, in each month’s Employment Situation news release. The unemployment rate, also called U-3, is the total number of unemployed people as a percentage of the labor force. U-1 and U-2 are more narrowly defined and always lower than the U-3 rate. U-4, U-5, and U-6 are more broadly defined and always higher.

In March 2017, the narrower measures, U-1 and U-2, were 1.7 percent and 2.2 percent, respectively. U-1 includes only people who were unemployed for 15 weeks or longer. U-2 includes only unemployed people who lost their jobs or completed temporary jobs.

The most broadly defined rate, U-6, includes unemployed people, plus people who are “marginally attached” to the labor force, plus people who work part time for economic reasons. The marginally attached are neither working nor looking for work but want and are available for a job and have looked for work sometime in the past 12 months. People who work part time for economic reasons are those that would have preferred full-time employment, but were working part time because their hours had been cut or because they were unable to find a full-time job. The U-6 rate was 8.9 percent in March 2017. Before that, it was most recently below 9.0 percent in December 2007.

These data are from the Current Population Survey and are seasonally adjusted. To learn more, see “The Employment Situation — March 2017” (HTML) (PDF). Also see charts from the Employment Situation data.


Employment Data Disappoints

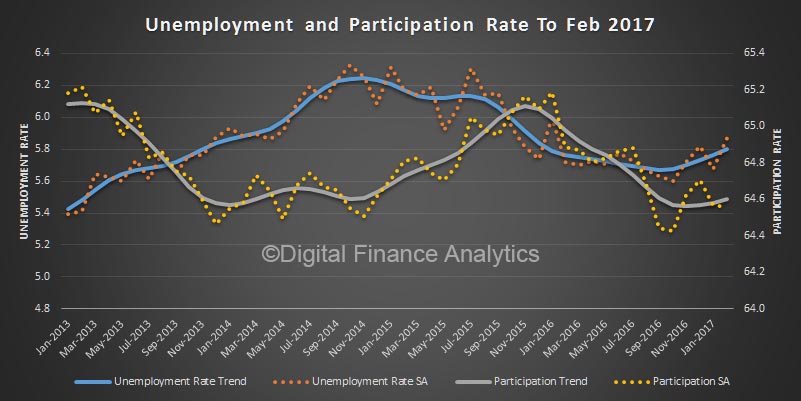
The ABS data on employment to February 2016 revealed a nasty surprise with trend unemployment restated higher, and seasonally adjusted also up. The question of course must be, given the various tweaks done by the ABS are these numbers accurate? The trend unemployment rate in Australia was 5.8 per cent. The trend participation rate was unchanged at 64.6 per cent.

Full time jobs were up a little by 27,100, but part time jobs fell 33,500; hence a net drop. Across the states, Victoria added 10,600 jobs, but Western Australia and Queensland jobs fell by 5,500 and 11,500, respectively.

New South Wales has the lowest rate at 5.2 per cent whereas Queensland had the highest rate at 6.7 per cent. Weirdly, in Western Australia the rate fell 0.4 per cent but this was to a fall in the state participation rate.

“Over the past year, we have continued to see a relatively steady trend unemployment rate between 5.7 per cent and 5.8 per cent,” said the Acting General Manager of ABS’ Macroeconomic Statistics Division, Jacqui Jones. It should be noted that January 2017 trend unemployment rate was revised up from 5.7 per cent to 5.8 per cent, as part of the standard monthly revisions.

The quarterly trend underemployment rate remained at 8.6 per cent. “The underemployment rate is still at a historically high level for Australia, but has been relatively unchanged over the past two years,” said Ms Jones.

Trend employment increased by 11,600 persons to 12,005,000 persons in February 2017, reflecting an increase in both full-time (4,600) and part-time (6,900) employment. This was the fifth straight month of increasing full-time employment, after eight consecutive decreases earlier in 2016.

Total employment growth over the year was 0.8 per cent, which was less than half the average growth rate over the past 20 years (1.8 per cent).

The trend monthly hours worked increased by 1.2 million hours (0.1 per cent), with increases in total hours worked by both full-time workers and part-time workers.

The trend participation rate was unchanged at 64.6 per cent.

Trend series smooth the more volatile seasonally adjusted estimates and provide the best measure of the underlying behaviour of the labour market.

The seasonally adjusted number of persons employed decreased by 6,400 in February 2017. The seasonally adjusted unemployment rate increased by 0.2 percentage points to 5.9 per cent, and the seasonally adjusted labour force participation rate was unchanged at 64.6 per cent.

Does Western Australia have the highest unemployment in the country?

From The Conversation Fact Check.

In the lead-up to the March 11 state election, Western Australian Labor leader Mark McGowan said the state has the highest unemployment rate in Australia. Is that correct?

Checking the source

When asked for sources to support his statement, a spokeswoman for McGowan said by email:

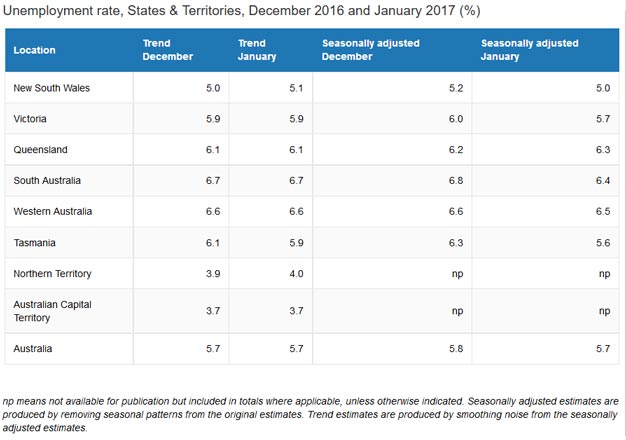
The first source is the Australian Bureau of Statistics stats for January (most recent) – below is the table on their summary page showing WA as the highest on a seasonally adjusted basis. In addition we had The West [Australian] citing the same stats here.

Let’s take a closer look at what those numbers really mean.

Who is counted in the unemployment rate?

The Australian Bureau of Statistics (ABS) considers a person to be unemployed if they were aged 15 years and over and were not employed during the labour force survey reference week, and:

  • had actively looked for full-time or part-time work at any time in the four weeks up to the end of the reference week and were available for work in the reference week; or
  • were waiting to start a new job within four weeks from the end of the reference week and could have started in the reference week if the job had been available then.

The unemployment rate is the number of unemployed persons expressed as a percentage of the labour force. This is a reasonable indicator of the overall health of the labour market and economy.

The ABS collects labour force statistics on a monthly basis, but adjustments are made to these estimates to take into account seasonality and previous trends.

Is Western Australia’s unemployment rate the highest in the country?

The most recent Australian Bureau of Statistics labour force monthly figures show that, when using the seasonally adjusted metrics, the unemployment rate is the highest for Western Australia at 6.5%. This is closely followed by South Australia at 6.4%. These figures support the claim that unemployment is the highest for Western Australia.

However, when using trend estimates, the unemployment rate is marginally higher in South Australia: 6.7% compared to 6.6%.

Trend figures are typically more reliable than seasonally adjusted figures. And – as with all labour market statistics produced by the ABS – there is a degree of statistical error in such estimates because the figures are based on survey data.

Overall, there’s very little difference between first and second place in the unemployment ranks, with only 0.1 (rounded) of a percentage point difference between the two states using either metric.

The unemployment rate for Western Australia is higher than Tasmania’s unemployment rate, as McGowan said.


The Conversation/ABS – Labour force, January 2017, CC BY-ND

Recent unemployment trends

Unemployment rates typically follow economic cycles. When the economy is doing well, unemployment is low. When the economy is flagging, unemployment will begin to rise.

Unemployment rates and other labour market indicators such as labour force participation and employment rates will also be affected by the population composition of an area and any changes in this composition.

Changes in the unemployment rate across Australia’s states and territories over the last 15-plus years demonstrate that these largely follow the economic cycle (Figure 2). Over the course of the mining boom, unemployment rates decreased, falling to a low of 2.7% in Western Australia and 4.2% nationally.

In the wake of the global financial crisis, unemployment rates begin to rise again after a short reprieve in 2009 and 2010. Since this point, unemployment rates for all states and territories have been on an upward trajectory.

Comparing 2012 with the most recent figures, the unemployment rate in Western Australia has risen most sharply across all states and territories – from the lowest rate alongside ACT in 2012 to the current highest rate alongside South Australia.

Over the same period, the unemployment rate in NSW has fallen, while in Tasmania and Victoria the rate initially climbed before returning to around the same level.

Figure 2: Unemployment rate, Jan 2000 – Jan 2017, trend estimates. ABS Labour Force Statistics, Jan 2017, Cat No.6202.0

It is less clear to what degree the state government in Western Australia has helped “create” the current labour market conditions being experienced in that state. (McGowan’s full quote was: “It is true the Liberals and Nationals have wrecked the state’s finances, and have created the highest unemployment in the country in Western Australia, higher than Tasmania, higher than South Australia…”, but checking the claim about the state’s finances is a separate and bigger question beyond the scope of this FactCheck, which has focused only on employment.)

As I explained in this previous FactCheck, a government’s influence over the labour market is constrained by what is happening in the wider global economy. Taking credit for jobs growth, or laying blame when the unemployment rate goes up, is valid only to a certain degree.

Verdict

McGowan’s statement that “the highest unemployment in the country [is] in Western Australia, higher than Tasmania, higher than South Australia” is correct when based on the most recent seasonally adjusted figures from the Australian Bureau of Statistics.

Trend estimates are typically a better data source to use and show that South Australia is marginally higher than Western Australia. However, there is very little difference.

It is less clear to what degree the current state government helped “create” this situation. Western Australia’s unemployment rate has been increasing since the global financial crisis. A similar pattern is seen across most Australian states and territories.

Since 2012, WA’s unemployment rate has risen at a faster pace than other states and territories, from the lowest in 2012 alongside ACT to the highest now alongside South Australia.

Changes in the population composition of the state along with the economic cycle are likely to be driving these trends. – Rebecca Cassells


Review

This is a sound FactCheck. It notes that the Australian Bureau of Statistics provides more than one measure of the unemployment rate. While Western Australia has the highest state unemployment rate in January 2017 on a seasonally adjusted basis, South Australia has a higher trend estimate. It is less clear, however, that the trend estimate is considered more reliable than the seasonally adjusted estimate, particularly for the most recent month of reported figures.

I agree with the caveat that it is less clear that the current state government helped “create” this situation. The potential for state governments to influence the overall state of the economy in the short term is very much constrained.

I would stress even more that the unemployment measures provided each month by the ABS are only estimates, based on surveyed samples of individuals, not the whole population. State unemployment rates in particular are quite volatile month to month, with changes up and down of 0.3-0.4 percentage points quite common. Differences in unemployment rates between states of 0.1 percentage points in any specific month are not particularly informative. – Michael Coelli

U.S., European Economies and the Great Recession

From The St. Louis Fed Blog.

As the U.S. economy has gotten stronger, labor markets across the country have improved substantially, albeit slowly, from the shocks they suffered during the Great Recession. Here, we highlight the unemployment rate dynamics in the U.S. and across Europe during and after the Great Recession and global financial crisis.

As the figure below shows, the U.S. unemployment rate increased rapidly in 2008 and 2009.

Unemployment Rates

The U.S. unemployment rate rose from 5 percent in January 2008 to its peak of 10 percent in October 2009, with the year-over-year changes being at least 3 percentage points for 10 consecutive months. Since then, however, the unemployment rate has declined at a mostly consistent average year-over-year pace of 0.6 percentage points, reaching 4.7 percent in December 2016.

The experiences of the United Kingdom and Germany were somewhat similar, with a quick uptick and a prolonged decline in the unemployment rate. It is important to note that Germany’s unemployment rate had already been declining from a prior peak in the early 2000s, and the U.K.’s hovered around 8 percent for about four years before it started declining.

But the experience for countries in Europe’s periphery, like Spain and Italy, was quite different. Spain and Italy both had a second prolonged rise in the unemployment rate well after the financial crisis, as their economies struggled to recover. This is highlighted in the figure below, where the real GDP growth in both of these countries quickly slowed and dipped back into negative territory for a second time in 2011, and this time for a much longer period.

Real GDP Growth

The final figure below shows how Italy’s economy has struggled to grow back to its pre-recession level, explaining why its unemployment rate has remained elevated for several years.

real gdp indexed

On the other hand, Spain’s economy has just recently reached its pre-recession level, and it has grown at an average pace of 3.2 percent over the past two years. Spain’s recent growth has had a positive impact on its unemployment rate, which declined at an average year-over-year pace of 2.4 percentage points in 2015 and 2016.

Finally, the U.S., the U.K. and the German economies have grown and surpassed their pre-recession levels, pointing to why their unemployment rates have declined considerably

The Chill Wind of Underemployment

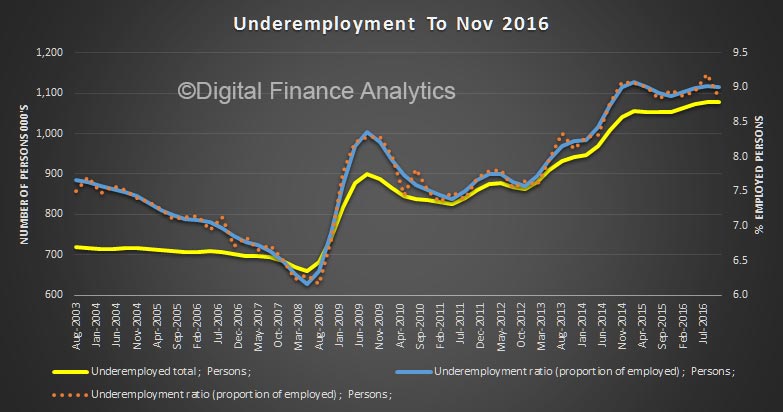
Whilst the headline ABS data on unemployment may have read ok, there is a critical issue which is having a draining effect on productivity, growth, household incomes and confidence. This is the spectre of underemployment.

The trend data tells the story. There are more than one million people who, though they have some work, want more. This equates to around nine percent of the working population. Some may have just a few hours work each week, yet are counted as employed.

This has a drag effect on wage growth (which is for many at zero currently) and this flows into lower household incomes, despite rising debt and other household costs.

The mirror image is those in full time work but who are working for longer, and out of core hours thanks to the digital transformation in hand. For many of these people, work-life balance is also shot!

Full-time employment increased for fourth straight month

Monthly trend full-time employment increased by 6,500 in Australia in January 2017, according to figures released by the Australian Bureau of Statistics (ABS) today. This was the fourth consecutive month of increasing full-time employment, after eight consecutive decreases earlier in 2016.

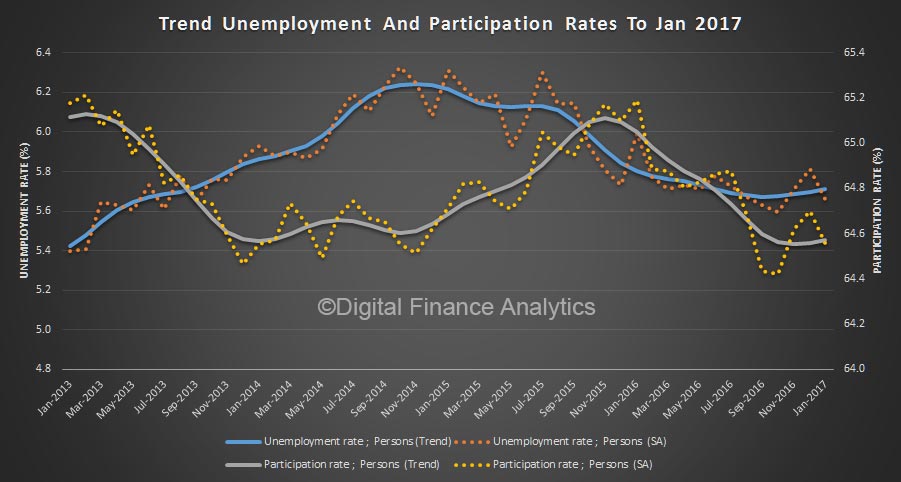
The trend unemployment rate was 5.7 per cent for the ninth consecutive month. The trend participation rate was unchanged at 64.6 per cent.


Total trend employment increased by 11,700 persons to 11,984,300 persons in January 2017, reflecting an increase in both full-time (6,500) and part-time (5,100) employment. Total employment growth over the year was 0.8 per cent, which was less than half the average growth rate over the past 20 years (1.8%).

“We are still seeing strong growth in part-time employment in January 2017, and in recent months, increasing growth in full-time employment. There are now around 129,800 more people working part-time than there were a year ago, and around 40,100 fewer people working full-time,” said the General Manager of ABS’ Macroeconomic Statistics Division, Bruce Hockman.

The trend monthly hours worked increased by 3.6 million hours (0.2 per cent), with increases in total hours worked by both full-time workers and part-time workers.

Trend series smooth the more volatile seasonally adjusted estimates and provide the best measure of the underlying behaviour of the labour market.

The seasonally adjusted number of persons employed increased by 13,500 in January 2017. The seasonally adjusted unemployment rate decreased by 0.1 percentage points to 5.7 per cent, and the seasonally adjusted labour force participation rate decreased by 0.1 percentage points to 64.6 per cent.

December Trend Employment Data Steady

Monthly trend full-time employment increased by 7,000 in Australia in December 2016, according to figures released by the Australian Bureau of Statistics (ABS) today. Whilst employment growth remains sluggish, this was the third consecutive month of increasing full-time employment.

But the rotation to part-time work continues, the seasonally adjusted unemployment rate rose to 5.8% and the seasonally adjusted participation rate rose to 64.7%.

Total trend employment increased by 8,200 persons to 11,966,800 persons in December 2016, reflecting an increase in both full-time (7,000) and part-time (1,100) employment. However, year-on-year employment growth was 0.7 per cent, which was less than half the average growth, of 1.8 per cent, from the past 20 years.

“Over the past year we have seen a shift towards part-time employment, particularly in the first half of 2016. There are now around 120,900 more people working part-time than there were a year ago, and around 35,300 fewer people working full-time. Since December 2015, the share of part-time employment increased from 31.1 per cent to 31.9 per cent,” said the General Manager of the ABS’ Macroeconomic Statistics Division, Bruce Hockman.

The trend unemployment rate was 5.7 per cent for the ninth consecutive month.

The trend participation rate was unchanged at 64.6 per cent.

The trend monthly hours worked increased by 2.3 million hours (0.1 per cent), with increases in total hours worked by both full-time workers and part-time workers.

Trend series smooth the more volatile seasonally adjusted estimates and provide the best measure of the underlying behaviour of the labour market.

The seasonally adjusted number of persons employed increased by 13,500 in December 2016. The seasonally adjusted unemployment rate increased by 0.1 percentage points to 5.8 per cent, and the seasonally adjusted labour force participation rate increased by 0.1 percentage points to 64.7 per cent.