Finance drives everything — including your insecurity at work

From The Conversation.

There’s a common link between the many things that have promoted insecurity at work: the growth of franchising; labour hire; contracting out; spin-off firms; outsourcing; global supply chains; the gig economy; and so on. It’s money.

At first, that seems too obvious to say. But I’m talking about the way financial concerns have taken control of seemingly every aspect of organisational decision-making.

And behind that lies the rise and rise of finance capital.

Over the past three decades there has been a shift in resources from the rest of the economy to finance. Specifically, to finance capital.

One way to see this is in the chart below. It shows the income shares of labour and capital, and the breakdown for each between the finance and non-finance (“industrial”) sectors, in two four-year periods. They were 1990-91 to 1993-94 (when the ABS started publishing income by industry) and, most recently, 2013-14 to 2016-17. (I use four-year periods to reduce annual fluctuations and show the longer-term trends. Here is more detail and explanation of methods.)

Income shares of labour and capital

Factor shares by industry, 1990-94 and 2013-17. Source: ABS Cat No 5206.0

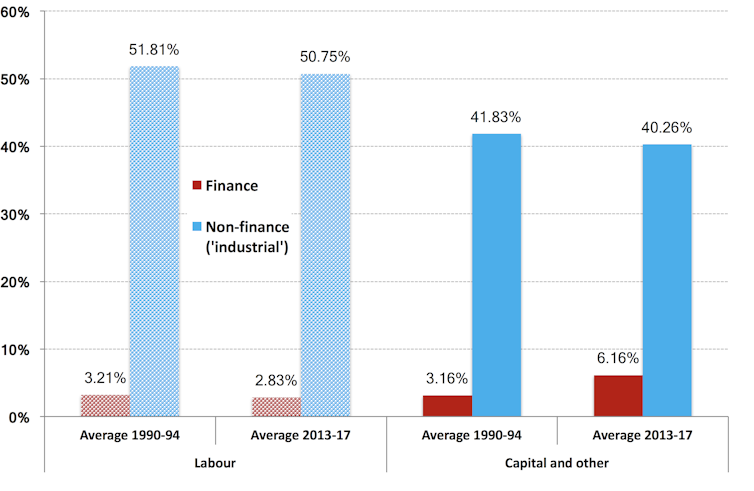
The key thing to notice in the chart is that finance capital’s share of national income doubled (it’s the dark red boxes in the lower right-hand side of the chart), while everyone else’s went down.

So, over that quarter-century, the share of labour income (wages, salaries and supplements) in national income fell. In the early 1990s it totalled 55.02% — that’s what you get when you add labour income in finance, 3.21%, to labour income in “industrial” sectors, 51.81%. In recent years this fell to 53.58%. There were falls in both finance labour income (from 3.81 to 2.83% of national income) and industrial labour income.

The total share of profits and “mixed income” accordingly rose from 44.99% to 46.42%. The thing is, all of that increase (and a bit more) went to finance capital. Profits in finance went from 3.16% to 6.16% of the economy.

At the same time there has been a large increase in the share of national income going to the very wealthy — the top 0.1% — in Australia and many other countries.

This shift in resources does not reflect more people being needed to do important finance jobs. Nor is it higher rewards for workers in finance. The portion of national income, and for that matter employment, devoted to labour in the financial sector actually fell from 3.21% to 2.83%.

The economy devotes proportionately no more labour time now to financial services than it did a quarter century ago. Yet rewards to finance have increased immensely. The share of national income going to “industrial” sector profits and “mixed income” has declined.

In short, the widely recognised shift in income from labour to capital is really a net shift in income from labour, and from capital (including unincorporated enterprises) in other industries, to finance capital.

Finance matters

You may have heard about “financialisation”. It’s not really about more financial activity. It is about the growth of finance capital and its impact on the behaviour of other actors.

Financialisation has led to finance capital taking the lead shareholdings in most large corporations, not just in Australia but in other major countries (to varying degrees) as well.

This role as main shareholder and, of course, chief lender to industrial capital has driven the corporate restructuring over the past three decades that has led to greater worker insecurity and low wages growth (as I recently discussed here).

When “industrial capital” has been restructured over recent decades — to promote franchising, labour hire, contracting out, spin-off firms, outsourcing, global supply chains, and even the emergence of the gig economy — it has been driven by the demands of finance capital. Casualisation is just one manifestation of this.

Short-term logic

Now there’s no conspiracy here (or, at least, the system doesn’t rely on one). There is actually a lot of competitive mindset in the financial sector. This is just the logic of how the system increasingly has come to work. Financial returns, particularly over the short term, have become the principal (really, the only) fact driving corporate behaviour.

This has come at the expense of human considerations.

That same logic is behind resistance to action on climate change. Continuing carbon emissions are the perfect, and deadly, example of short-term profits overriding longer-term interests.

Yet even finance capital is not monolithic. There are parts of finance capital that have a longer-term perspective (“there’s no business on a dead planet”). So they are effectively in battle with those parts of finance capital for which the short term is everything. The former want governments to intervene in, for example, carbon pricing.

Policy questions

All this leaves some big questions for policymakers about how to redress the new imbalance of power.

In part, it requires changing institutional arrangements (including industrial relations laws) that in recent years have made it much harder for workers to obtain a fair share of increases in national income. It requires rethinking of how we regulate work.

But it also requires rethinking of how we regulate product markets and financial markets.

The almost global reduction in regulation of the financial sector over three decades ago has ultimately led to this imbalance. It is time to rethink all of that.

Author: David Peetz Professor of Employment Relations, Centre for Work, Organisation and Wellbeing, Griffith University

Who Really Benefits From High Home Prices? – UPDATED

Most would accept that house prices in the major Australian centres are too high. Whether you use a measure of price to income, loan value to income, or price to GDP; they are all above long term trends and higher than in most other countries.

Indeed, in Sydney and Melbourne, they are arguably more than 30% higher than they should be. Today we update our thoughts on this critical topic, and identify the winners and losers.

And by the way, if you value the content we produce please do consider joining our Patreon programme, where you can support our ability to continue to make great content.

Ultra-low interest rates currently make large loans affordable for many households, yet overall household debt is as high as it has ever been and mortgage stress, even at these low interest rates is also running hot. Banking regulators are concerned about systemic risks from overgenerous underwriting criteria and they have been lifting capital ratios to try to improve financial stability, with a focus on the fast growing investment sector and underscoring the need for lenders to consider loan servicability. The Royal Commission also uncovered poor lending practice, and the potential for some households to be sitting on unsuitable loans. In many countries around the world, house prices are also high, so from New Zealand to UK, regulators are taking steps to try limit systemic risks. These rises are partly being driven by global movements of capital, ultra-low interest rates and quantitative easing, plus the finance sectors ability to “magic” loans from thin air if there are borrowers willing to borrow. And now interest rates in the USA and Europe are on their way up, creating more pressure on households just as prices are beginning to wain.

Locally of course home prices are now sliding in many centres, and we expect more in the months ahead. However, let’s think about who benefits from high and rising prices. First anyone who currently holds property (and that is two-thirds of all households in Australia) will like the on-paper capital gains. This flows through to becoming an important element in building future wealth. In addition, refinancing is up currently, and we see some households crystalising some of their on-paper gains for holidays, a new car or other purposes, helping to stimulating retail activity. An RBA research paper, suggests that low-income households have a higher propensity to purchase a new vehicle following a rise in housing wealth than high-income households. We also see significant intergenerational wealth transfer as Mums and Dads draw out equity to help their kids buy into the overinflated market.  Indeed, we think the Bank of Mum and Dad is now a top 10 lender in Australia, as we discussed recently.

Those holding investment property also enjoy tax-concessions on interest and other costs; and on capital appreciation. Rising wealth generally supports the feel-good factor, and consumer confidence – though currently this is a bit wonky as prices fall, rental streams tighten and interest rates rise. Higher values stimulate more transactions, which creates more momentum. The reverse is also true.

Now, the one-third of households who are not property active, consist of those renting and those living with family, friends or in other arrangements. Their confidence levels are lower and they are not gaining from rising house prices. A relatively small proportion of these are actively seeking to buy, and they are finding the gradient becoming ever more challenging, as saving for a deposit is becoming harder, lending criteria are tightening and income growth is slowing. We have noted previously that a rising number of first time buyers have switched directly to the investment sector to get into the market. Generally younger households are yet to get on the housing escalator, whilst older generations have clearly benefited from sustained house price growth, even if more are now taking mortgages into retirement. This has the potential to become a significant inter-generational issue.

But overall, the wealth effect of rising property is an umbrella which spreads widely. The sheer weight of numbers indicates that there are more winners than losers. No surprise then that many politicians will seek to bathe in the reflected glory of rising values, whilst paying lip-service to housing affordability issues. They will also start to panic if prices fall too far too fast.

There are other winners too. For states where property stamp-duty exists, the larger the transaction value and volume, the higher the income. For example, NSW, in 2016-17 added $9.7 billion to coffers thanks to stamp duties revenue which is 31.6% of the total of $30.7 billion. But now transfer duty revenue over the three years to 2020-21 has been revised down by $5.5 billion according to the state budget papers. Optimistically, they are forecasting a significant rise in property values down the track. The higher the price the larger the income. The tax-take funds locally provided services so ultimately residents benefit. But clearly they have an interest in keeping prices high.

The banks also benefit because rising house prices gives them the capacity to lend larger loans at lower risk (and which in turn allows house prices to run higher again). They have benefited from relatively benign capital requirements and funding, thus growing their balance sheet and shareholder returns. Whilst recent returns have been pretty impressive, future returns may be lower thanks to changes in capital ratios and especially if housing lending continues to moderates. On the other hand, their appetite to lend to productive business and commercial sectors is tempered by higher risks and more demanding capital requirements. The relative priority of debt to housing as opposed to productive lending to business is an important issue and whilst higher house prices can flow through to economic growth in the GDP numbers, it is mostly illusory.  The truth is, lending needs to be redirected to productive purposes, not just to inflate home prices.

Finally, building companies can benefit from land banks they hold, and development projects, despite high local authority charges. We also note that some banks are now winding back their willingness to lend to the construction industry (because of potentially rising risks), and some banks have blacklists of postcodes where they will not lend, especially for newly constructed high-rise block. The real estate sector of course benefits, thanks to high transaction volumes and larger commissions. Mortgage brokers also enjoy volume and transaction related income. Even retailers with a focus on home furnishings and fittings are buoyant. But all of these sectors are under pressure as momentum ebbs.

So standing back, almost everyone appears to benefit from higher prices. That is, apart from the one third, and rising, of households renting (who tend to have lower incomes, and reside in lower socio-economic groups). But is it really a free-kick for the rest? Well, for as long as the music continues to play, it almost is. The question now is, what happens as prices continue to fall (remember that during the GFC, northern hemisphere prices fell in some places up to 40%, and several banks collapsed, though since then prices in the US, Ireland and the UK have started to recover). Given our exposure to housing, there will be profound impacts on households, banks and the broader economy if values fall significantly. Yet that looks like where we are headed.

Underlying all this, we have moved away from seeing housing as something which provides shelter and somewhere to live; to seeing it as just another investment asset class. This is probably an irreversible process, and part of the “financialisation” of society, given the perceived benefits to the economy and households, but we question whether the consequences are fully understood.

A Global Perspective On Home Ownership

From The St. Louis Fed On The Economy Blog

An excellent FED post which discusses the decoupling of home ownership from home price rises. We think the answer is simple: the financialisation of property and the availability of credit at low rates explains the phenomenon.

In the aftermath of WWII, several developed economies (such as the U.K. and the U.S.) had large housing booms fueled by significant increases in the homeownership rate. The length and the magnitude of the ownership boom varied by country, but many of these countries went from a nation of renters to a nation of owners by around the late 1970s to mid-1980s.

Historically, the cost of buying a house, relative to renting, has been positively correlated with the percent of households that own their home. From 1996 to 2006, both the price of houses and the homeownership rate increased in the U.S. This increasing trend ended abruptly with the global financial crisis that drove house prices and homeownership rates to historically low levels.

It is reasonable to expect prices and homeownership to move in the same direction. A decrease in the number of people who want to buy homes to live in could lead to a decrease in both prices and homeownership. Similarly, an increase in the number of people buying homes to live in could lead to an increase in both prices and homeownership.

However, recent evidence indicates that the cost of buying a home has increased relative to renting in several of the world’s largest economies, but the share of people owning homes has decreased. This pattern is occurring even in countries with diverging interest rate policies. It is important to delve into this fact and try to find potential explanations. (For trends in homeownership rates and price-to-rent ratios for several developed economies, see the figures at the end of this post.)

Increasing Cost of Housing

The price-to-rent ratio measures the cost of buying a home relative to the cost of renting. Factors like credit conditions or demand for homes as an investment asset affect the price of houses but not the price of rentals. These and other factors cause the price-to-rent ratio to move.

Over the period 1996-2006, the cost of buying a home grew more quickly than the cost of renting in many large economies. For example, the price-to-rent ratio in the U.S. increased by more than 30 percent between 2000 and 2006. Even larger increases occurred in the U.K. and France, where the price-to-rent ratio rose by nearly 80 percent over the same period.

The price-to-rent ratio declined in the wake of the housing crisis in the U.S., the eurozone, Spain and the U.K., but in the past few years, it has started to increase again. The price of houses is again increasing more quickly than the price of rentals.

Decreasing Homeownership

However, the homeownership rate has not increased along with the price-to-rent ratio. The homeownership rate (the percent of households that are owner-occupied) has fallen in several large economies:

  • In the U.S., the homeownership rate fell from around 69 percent before the recession to less than 64 percent in 2016.
  • In the U.K., the rate fell from nearly 69 percent to around 63 percent.
  • The homeownership rates in Germany and Italy have also fallen.

Diverging Policies

The pattern of increasing house prices and decreasing homeownership has occurred even in countries with diverging monetary policies:

  • By 2016, the Federal Reserve had ended quantitative easing and had begun raising rates in the U.S.
  • In contrast, the Bank of England and the European Central Bank continued quantitative easing throughout 2016 and reduced rates.

Nonetheless, the homeownership rate continued to fall in the U.S., the U.K. and many parts of Europe, while the price-to-rent ratio continued to increase.

Housing Supply

Several factors could be driving the decoupling of the price-to-rent ratio and the homeownership rate. From the housing supply side, there is a trend toward decreased construction of starter and midsize housing units.

Developers have increased the construction of large single-family homes at the expense of the other segments in the market. From 2010 to 2016, the fraction of new homes with four or more bedrooms increased from 38 percent to 51 percent.

This limited supply, particularly for starter homes, could result in increased prices for those homes and fewer new homeowners. One possible factor is regulatory change. The National Association of Home Builders claims that, on average, regulations account for 24.3 percent of the final price of a new single-family home. Recent increases in regulatory costs could have encouraged builders to focus on larger homes with higher margins. Supply may be just reacting to developments in demand that we discuss next.

Housing Demand

From the demand side, there are three leading explanations, which are likely complementary and self-reinforcing:

  • Changes in preferences toward homeownership
  • Changes in access to mortgage credit
  • Changes in the investment nature of real estate

Preferences for homeownership may have changed because households who lost their homes in foreclosure post-2006 may be reluctant to buy again. Also, younger generations may be less likely to own cars or houses and prefer to rent them.

Demand for ownership has also decreased because credit conditions are tighter in the post-Dodd Frank period.

Real Estate Investment

The previous demand arguments can explain why the price-to-rent ratio dropped post-2006. As rents grew relative to home prices, together with the low returns of safe assets, rental properties became a more attractive investment. This attracted real estate investors who bid up prices while depressing the homeownership rate.

Moreover, builders increased their supply of apartments and other multifamily developments. From 2006 to 2016, single-family construction projects declined from 81 percent to 67 percent of all housing starts.

There are several types of real estate investors:

  • “Mom and dad” investors looking for investment income
  • Foreign investors who have increased real estate prices in many of the major cities of the world
  • Institutional landlords like Invitation Homes or American Homes 4 Rent

In fact, since 2016 the real estate industry group has been elevated to the sector level, effective in the S&P U.S. Indices.

In addition, the widespread use of internet rental portals such as Airbnb and VRBO has increased the opportunity to offer short-term leases, increasing the revenue stream from rental housing.

There are several potential explanations, but more research is needed to determine the cause of the decoupling of house prices from homeownership rates and what it means for the economy.

Rent vs Owning in U.S.

Rent vs Owning in Eurozone

Rent vs Owning in Canada

Rent vs Owning in Spain

Rent vs Owning in Germany

Rent vs Owning in UK

Authors: Carlos Garriga, Vice President and Economist; Pedro Gete, IE Business School; and Daniel Eubanks, Senior Research Associate

Australia’s housing market and the great intergenerational tax rort

Interesting perspective from The Guardian. However, it seems to miss the root cause of the housing affordable issue, namely the financialistion of property, now seen as a financial asset, rather than somewhere to live.  This has created demand from investors, lifted the volume of loans which can be written, and created a leveraged edifice which may topple should prices fall. This phenomenon explains the behaviour of many western housing markets, which have been stoked by ultra low interest rates and QE. But the Guardian piece is still worth reading…

Owning your own home was once the great Australian dream but it has turned into a nightmare for young aspiring homeowners.

Based on the evidence, government housing policy appears to be as follows: keep prices high at all costs, enslaving new buyers with obscene levels of debt for the benefit of banks and existing landowners. In a nutshell, this is called intergenerational taxation.

This is a social form of taxation in which there is a significant transfer of wealth from one generation of society to another. In Australia’s economic model, as house prices continue to soar, young homebuyers are forced to take on huge debts to acquire a home that turns to capital for the older seller of the home.

Our banks and mortgage companies are writing the largest home loans in the world both relative to what a young homebuyer earns and in sum value. Putting all financial stability risks and issues aside, the more a bank lends to a new homebuyer the greater the profit a seller and lender will make. When irrational exuberance is rife, lenders increase the sum of debt they issue to young homebuyers and property investors alike. This essentially increases the rate of intergenerational taxation. And the greater the young are effectively taxed in this way, the richer older generations become.

However, when house prices fall hard, like they have already in some parts of Australia, the intergenerational taxation rate falls hard too – even to the point where the flow reverses and younger people can benefit.

Take the Western Australian mining town of Karratha where a median-priced house back in 2011 would have cost about $850,000, or roughly seven times the median income of a household. Today the same house costs less than $300,000, which is roughly two-and-a-half times the median household income.

So, back in 2011, the ballpark intergenerational tax rate from the young to the old in Karratha was a one-off payment roughly the equivalent of 400%-450% of the younger person’s annual income. Today, however, Karratha homeowners are now likely paying a one-off intergenerational tax rate of 15%-25% to younger Australians.

Karratha saw a remarkable transfer of wealth from young to old but now the reverse means an older cohort of Australians are left with a liability they may never repay in full. It serves as a warning for people who have bought into the Sydney and Melbourne housing markets in recent years and who are vulnerable to a fall in prices.

To head off some of these problems, the government now wants to allow younger Australians to tap their super for deposits on homes, thereby increasing their tax transfer to the older generation.

Behind the scenes is our banking system and our financial regulators. The Reserve Bank has been the primary facilitator of the intergenerational transfer by bringing interest rates down to a record low and promising a safety net for banks.

So the question a young homebuyer must ask themselves is why have the government, mortgage lenders, landowners and the RBA built a wealth transfer system that leaves the aspiring young homebuyer as the most leveraged in the world?

The answer to this question is very simple. The reality is a very small number of powerful lobby groups in Canberra have a hundred times more influence on shaping housing policy than young people. In other words, the voice of our youth is unfortunately all but irrelevant and ignored.

Should Banks Be Able To Create Money?

Banks today have the power to extend their reach by multiplying the value of loans against deposits and shareholder capital held. Indeed, all the recent regulatory work has been to try and lift the capital ratios, to protect the financial system and to try to ensure in event of failure, tax payers are be protected. We have highlighted how highly leveraged the main Australian Banks are. And this morning we discussed the risks associated with a credit boom.

Last year the Bank of England suggested that banks have the capacity to create UNLIMITED amounts of credit, in fact creating money, unrelated to deposits.

In this light, a working paper from the IMF in 2012 (note this is a research document, not the views of the IMF), “The Chicago Plan Revisited“, is worth reading.

The decade following the onset of the Great Depression was a time of great intellectual ferment in economics, as the leading thinkers of the time tried to understand the apparent failures of the existing economic system. This intellectual struggle extended to many domains, but arguably the most important was the field of monetary economics, given the key roles of private bank behavior and of central bank policies in triggering and prolonging the crisis.

During this time a large number of leading U.S. macroeconomists supported a fundamental proposal for monetary reform that later became known as the Chicago Plan, after its strongest proponent, professor Henry Simons of the University of Chicago. It was also supported, and brilliantly summarized, by Irving Fisher of Yale University, in Fisher (1936). The key feature of this plan was that it called for the separation of the monetary and credit functions of the banking system, first by requiring 100% backing of deposits by government-issued money, and second by ensuring that the financing of new bank credit can only take place through earnings that have been retained in the form of government-issued money, or through the borrowing of existing government-issued money from non-banks, but not through the creation of new deposits, ex nihilo, by banks.

Fisher (1936) claimed four major advantages for this plan. First, preventing banks from creating their own funds during credit booms, and then destroying these funds during subsequent contractions, would allow for a much better control of credit cycles, which were perceived to be the major source of business cycle fluctuations. Second, 100% reserve backing would completely eliminate bank runs. Third, allowing the government to issue money directly at zero interest, rather than borrowing that same money from banks at interest, would lead to a reduction in the interest burden on government finances and to a dramatic reduction of (net) government debt, given that irredeemable government-issued money represents equity in the commonwealth rather than debt. Fourth, given that money creation would no longer require the simultaneous creation of mostly private debts on bank balance sheets, the economy could see a dramatic reduction not only of government debt but also of private debt levels.

We take it as self-evident that if these claims can be verified, the Chicago Plan would indeed represent a highly desirable policy. Profound thinkers like Fisher, and many of his most illustrious peers, based their insights on historical experience and common sense, and were hardly deterred by the fact that they might not have had complete economic models that could formally derive the welfare gains of avoiding credit-driven boom-bust cycles, bank runs, and high debt levels. We do in fact believe that this made them better, not worse, thinkers about issues of the greatest importance for the common good. But we can say more than this. The recent empirical evidence of Reinhart and Rogoff (2009) documents the high costs of boom-bust credit cycles and bank runs throughout history. And the recent empirical evidence of Schularick and Taylor (2012) is supportive of Fisher’s view that high debt levels are a very important predictor of major crises. The latter finding is also consistent with the theoretical work of Kumhof and Rancière (2010), who show how very high debt levels, such as those observed just prior to the Great Depression and the Great Recession, can lead to a higher probability of financial and real crises.

But this is more than a theoretical discussion, because Switzerland will hold a referendum to decide whether to ban commercial banks from creating money, after more than 110,000 people signed a petition calling for the central bank to be given sole power to create money in the financial system. Its been led by the Swiss Sovereign Money movement – known as the Vollgeld initiative – and is designed to limit financial speculation by requiring private banks to hold 100% reserves against their deposits.

“Banks won’t be able to create money for themselves any more, they’ll only be able to lend money that they have from savers or other banks,” said the campaign group.

If successful, the sovereign money bill would give the Swiss National Bank a monopoly on physical and electronic money creation, “while the decision concerning how new money is introduced into the economy would reside with the government,” says Vollgeld.

In the aftermath of the 2008 financial crisis, Iceland commissioned a report “Monetary Reform – A better monetary system for Iceland” which was  published in 2015, and suggests that money creation is too important to be left to bankers alone.

Consider the impact if banks had to back loans with deposits. Credit would be expensive, and hard to get. Depositors would be better rewarded, and eventually households would deleverage, whilst property prices normalised.  It might just reverse the “financialisation” of society. If it happened, banks would be very different beasts.

Financialisation is a term sometimes used in discussions of the financial capitalism that has developed over the decades between 1980 and 2010, in which financial leverage tended to override capital (equity), and financial markets tended to dominate over the traditional industrial economy and agricultural economics.