Sydney Home Prices Take A Dive

The Residential Property Price Index (RPPI) for Sydney fell 1.6 per cent in the December quarter 2015 following positive quarterly growth over the last three years, according to figures released today by the Australian Bureau of Statistics (ABS).  Sydney established house prices fell 2.1 per cent and attached dwellings prices fell 0.8 per cent in the December quarter 2015. Annually, Sydney residential property prices rose 13.9 per cent.

Dec-2015-Price-Movements
In other capital cities in the December quarter 2015, the RPPI rose in Melbourne (+1.6 per cent), Brisbane (+1.6 per cent), Adelaide (+0.9 per cent), Canberra (+2.8 per cent), Perth (+0.5 per cent) and Hobart (+2.5 per cent) and fell in Darwin (-1.8 per cent ).

For the weighted average of the eight capital cities, the RPPI rose 0.2 per cent in the December quarter 2015 and rose 8.7 per cent over the previous year.

The total value of Australia’s 9.6 million residential dwellings increased $31.6 billion to $5.9 trillion. The mean price of dwellings in Australia is now $612,100.

Report calls for review of tax exemptions on family home

From Australian Broker.

The capital gains tax (CGT) will be cast into the spotlight with a new proposal to tax profits on the sale of houses over $2 million to be released by the Australia Institute.

According to The Australian Financial Review (AFR) the report by the Australia Institute, to be released today, will show that low-income households receive almost no benefit from the capital gains tax exemption, which was estimated at $46 billion in 2015-16 and is forecast to be worth $189 billion by 2020.

As such, the report argues for the removal of the exemption for homes worth $2 million or more. Modelling in the report shows removing the capital gains tax exemption for these homes would boost the budget by $12 billion over four years.

According to the AFR, Australia Institute executive director Ben Oquist said the 50% capital gains tax discount should also be looked at.

“While super tax concessions are often talked about, it’s clear capital gains tax needs reform,” he said.

“The discount and exemption are costing the budget tens of billions of dollars and while many other areas of tax reform would require compensation for the less well off, such as raising the GST, limiting or reducing the discount or exemption would affect only the very wealthy, be good for the economy and potentially be a multi-billion-dollar budget boost.”

The report claims the capital gains tax exemption on the main residence costs the federal budget more than defence, education or Medicare. It is also a big factor in housing affordability in Australia.

“Reducing the concession is likely to have a positive impact by reducing distortions in the economy,” the report says, according to the AFR.

“At present the exemption encourages over capitalisation in main residences since any increase in their value is tax free. This has the effect of pushing up the value of housing and therefore making that housing less affordable.”

Last year fewer than 1% of owner-occupied house sales were for $2 million or more, the AFR reported.

Sydney’s Capital Growth Boom is Over

From Mortgage Professional Australia. New report shows Sydney’s capital growth boom is over, economist says

A prominent economist believes a report released today confirms that Sydney’s house price boom has come to an end.

According to the latest Domain House Price Growth report, Sydney’s median house price grew by only 3.2% over the September quarter, the slowest rate of quarterly growth since March 2014.

According to the report the median price for a house in Sydney is $1,032,433, while the median unit price is now $673,182 after it grew at just 1.5% over the quarter – well down on the 7.4% growth seen during the June quarter.

“It’s still a good result for owners in Sydney, but I think it’s clear now that the boom in price growth we’ve been seeing is receding,” Domain Group senior economist Dr Andrew Wilson said.

“House price growth over the September quarter was well below what we saw in June, it’s actually less than half than the June quarter growth and it looks like growth will be lower again over the December quarter,” Dr Wilson said.

Dr Wilson said there have been a number of signs recently that have been pointing to slowdown in price growth.

“We’ve seen a sharp decline in auction clearance rates recently which is a pretty good forward indicator and also we’re starting to see interest rate increases that will offset any decreases by the RBA,” Dr Wilson said.

“Look, prices will continue to grow and it’s quite rational to say they will be higher this time next year, but it’s not going to be at the same level we’ve seen in recent years as a lot of the energy that came from the February and May rate cuts has now washed through the market and people simply don’t have the capacity to keep buying.”

In Melbourne, a similar slowing of capital growth rates appears to be occurring.

The Melbourne median house price increased by 2.8% over the September quarter, pushing the median house price above $700,000 for the first time, but that level of growth is well below the 6% recorded over then June quarter.

While investors can no longer expect the same strong levels of capital growth they have been experiencing in Sydney and Melbourne, Dr Wilson said there was also some worry for Brisbane, which has been touted by many as the next investment hotspot.

“Brisbane has been disappointing, it was predicted to grow just behind Melbourne but that’s just not happening.

“It’s doing nothing like it was predicted, growth looks like it could be below last year’s level and it’s just really going sideways with no direction or momentum.”

Does Trading Down Trump Trading Up?

As we continue to look over the results of the latest household surveys, as captured in the recently released Property Imperative report to September 2015, we look at households who are wanted to trade up and trade down. These are important segments of the market because they have reason to transact, and access to funding if they decide to trade. In fact they tend to underpin the market, and the balance between the two tell us something about demand and supply, and also which sectors are more likely to be on the up.

So looking first at those seeking to trade up, our survey identified about 1,077,000 households who are considering buying a larger property. Most (91%) are owner occupied. Of these households 12% are expecting to transact within the next 12 months, whilst 64% of households expect house prices to rise in this period.

DFA-Sept-UpTraders
The main reasons for these households to transact are as a property investment (40%), to obtain more space (33%), because of a job move (12%) and for a life-style change (12%). Many of these households will require further finance (72%) and a quarter will consider using a mortgage broker (22%), whilst 33% of these households are actively saving to facilitate a transaction. We note that prospective future capital gains rated most strongly, the view of property as an investment continues to drive behaviour. We also note that the majority of up-traders are seeking houses rather than apartments. Given the focus on owner occupied finance now, lenders and brokers would do well to consider their strategies to assist this market segment.

Turning to down-traders, more than 1.25 million households are considering selling and buying a smaller property. These households tend to be older, and with higher net worth. Of these 71% are considering an owner occupied property, and 29% an investment property. Of these 670,000 currently have no mortgage and own the property outright. Many will not need bank finance to transact. Some however may seek investment finance.

DFA-Sept-Down-Traders

Around 24% of these households expect house prices to rise over the next year, whilst 51% expect to transact within 12 months, 9% will consider using a mortgage broker and 9% will need to borrow more. Households will transact to facilitate increased convenience (30%), to release capital for retirement (28%), because of unemployment (7%) or because of illness or death of a spouse (9%).  Down traders tend to be seeking smaller more convenient property, are more likely to go for an apartment with good access to central facilities, such as shops and healthcare, and some may, as part of a wealth management strategy be seeking to release capital (as they have seen significant upside in recent times) and opt for an investment property (sometime with negative gearing).

But, if we put these two segments together, there are about 765,000 households looking to trade in the next year. Of these, nearly 80% are down traders. We think this will have an impact on the supply and demand footprint in the market, with smaller property being supported by the high number of down traders, and poor supply, whilst those with larger places, and wanting to sell may find a lack of buyers and a saturated market, so price differentials will moderate, with continue growth in the middle market, but more sluggish growth, or even a fall at the top end. This could well also distort prices in specific geographic areas.  In other words, down traders may have to give a little on the price they get to sell their current place, and pay more for their next property, because of the higher level of demand. Up-traders will find good supply of property if they choose to transact, and will be able to negotiate hard on price.

Next time we look at the investment sector.

Long-run Trends in Housing Price Growth

The RBA in their latest edition of The Bulletin has included an article examining the factors driving long-run trends in Australian housing price growth over the past three decades. They look at factors like supply, inflation and population growth.

However the glaring omission in our view is the direct impact easier credit and capital ratios have had on bank lending. Without the credit boom we could not have had a house price boom. Whilst they do point out that price to income ratios are high (but more static), we think this is a function of income growth, and is directly connected with the current level at which banks are willing to lend.

During the 1980s, housing prices grew broadly in line with general price inflation in the economy. The period from the 1990s until the mid 2000s saw relatively strong housing price growth associated with a significant increase in the debt-to-income ratio of Australian households. Since the mid 2000s, strong population growth has played an increasing role in explaining housing price growth.

Over the past 30 years, Australian housing prices have increased on average by 7¼ per cent per year, and over the inflation-targeting period by around 7 per cent per year However, these averages mask three distinct phases:

  1. During the 1980s, annual housing price inflation was high, at nearly 10 per cent on average, but so too was general price inflation. In real terms, housing price inflation during the 1980s was relatively low, at 1.4 per cent per annum compared with 4.5 per cent during the period from 1990 to the mid 2000s, and 2.5 per cent over the past decade.
  2. The 1990s until the mid 2000s were marked by quite high housing price inflation, of 7.2 per cent per annum, on average, in nominal terms.
  3. Annual nominal housing price inflation over the past decade was lower than either of these periods, at a little over 5 per cent on average.

They note that housing price growth, has outstripped the rate of inflation in other prices in the economy including inflation in the cost of new dwellings. They posit a range of drivers, for example population growth….

House-Prices-RBA-1Price to income and household debt to income ratios have never been higher than they are now. Part of this is explained by freeing up the financial system, so finance was easier to get.  The increased access to credit by Australian households over this period can be seen in the steady increase of the ratio of household debt to income. A similar trend is observed in the dwelling price-to-income ratio. While deregulation and disinflation were largely complete by the mid 1990s, the adjustment of the economy to the new steady state took well over a decade. These adjustments appear to have largely run their course, with the household debt-to-income ratio fluctuating around 150 per cent over the past decade.

House-Prices-RBA-2Finally supply did not keep up with demand. When compared with the range of underlying demand estimates, completions suggest that, over much of the past decade, the supply side has been slow, or unable, to respond to the significant increases in underlying demand (based on estimates of underlying average household size, rather than actual household size). More recently, the gap between underlying demand for and supply of new dwellings in Australia looks to have become smaller. Much of the aggregate gap was accounted for by developments in New South Wales. Underlying demand-supply gaps in Queensland and Western Australia also look to have contributed to the aggregate gap, although the estimates of underlying demand on a state level are subject to even larger uncertainty than those at the national level.

House-Prices-RBA-3They conclude that during the 1980s, housing price inflation broadly followed general price inflation in the economy, which was relatively high and
volatile. Following the financial deregulation of the mid 1980s and disinflation of the early 1990s, cheaper and easier access to finance underpinned a secular increase in households’ debt-to-income ratio that was closely associated with high housing price inflation from the early 1990s until the mid 2000s. The past decade saw a stabilisation of debt-to-income levels, but also a prolonged period of strong population growth – underpinned by high immigration – and smaller household sizes that led to increases in underlying demand exceeding the supply of new dwellings.

Looking ahead, they say it seems unlikely that there will be a return to the rather extreme conditions of the earlier episode when significant increases in household debt supported high housing price growth. Nonetheless, protracted periods of changes in population growth that are not met by adjustments in dwelling supply could lead to periods of sizeable changes in housing price growth. One important factor for housing price growth is the ability of the supply of new dwellings to respond to changes in demand. The significance of this is made clear by the recent increases in
higher-density housing and lower growth of those prices relative to prices of detached houses, whose supply has been less responsive.

We think the generous capital adequacy ratios and the banks fixation to lend on property however is the root cause. We think they should have looked harder at credit supply, and capital ratios in the context of bank profitability.

CEDA Super Report, A Curate’s Egg

A CEDA report released today is calling for an overhaul of retirement policy, including options such as pre-tax mortgage repayments and superannuation being available for owner-occupied home purchases, to be considered. We think, like the curate’s egg, it is good in parts!

Whilst we agree that a root and branch review of retirement income provisions should be undertaken (superannuation, SMSF, and government pensions holistically), we do not agree with the option of allowing savers to access superannuation for house purchase, nor a tax offset against mortgage interest payments. Both of these extend the ability of people to pay more for property, and will simply lift prices further above their long term norms. It also reinforces the view that property is about savings, not somewhere to live, as we discussed recently. We need a focus on the supply side of property, to meet demand, and reduce the price to income disparity. Extending yet more ability to purchase simply moves the problem on another generation and make ever larger mortgages worse, creating yet more risk in the banking sector. At some point the music has to stop.

“Two key trends, our ageing population and decreasing housing affordability, mean Australia’s retirement system structure needs a significant rethink,” CEDA Chief Executive Professor the Hon. Stephen Martin said when releasing The super challenge of retirement income policy.

“Talk about our ageing population and the impact on retirement policy has been part of national debate for many years but the impact of sustained housing affordability issues is only just beginning to be recognised as a significant issue for retirement policy.

“However, if it is not addressed the long term consequences could be significant with an increasing number of people living in poverty in retirement and unsustainable fiscal pressure on the Federal Budget.

“We already know from CEDA’s report Addressing entrenched disadvantage in Australia, released in April this year, that between 1 and 1.5 million Australians live in poverty and the elderly, particularly those who do not own their home, are an at-risk group. In fact, the overall poverty rate of older people in Australia is three times the OECD average, and one of the highest.

“Without a significant policy overhaul, that number is likely to significantly rise over the next 40 years.

“There has been a lot of talk and tweaking of retirement policy aimed at reducing the burden on government, but what Australia needs is a robust discussion on all the options to ensure long term Australians can retire comfortably.

“We strongly agree with the sentiments at last week’s National Reform Summit that tinkering at the edges is no longer an option and that discussion needs to broaden on this important issue.

“The system needs to be reviewed in its entirety. Ensuring retirement policies are not too onerous on the Federal Budget should be an outcome, but the focus must be on ensuring a sustainable system that delivers an adequate living standard for retirees.”

Professor Martin said the other priority must be a national conversation to confirm the objectives of the system, which would go a long way to alleviating confusion among the public, industry and government.

“Our retirement system should ensure Australians can retire with dignity and an adequate living standard, while providing a social safety net for those cannot afford to save enough for retirement,” he said.

Professor Martin said CEDA’s position is that there are a number of options that could help radically reshape retirement policy in Australia to improve its effectiveness in the long term and they need to all be put on the table and reviewed for their merits given the current environment.

“Obviously taxation arrangements need review because currently concessions are benefiting the rich and are being used as tax mitigation measures rather than to encourage retirement savings. However, the other area that needs review is the treatment of the family home,” he said.

“One option would be make the family home part of the assets test for the Age Pension and change superannuation payments to an after income tax payment, with all other super tax concessions removed.

“Alternatively, mortgage payments on the family home could be allowed to be made pre-tax.

“Implementing one of these options would allow for two important components of retirement savings – superannuation and the family home – to be treated the same.”

In addition Professor Martin said to further recognise the role of housing in alleviating poverty in retirement, first home buyers could be allowed to access superannuation funds to purchase owner-occupied housing.

“How policy impacts women should also be part of any review with women currently the most disadvantaged by the current system,” he said.

“We recognise that each of these policy recommendations come with their own issues, for example making mortgage repayments pre-tax could contribute to pushing house prices up. However, with the right combination of policy levers and checks and balances they are genuine options that should be explored given the trends we are now facing.”

The CEDA research report The super challenge of retirement income policy can be downloaded here.

The Long-Term Evolution of House Prices: An International Perspective

Excellent speech from Lawrence Schembri, Deputy Governor, Canadian Association for Business Economics on house price trends. The speech, which is worth reading, contains a number of insightful charts. Australian data is included. He looks at both supply and demand issues, and touches on macroprudential.  You can watch the entire speech.

I have highlighted some of the main points:

First, Chart 1 shows indexes of real house prices since 1975 for two sets of advanced economies. Chart 1a shows Canada and a set of comparable small, open economies (Australia, New Zealand, Norway and Sweden) with similar macro policy frameworks and similar experiences during and after the global financial crisis. In particular, they did not have sizable post-crisis corrections in house prices. For comparison purposes, Chart 1b shows a second set of advanced economies that did experience significant and persistent post-crisis declines in house prices.

Real-House-PricesSince 1995, house prices in Canada and the set of comparable countries have increased faster than nominal personal disposable income (Chart 2a). During this period, all of these countries experienced solid income growth, with the strongest growth in Norway and Sweden (Chart 2b).

Price-to-IncomeDuring the global financial crisis, these countries also experienced house price corrections. This caused the ratios of house prices to income to decline temporarily, after which they continued climbing.

One of the factors that has affected population growth rates is migration. Net migration was highest in Australia and Canada over the entire sample. In addition, net migration increased importantly in all five countries in the second half of the sample period (Chart 3b)

population-GrowthIn Australia, Canada and New Zealand, the rate of population growth of the approximate house-owning cohort of those aged 25 to 75 declined in the second part of the sample period. This likely reflects the aging of their populations as the postwar baby boom generation moved from youth into middle age (Chart 4). Nonetheless, the growth rate of this cohort still remains well above 1 per cent for these three countries.

CohortsChart 9 provides some suggestive evidence on the impact of land-use regulations on median price-to-income ratios. Many of the cities with higher ratios also have obvious geographical constraints—Hong Kong and Vancouver are good examples—so the two sources of supply restrictions likely interact to put upward pressure on prices.SupplyWhen we look at the post-crisis experiences of the countries in our comparison group, they have similar levels of household leverage, measured by household debt as a ratio of GDP (Chart 12). Household leverage has risen along with house prices, as households have taken advantage of low post-crisis interest rates. The one exception is New Zealand, where a modest degree of household deleveraging seems to have occurred. For Canada, the ratio of household debt to GDP has risen since 1975, although the growth of this ratio has notably declined since 2010. For Sweden and Norway, the ratio also grew at a modest pace in the post-crisis period. Note Australia has the highest ratios.

LeverageCharts 13a and b draw on recent work by the IMF, which shows that macroprudential policies in the form of maximum loan-to-value (LTV) or debt-to-income (DTI) ratios have tightened across a broad range of countries over the past 10 years. The IMF’s research, as well as that of other economists, has found evidence suggesting that the tightening has helped to: reduce the procyclicality of household credit and bank leverage; moderate credit growth;
improve the creditworthiness of borrowers; and lower the rate of house price growth.

The most effective macroprudential policies to date appear to have been the imposition of maximum LTV and DTI constraints. Increased capital weights on bank holdings of mortgages have also had an impact. While long-term evidence on these instruments is not yet available, permanent measures that address structural regulatory weaknesses and that are relatively straightforward to implement and supervise will likely be the most effective over time.

MacroprudentialInteresting to note that in Canada, they have had four successive rounds of macroprudential tightening, primarily in terms of the rules for insured mortgages. The maximum amortization period for insured loans has been shortened from 40 years to 25. LTV ratios have been lowered to 95 per cent for new mortgages, and 80 per cent for refinancing and investor properties. These latter two changes effectively eliminate new insurance for refinancing and investor properties. Qualification criteria such as limits on the total debt-service ratio and the gross debt-service ratio, as well as requirements for qualifying interest rates, have also been tightened.

Conclusion

Let me conclude with a few key points from the mountain of facts, graphs and analysis that I have reviewed with you today. As I mentioned at the outset, the purpose of my presentation is to help provide more context for an informed discussion about housing and house prices given their importance to the Canadian economy and the financial system.

First, real house prices have been rising relative to income in Canada and other comparable countries for about 20 years. There are many possible explanations, mostly from the demand side, but also from the supply side.

Second, in terms of demand, demographic forces, notably migration and urbanization, have played a role in the evolution of house prices, as have improving credit conditions through lower global real long-term interest rates and financial liberalization and innovation. There are, of course, other demand factors that warrant more data and analysis, including the impacts of foreign investment and possible preference shifts.

Third, in terms of supply, the constraints imposed by geography and regulation have decreased housing supply elasticity, especially in urban areas. This reduced supply elasticity has interacted with demand shifts toward more urbanization to push up house prices in major cities.

Fourth, the credible and effective macro and financial policy frameworks in place in Canada and the other countries considered here have contributed to a high degree of macroeconomic and financial stability. Consequently, in the face of a protracted global recovery, their countercyclical policies successfully underpinned domestic demand in the post-crisis period. The resulting strength in the housing market has increased household imbalances, but the risks stemming from these vulnerabilities have been well managed by complementary macroprudential policies.

The experience in these countries therefore suggests that macroprudential policies that address structural weaknesses in the regulatory framework are best suited for mitigating such financial vulnerabilities. They reduce tail risks to financial stability and enhance the overall resilience of the financial system.

Who Benefits from High House Prices?

Most would accept that house prices in the major Australian centres are too high. Whether you use a measure of price to income, loan value to income, or price to GDP; they are all above long term trends. Indeed, in Sydney and Melbourne, they are arguably more than 30% higher than they should be. The latest DFA Video Blog discusses the issue and identifies the winners and losers, together with a transcript.

Ultra-low interest rates currently make large loans affordable for many households, yet overall household debt is as high as it has ever been and mortgage stress, even at these low interest rates is quite high. Banking regulators are concerned about systemic risks from overgenerous underwriting criteria and they have been lifting capital ratios to try to improve financial stability, with a focus on the fast growing investment sector. In many countries around the world, house prices are also high, so from New Zealand to UK, regulators are taking steps to try limit systemic risks. These rises are partly being driven by global movements of capital, ultra-low interest rates and quantitative easing.

However, let’s think about who benefits from high and rising prices. First anyone who currently holds property (and that is two-thirds of all households in Australia) will like the on-paper capital gains. This flows through to becoming an important element in building future wealth. In addition, refinancing is up currently, and we see some households crystalising some of the on-paper gains for holidays, a new car or other purposes, stimulating retail activity. A recent RBA research paper, suggests that low-income households have a higher propensity to purchase a new vehicle following a rise in housing wealth than high-income households.

Those holding investment property also enjoy tax-concessions on interest and other costs; and on capital appreciation. Rising wealth generally supports the feel-good factor, and consumer confidence – though currently this is a bit wonky.

Higher values stimulates more transactions, which creates more momentum.

Now, the one-third of households who are not property active, consist of those renting and those living with family, friends or in other arrangements. Their confidence levels are lower and they are not gaining from rising house prices. A relatively small proportion of these are actively seeking to buy, and they are finding the gradient becoming ever more challenging, as saving for a deposit is becoming harder, lending criteria are tightening and income growth is slowing. We have noted previously that a rising number of first time buyers have switched directly to the investment sector to get into the market. Generally younger households are yet to get on the housing escalator, whilst older generations have clearly benefited from sustained house price growth. This has the potential to become a significant inter-generational issue.

But overall, the wealth effect of rising property is an umbrella which spreads widely. The sheer weight of numbers indicates that there are more winners than losers. No surprise then that many politicians will seek to bathe in the reflected glory of rising values, whilst paying lip-service to housing affordability issues.

There are other winners too. For states where property stamp-duty exists, the larger the transaction value and volume, the higher the income. For example, in NSW, in January and February nearly $1bn was added to coffers thanks to this tax and the state is well on track to achieve the $6.1 billion of stamp duty forecast in the 2014-15 budget papers. The higher the price the larger the income. The tax-take funds locally provided services so ultimately residents benefit.

The banks also benefit because rising house prices gives them the capacity to lend larger loans (which in turn allows house prices to run higher again). They have benefited from relatively benign capital requirements and funding, thus growing their balance sheet and shareholder returns. Whilst recent returns have been pretty impressive, future returns may be lower thanks to changes in capital ratios and especially if housing lending moderates. On the other hand, their appetite to lend to productive business and commercial sectors is tempered by higher risks and more demanding capital requirements. The relative priority of debt to housing as opposed to productive lending to business is an important issue and whilst higher house prices can flow through to real economic growth, it is mostly illusory.

Finally, building companies can benefit from land banks they hold, and development projects, despite high local authority charges. We also note that some banks are now winding back their willingness to lend to the construction industry (because of potentially rising risks). The real estate sector of course benefits, thanks to high transaction volumes and larger commissions. Mortgage brokers also enjoy volume and transaction related income. Even retailers with a focus on home furnishings and fittings are buoyant.

So standing back, almost everyone appears to benefit from higher prices. But is it really a free-kick? Well, for as long as the music continues to play, it almost is. The question becomes what happens if (or when) prices were to fall (remember that during the GFC, northern hemisphere prices fell in some places up to 40%, though since then prices in the US, Ireland and the UK have started to recover). Given our exposure to housing, there would be profound impacts on households, banks and the broader economy if values fell significantly.

But underlying all this, we have moved away from seeing housing as something which provides shelter and somewhere to live; to seeing it as just another investment asset class. This is probably an irreversible process, and part of the “financialisation” of society, given the perceived benefits to the economy and households, but we question whether the consequences are fully understood.

National Wealth, Land Values and Monetary Policy

Philip Lowe, Deputy Governor RBA gave an address to the 54th Shann Memorial Lecture. In it he discussed the growth in land and property values and some important implications. Here are a few salient points. Households borrowing is higher and more risky, lower income growth means households are less likely to spend more, and value is being shifted inter-generationally speaking.

According to the ABS’ latest estimates, the total value of Australia’s assets as at end June 2014 was around $12½ trillion, or around $500,000 for each person living in Australia. After an adjustment is made for net foreign liabilities, the net asset position, or net wealth, was around $10 trillion, which is the equivalent to around six times Australia’s annual GDP.

The second observation is that, over recent decades, net wealth has increased at a faster rate than has GDP. Between 1989 and 2014, the nominal value of net wealth increased at an average pace of around 7 per cent per year, compared with an average increase in nominal GDP of around 6 per cent. While net wealth grew more slowly than GDP in the first half of the 1990s, for most of the time since it has grown more quickly than GDP.

Graph 1: Net Wealth and GDP 
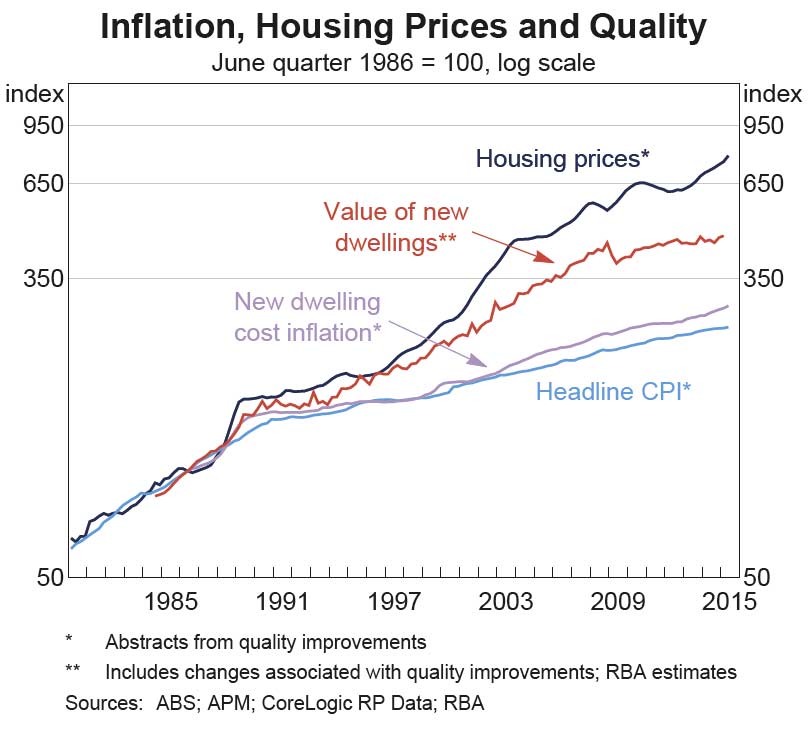
The third observation relates to the composition of our national assets. Land is the asset class with the highest value. As at June 2014, it accounted for 34 per cent of the value of our national assets. This is followed by non-dwelling construction – offices, factories, infrastructure, etc. – which accounts for a further 18 per cent of total assets. And then overseas financial assets and the value of our dwellings each account for a little under 15 per cent of the national balance sheet. Intellectual property assets account for only around 2 per cent of the total.

Graph 2: National Assets The final and perhaps most interesting set of observations relate to how the structure of the balance sheet has changed through time.

One very clear trend has been a substantial increase in the value of our foreign financial assets and liabilities; both have increased much faster than net wealth. In effect, as we have become more globally integrated as a nation, there has been a grossing-up of our balance sheet with the rest of the world. Australians now hold many more overseas assets than they once did. And, conversely, overseas residents now hold many more Australian assets than they once did.

Graph 3: Net Wealth as a share of GDP
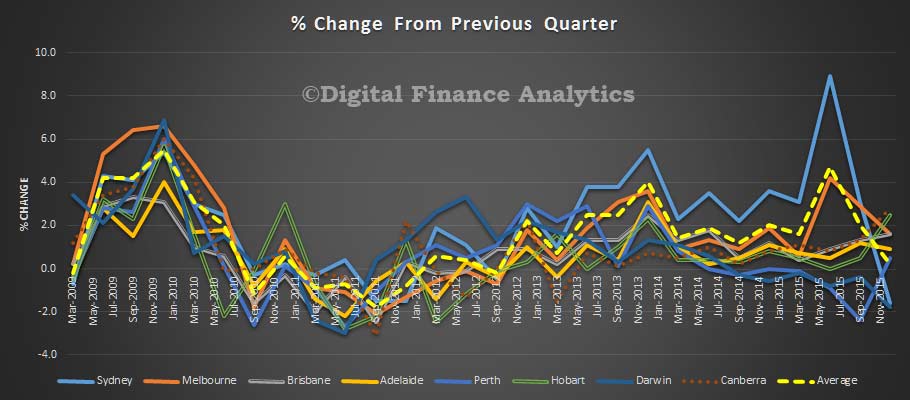
So, how do we explain this increase in the value of our residential land over recent decades?

There are two main structural factors.

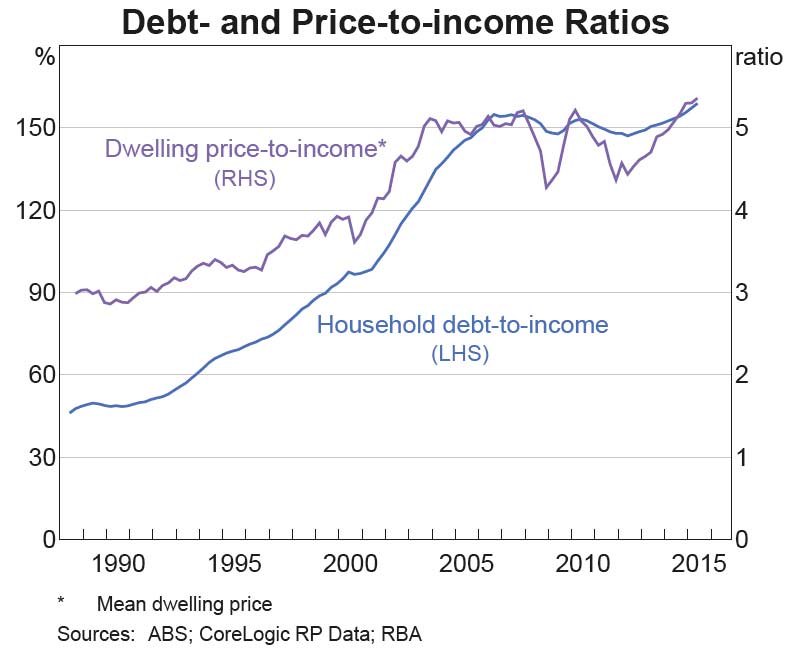
The first is the combination of financial liberalisation and low inflation. In the 1970s and 1980s, regulation of the financial system and high inflation served to hold down land prices artificially. They did this by limiting the amount that people could borrow. When the financial system was liberalised and low inflation became the norm, people’s borrowing capacity increased. Many Australians took advantage of this and borrowed more in an effort to buy a better property than they previously could have done. But, of course, collectively we can’t all move to better properties. And so the main effect of increased borrowing capacity was to push up housing prices, and that means land prices.

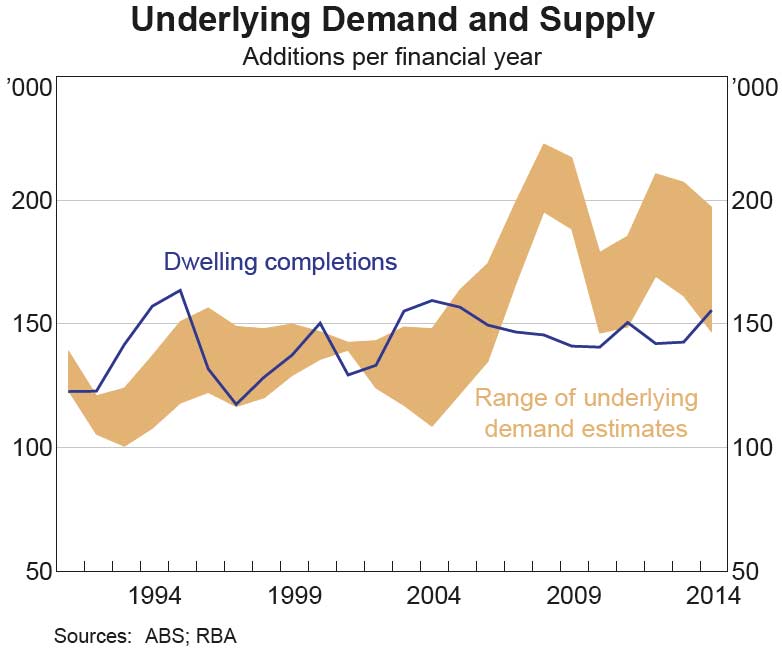
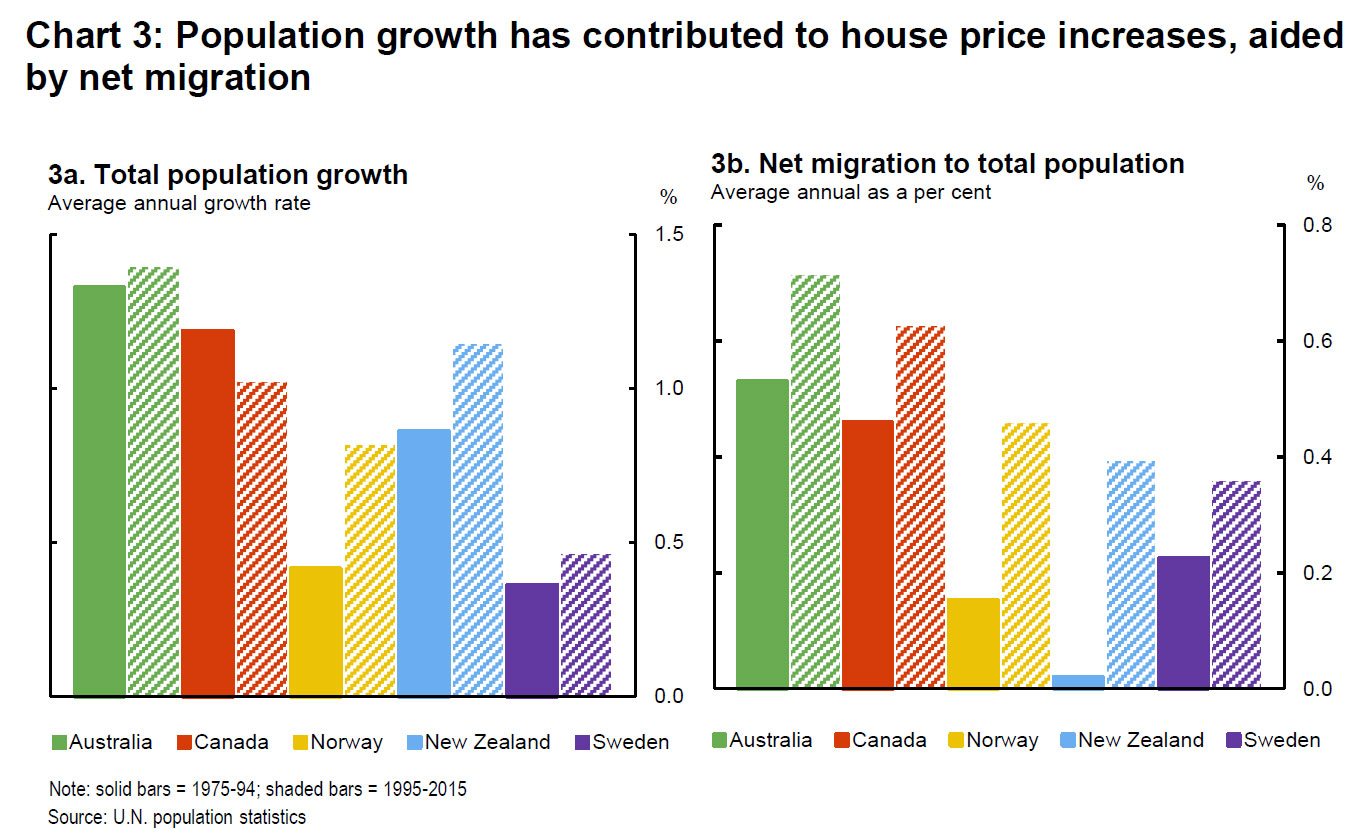
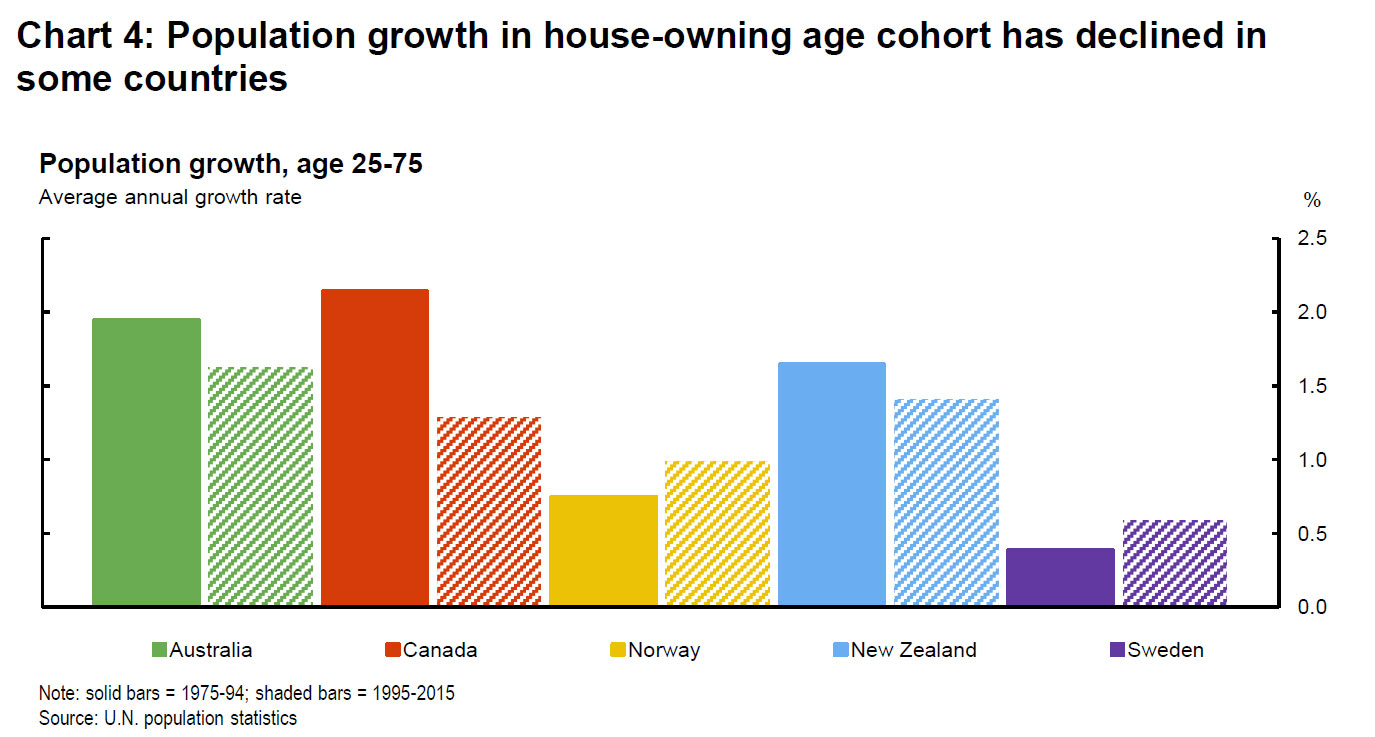
The second factor is the combination of strong population growth and the structural difficulties of increasing the effective supply of residential land. Since 1989, the Australian population has increased by more than 40 per cent, or around 7 million people, one of the fastest rates of increase among the advanced economies. The difficulties of responding to this on the supply side of the housing market have been well documented. They include the challenges of developing land on the urban fringe and of rezoning land close to city centres for urban infill. They also include, in some areas, underinvestment in transportation infrastructure. This underinvestment has effectively constrained the growth in the supply of ‘well-located’ land at a time when demand for this type of land has grown very strongly. The result has been a higher average price of land in our major cities.

Another possible structural explanation is that the higher land prices reflect an upward revision to people’s expectations of future income growth and thus the amount they are prepared to pay for housing services. One possible reason for this is that the growth of our cities generates a positive externality – by bringing more people together competition is improved and productivity is higher. While this might be part of the story, I think it is unlikely to be a central part. Real income growth per capita did pick up markedly from around the mid 1990s, but it has subsequently slowed substantially, with apparently little effect on the price of land relative to income.

So the story is really one of increased borrowing capacity, strong population growth and a slow supply response.

It is arguable that the main impact of higher land prices is not really to increase our national wealth, but to change the distribution of that wealth.

The distributional effects are in two dimensions. The first is cross-sectional, with the existing owners of dwellings receiving capital gains when land prices increase. The second is the distribution of wealth across generations, with the current owners of dwellings earning capital gains but future generations paying higher housing costs. Both of these aspects of changing wealth distribution have economic and social consequences, neither of which, I suspect, are yet fully understood.

How the intergenerational distribution ultimately plays out will depend critically upon the extent to which the gains that have accrued to the current generation are passed on to the next generation. In general, we know relatively little about intergenerational transfers, but what we do know suggests that things may be changing gradually. One illustration of this can be seen in the Household, Income and Labour Dynamics in Australia (HILDA) Survey, which suggests that, over time, there has been some increase in the share of first-home buyers that are receiving loans from family and friends. There is also some evidence of younger generations receiving increased assistance with household expenses from older generations, including by continuing to live in the family home.

Graph 8: First-home Buyers that Received Loan from Family or FriendsThree issues relevant to monetary policy that are closely related to the issues I have been talking about.

Higher land prices and spending

The first of these is the link between higher housing prices and household spending.

There is a well-established research literature empirically demonstrating that higher housing wealth boosts household consumption. For example, work done by my colleagues at the Reserve Bank of Australia (RBA) has estimated that a rise in wealth of $100 leads to a rise in non-housing spending of between $2 and $4 per year.

There are two commonly accepted channels that explain this relationship.

The first is a pure wealth channel. To the extent that higher dwelling prices are perceived to increase wealth, households should spend a little of that extra wealth each year over their lifetime.

The second is the collateral channel, as higher land prices increase the value of collateral that can be posted by potential borrowers. The increased collateral makes it easier for credit-constrained households to borrow to increase their spending. Similarly, businesses can find it easier to finance projects that previously might have struggled to get finance.

Over recent years, there has, however, been some reinterpretation of the role of the pure wealth channel.

In part, this reflects the issues that I was speaking about a few moments ago; that is, that higher housing prices not only deliver capital gains to the existing owners but also imply a higher price of future housing services. The reinterpretation of the evidence is that the link between housing wealth and spending arises not so much through the traditional pure wealth channel, but rather because higher housing prices are sometimes a proxy for faster expected income growth into the future. And it is this lift in expected income growth that spending is really responding to.

Interestingly, other colleagues at the RBA have recently been examining this idea, again using household level data from the HILDA Survey. They find clear evidence in favour of a collateral channel, especially for younger households who are more likely to be credit constrained. In contrast, they find no evidence in favour of the traditional pure wealth effect. Instead, their evidence is consistent with the alternative expected-income idea. Perhaps, the most intriguing aspect of their results is that when housing prices in a particular area increase, renters in that area increase their consumption. The increase is not as large as for owner occupiers, but it is an increase. The conclusion that my colleagues reach is that it is a common third factor such as higher expected future income, or less income uncertainty, that is, at least partly, responsible for the observed association between housing wealth and spending.

If this conclusion is correct, then I think it helps partly explain what is going on in the economy at the moment. In the early 2000s, when housing prices and real incomes were rising quickly, many households used the higher value of their housing assets to increase their spending. Nowadays, this is not happening on the same scale that it once was. With slower expected future income growth and increased concerns about future housing costs, the response to higher housing prices looks to be smaller than it was previously. And this smaller response is affecting overall spending in the economy.

Liabilities and risk

The second issue that I wanted to touch on is the increase in debt that has accompanied the increase in land prices.

Throughout this talk I have barely touched on the liability side of the balance sheet. This is largely for the reason that I spoke about at the start, namely that financing transactions that are internal to the country do not change Australia’s net wealth. However, these transactions can have a material impact on the profile and riskiness of the individual balance sheets within the economy.

The rise in land prices that I have spoken about is inextricably linked to the rise in household borrowing. Together, these two developments have grossed up the household sector’s balance sheet. This means that, on the assets side of the balance sheet, a given percentage change in housing prices has a bigger effect than it once did. And on the liabilities side, movements in interest rates also have a bigger effect.

Graph 9: Household Balance Sheet We are still trying to understand fully the implications of all of this. However, I think it is difficult to escape the conclusion that household balance sheets are, on average, a little more risky than they once were. Many Australian households also seem to have reached a similar conclusion. This is reflected in the decision by many Australians to take a more prudent approach to their spending over recent years.

I suspect that it is unlikely to be in our national interest for this more prudent approach to give way to household consumption once again growing consistently much faster than our incomes. This is something we continue to be cognisant of in the setting of monetary policy. Some decline in the rate of household saving is probably appropriate as the economy rebalances after the terms of trade and mining investment booms. But, given the position of household balance sheets, it is unlikely to be in our long-term interest for a consumption boom to be financed by a pick-up in household borrowing.

Generating growth

That brings me to my final issue: that is the need to generate sustainable growth in the economy.

Monetary policy can play some role here, including by helping reduce uncertainty by maintaining low and stable inflation and overall stability in the economy. But monetary policy is, ultimately, not a driver of medium-term economic growth. Indeed, while low interest rates are currently helping the economy through a period of transition, an extended period of low interest rates implies ongoing low returns to savers and low underlying returns on assets. This is not a world to which we should aspire.

One of the challenges we face as a country is to lift the expected risk-adjusted return on investment in new assets, whether they be physical assets or human capital. If we can do this, then we will see the investment in new assets that is crucial to the sustainable expansion in the economy.

There is no single lever that can be pulled here. But neither is there a shortage of sensible ideas that, if implemented, could improve the environment for the creation of new assets in Australia.

These ideas include: a strengthening of the culture of innovation; the removal of unnecessary and overly complicated regulation; and making competition work effectively in markets across the country. Increased investment in infrastructure, including in transport, probably also has a role to play here. Done properly, it could help lift the return to other forms of investment in a wide range of industries across the economy. Better transportation can also increase the effective supply of well-located land, making housing more affordable for many Australians. None of this is easy, but neither is it impossible.

Capital city dwelling values 9.8% higher over the financial year – CoreLogic RP Data

Based on the CoreLogic RP Data June home value results capital city dwelling values finished the 2014/15 financial year on a strong footing, with dwelling values rising 2.0 per cent over the June quarter and 9.8 per cent higher over the year. The rate of capital gain was slightly higher over the second half of the year (5.1 per cent) compared with the first half (4.5 per cent) highlighting that the housing market has gathered some momentum during 2015. The previous 2013/14 financial year recorded a slightly higher rate of growth at 10.1 per cent.

Since dwelling values started rising in May 2012, Sydney dwellings have seen a 43.1 per cent surge in values and Melbourne values are up by 25.9 per cent. Despite softer market conditions in Perth, dwelling values are currently up 12.8 per cent over the cycle which represents the third highest growth rate across the capitals. Simultaneously, Brisbane’s property market has shown the fourth highest rate of growth at 12.4 per cent, followed by Adelaide (10.4 per cent), Hobart (9.6 per cent), Darwin (8.9 per cent) and Canberra (8.8 per cent).

Looking at the performance of detached housing versus apartments over the financial year, houses are clearly outperforming units in the capital gains stakes. Over the financial year, house values were 10.4 per cent higher across the combined capitals index while unit values increased by a much lower 5.6 per cent. The same trend where houses are showing a higher capital gain than units is evident across each of the capital cities except Hobart and Darwin.

Today’s results confirm a scenario where detached housing outperforming apartments is most evident in Melbourne. Based on the results, Melbourne house values have shown a very strong 11.2 per cent capital gain over the financial year while apartment values are up by only 2.4 per cent.

Gross rental yields drifted another notch lower in June due to dwelling values rising at a faster pace than weekly rents. Currently, the typical gross yield for a capital city house is recorded at 3.5 per cent, which is equivalent to the record low last recorded in 2007. The average gross yield on a capital city unit also fell over the month to reach 4.4 per cent; the lowest gross apartment yield since 2010 and not far off the all-time low of 4.3 per cent recorded in 2007.