Contained in the latest edition of the Property Imperative, released today is an update on households and their attitude towards property. Over the next few days we will post some specific findings from the report. Today we look at aggregate demand.
To understand the current dynamics of the residential housing market we need to examine the behaviours of different household segments, because generic averaging across these diverse segments hides important differences. There are about 8.98 million households in Australia , and using analysis from the Australian Bureau of Statistics, and our own survey, we have segmented these households looking specifically at their property owning behaviour.
First we split the households into those which are property inactive, and those who are property active. Property inactive households were defined as those who currently rent, live with parents, or are homeless, with no plans to enter the market.
Property active households are those who own, or actively desire to own property, either as an owner occupier, or as an investor, and either own the property outright, have a mortgage or are actively looking. The analysis shows that about 26.1% percent of households are property inactive, which equates to about 2.35 million households. Examining past data, and applying the same analysis, we discovered that even correcting for population growth and migration, the property inactive proportion of the household population has been steadily increasing.
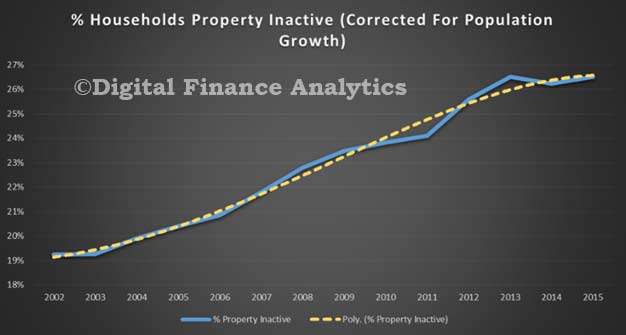 A similar fall in home ownership rates have been confirmed by others and it is suggested that the main reason for this trend is that house prices have simply grown faster than average incomes, thus making it harder to buy into the market.
 This signals an important underlying social issue, and is not being adequately addressed. Actually, we are seeing more households becoming tenants of the growing band of property investors, whilst many younger Australians are unable to buy for themselves, or are becoming property investors first. We note that in New Zealand, the Reserve Bank is consulting on changing the capital ratios for investment loans.
However, we will focus our attention on the property active household segments. To assist in our analysis we have segmented the property active segments by motivation and type. Below we outline our segments, and how they are defined.
- Want-to-Buys Household s who want to buy a property, are saving, but have not yet committed
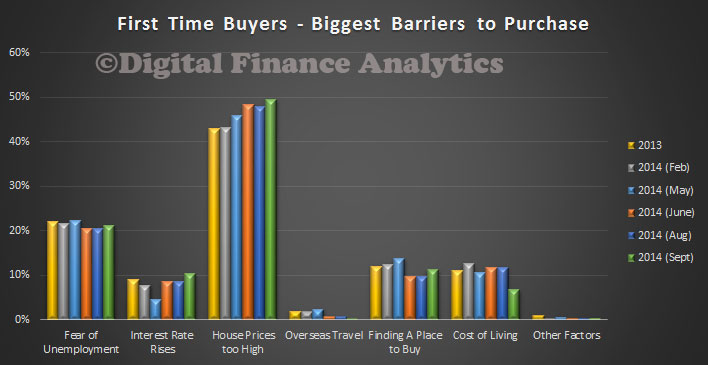
- First Timers Households who are buying, or have bought for the first time
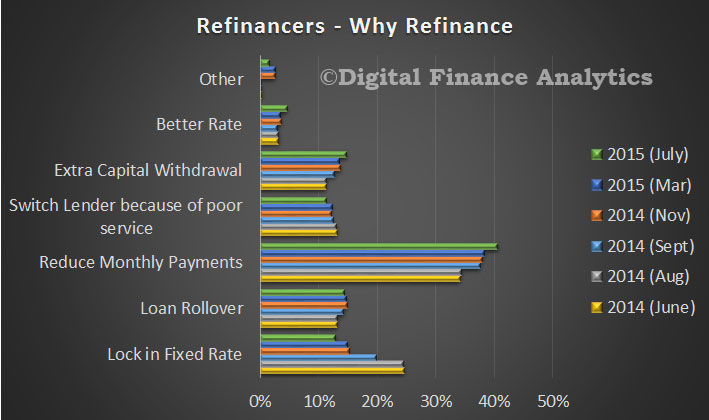
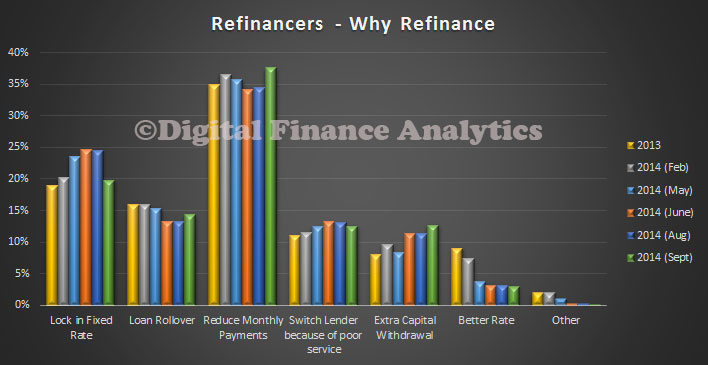
- Refinancers Households who are restructuring their finances, but not moving house
- Holders Households with no plans to move or refinance
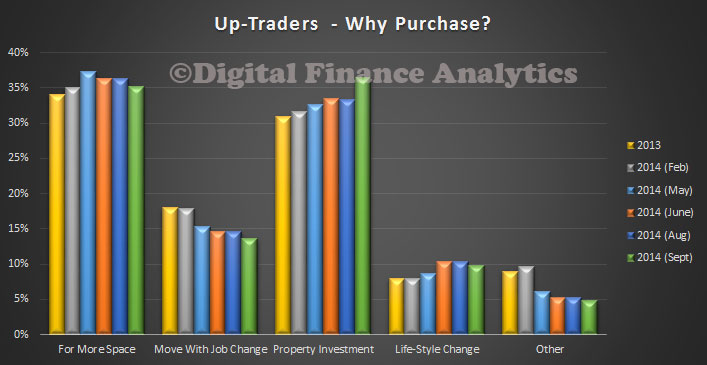
- Up-Traders Households looking to buy a larger place
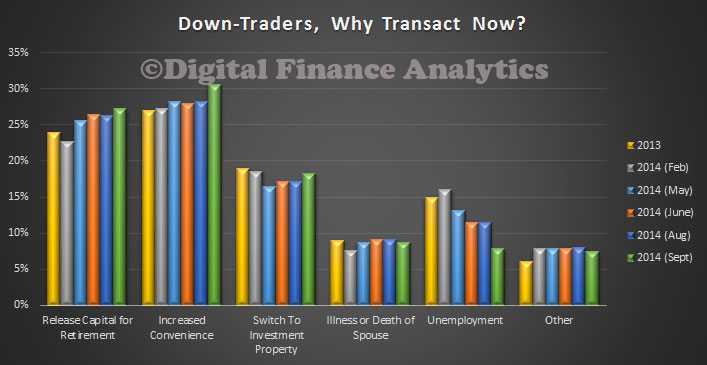
- Down-Traders Households looking to buy a smaller place
- Solo Investors Households with a single investment property
- Portfolio Investors Households with a portfolio of investment property
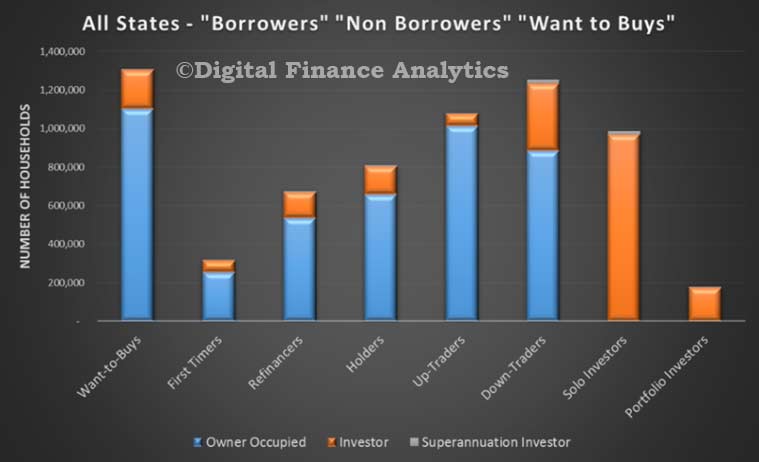
In our survey, we also mapped these segments across owner occupied and investment property types. The chart below shows the current number of households by segment distribution, as at September 2015 .
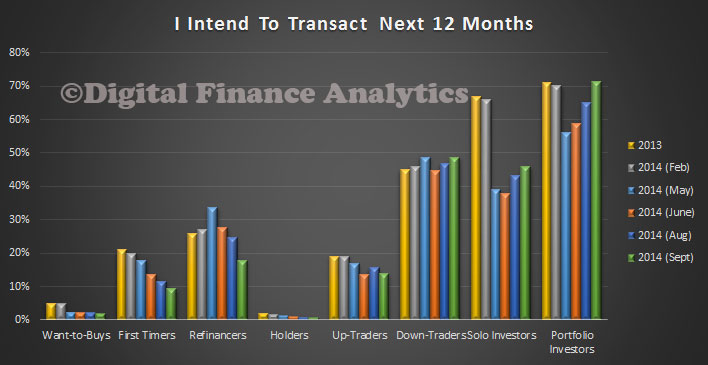
 In our surveys, we looked across a number of dimensions, within the segments. This included whether they were actively saving to buy, intending to transact, borrowing needs and house price expectations. We will outline findings from each of these.
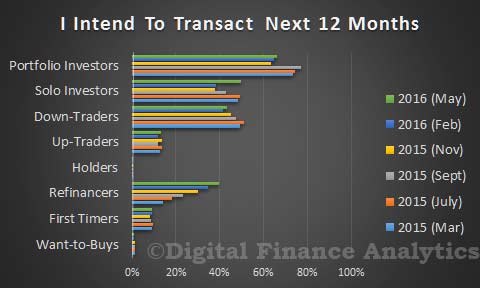
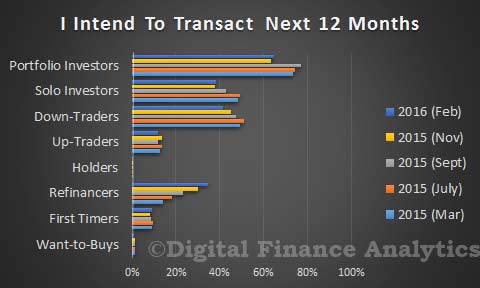
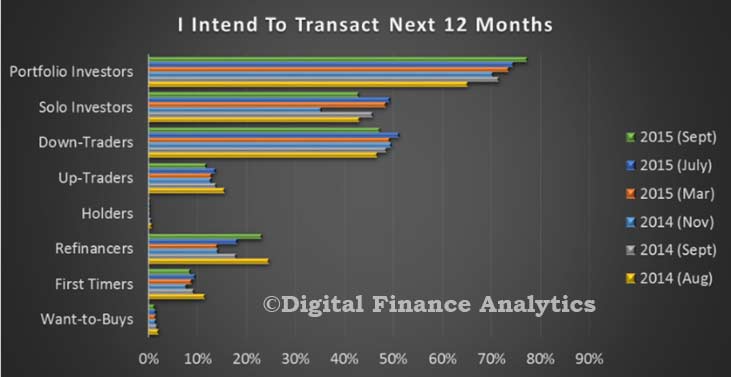
Portfolio Investors are more likely to transact in the next 12 months (over 77%), then solo investors (43%), then down traders (47%) and refinancers (23%). First time buyers (9%) and want to buys were least likely to transact (9%). Overall demand for property is still very strong, but headwinds are slowing momentum.
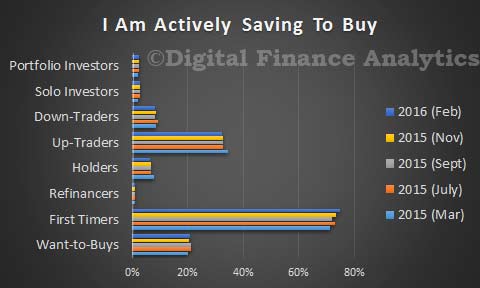
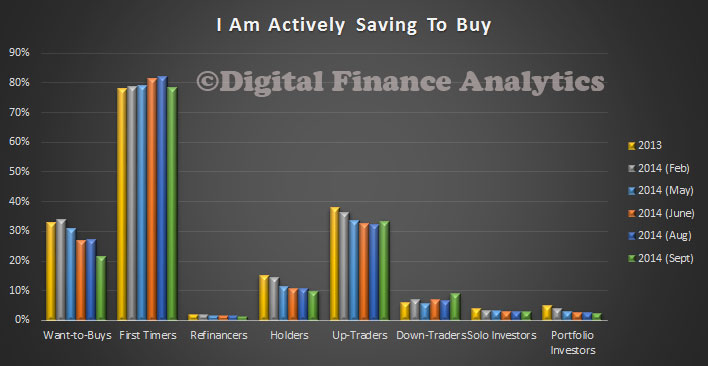
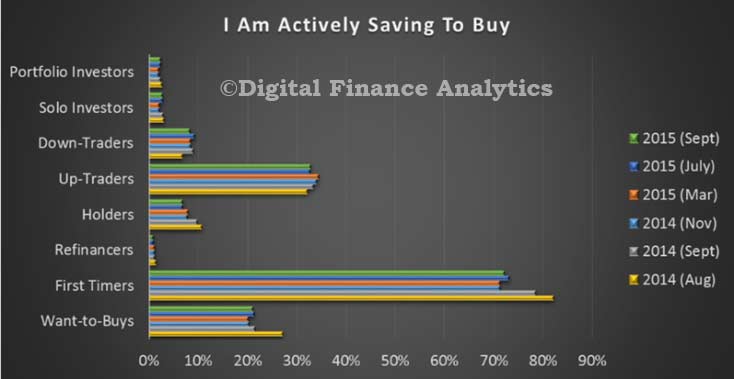
 That said, first time buyers are saving the hardest (72%), although want to buys (21%) and up traders (32%) are also saving.
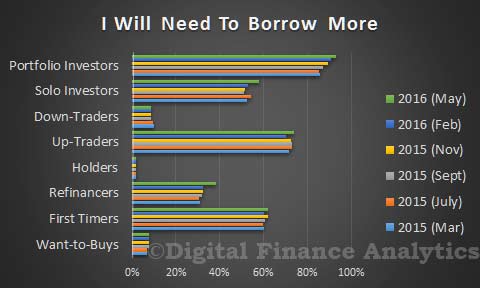
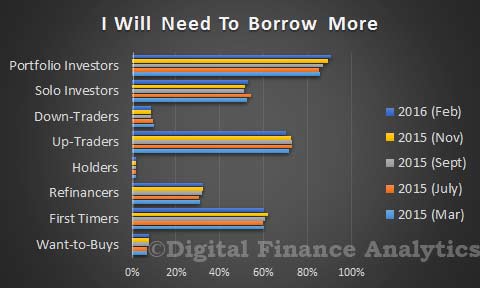
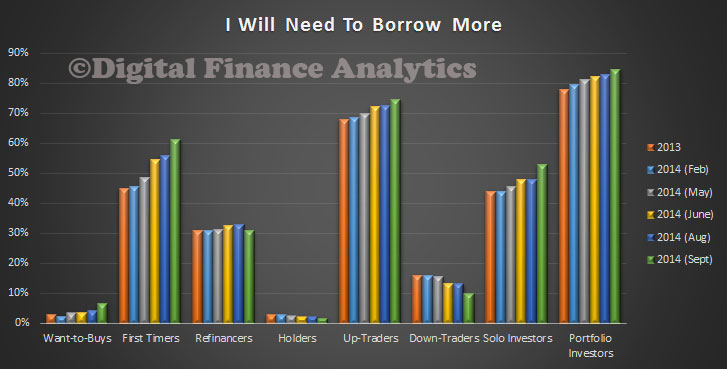
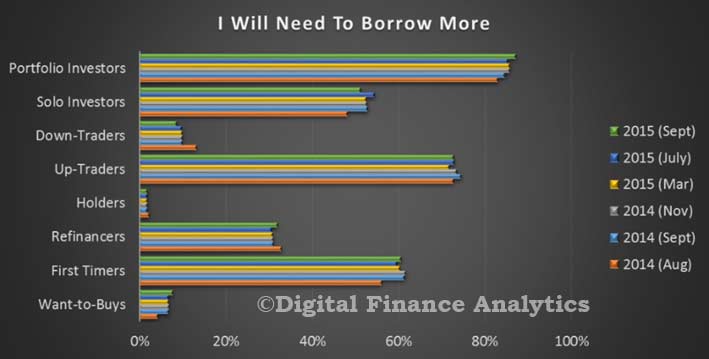
 Turning to borrowing expectations, portfolio investors are most likely to borrow more (87%), up traders (73%), first time buyers (60%) and sole investors (51%) are also in the market.
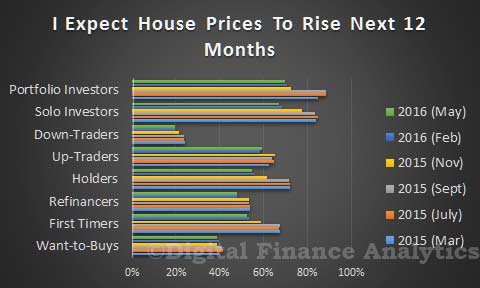
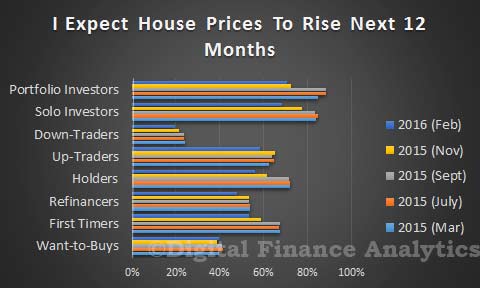
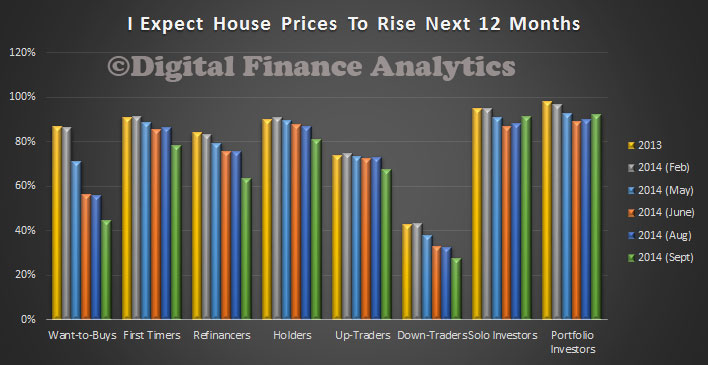
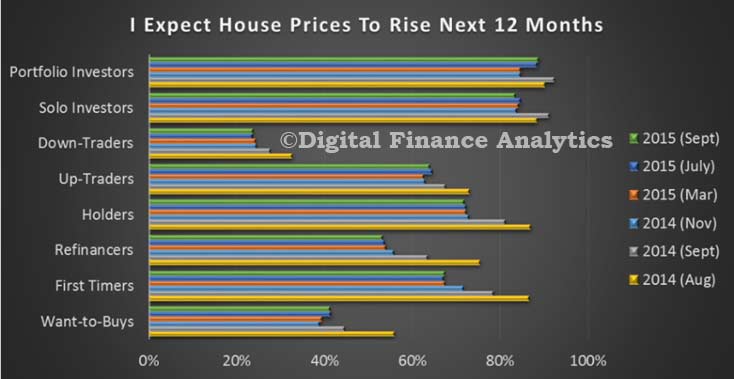
 Most segments are bullish on house prices over the next 12 months, with down traders being the least excited (24%). Investors have the strongest view of potential future growth, whilst the trends across other segments suggests a weakening of expectation, at the margin.
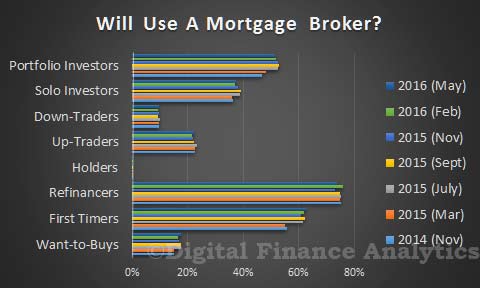
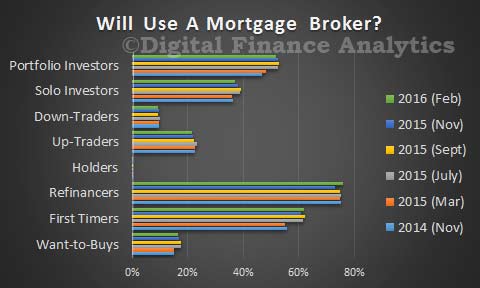
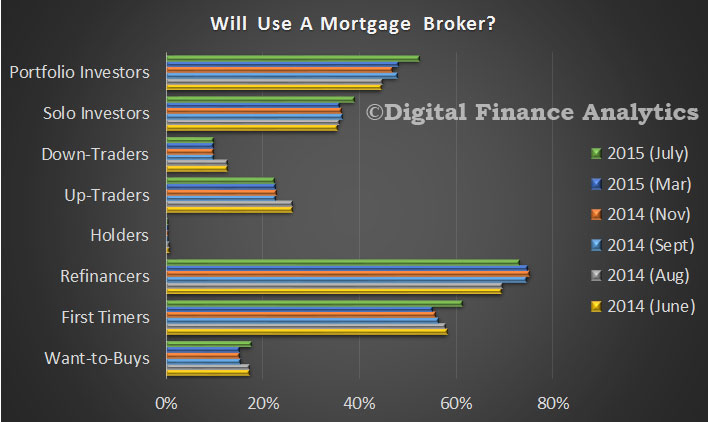
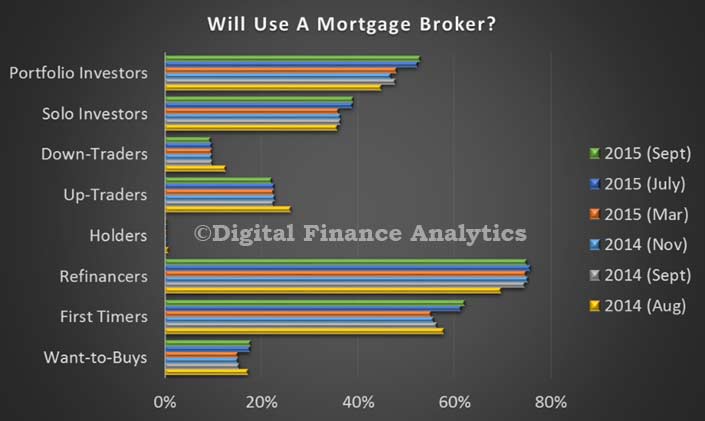
 Some segments are more likely to use a mortgage broker than others, with refinancers mostly likely to (75%), then first time buyers (55%) then investors (36%).
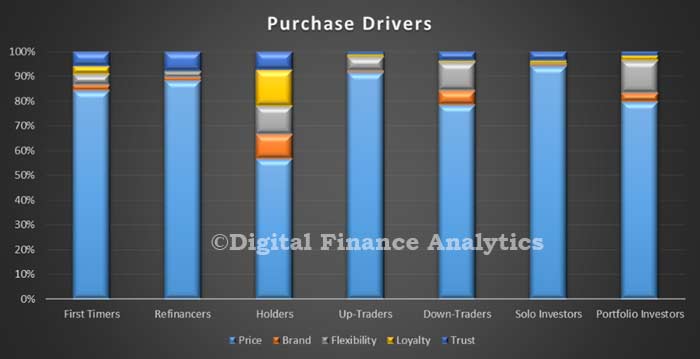
 One of the interesting aspects of the research is how consumers select a lender. More than ever, households do initial research online, using comparison sites, or social media before making a choice, either via a broker (who are doing well just now ), or direct with lenders. However these traditional business models are now at significant risk from digital disruption. The key selection criteria is price, price and then price. Below is segmented data, showing the relative importance of price, brand, flexibility, loyalty and trust. Apart for holders, who are not in the market currently, on average 80% of purchasers will make their final decision on the price of the deal. Brand is largely irrelevant.
 The average new loan has grown again, to over $428,000 for a NSW non-first time buyer, according to the ABS data to July 2015 . The growth in loan size is running more slowly than house price growth (circa 13% in NSW), but significantly above average income growth.
About 10% of loans have a fixed rate (thanks to the current low RBA cash rate and expectation of lower rates to come).
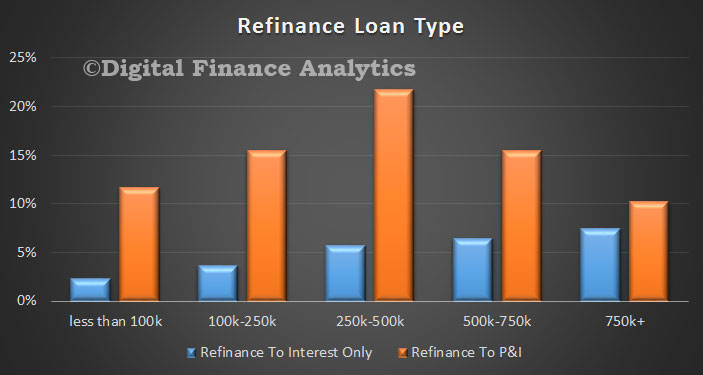
The proportion of interest only loans written continues to grow, according to APRA data. The latest data to June 2015 indicates that more than 40% of new loans are interest only.
Next time we will look in more detail at some of the segment specific data.

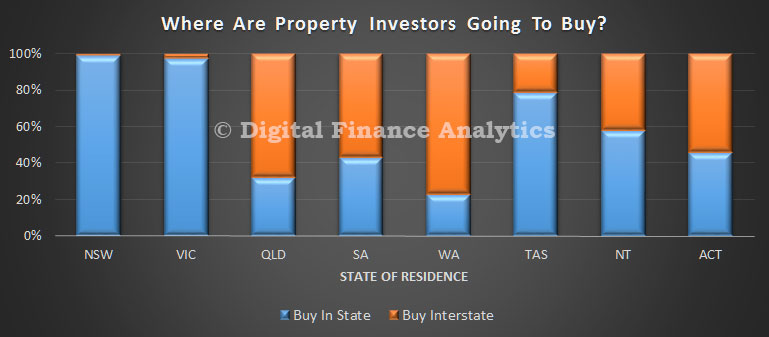 We then asked those considering interstate transactions, to identify their likely target state. In NSW, the small number considering interstate investment picked VIC, whilst residents in VIC going interstate will pick NSW. Across the other states, the majority of those seeking investments interstate will pick NSW, or second VIC. A smaller number would also select ACT. These three states captured the bulk of the interstate attention.
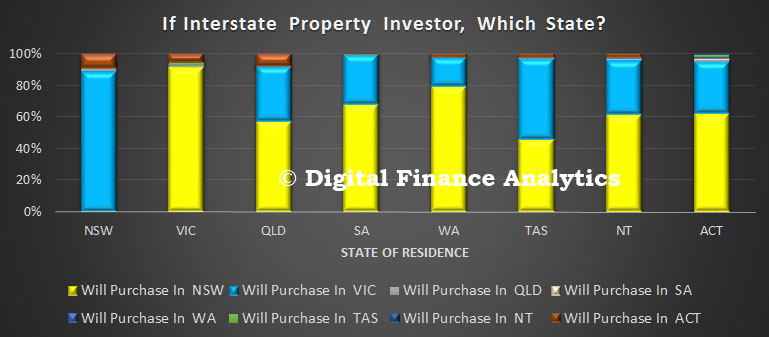 Finally, we asked about the drivers of this decision. The prime driver related to increased capital returns, a larger property market, lending criteria and rental returns.
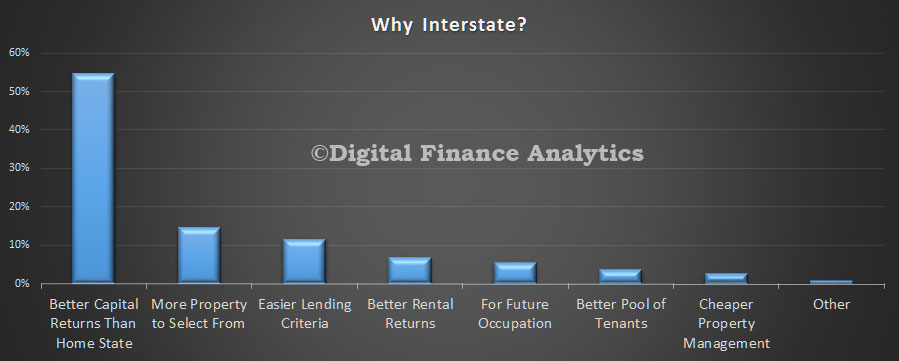 So, we can conclude that demand in NSW and VIC for investment property is heightened by interested interstate investors who are attracted by the higher returns in these two states. Further evidence of the two speed housing market.