
Please consider support our work via our Patreon page.

/
RSS Feed
Digital Finance Analytics (DFA) Blog
"Intelligent Insight"

We view the latest data on home lending and APRA’s latest speech.
Today the ABS published their housing lending statistics for May 2018, and APRA Chair Wayne Byers spoke on the resilience in the financial sector. Interesting timing.
 APRA pretty much says they called it just right, and their tightening has not really impacted overall growth, and any further tightening will be marginal.
First, the changes in lending practices to date do not seem to have had an obvious impact on housing credit flows in aggregate. Total housing lending grew at around 6 per cent in the year to May 2018, which is only marginally below long-run averages and roughly in line with the average run rate since 2011 (covering the period since house prices last went through a period of softening in Australia). Indeed, cumulative credit growth in the roughly three and a half years since APRA stepped up the intensity of its actions was greater than cumulative credit growth in the preceding three and a half years. Credit growth appears to be slowing somewhat at the moment, but that is not surprising in an environment of softening house prices and rising interest rates.
Second, it is evident that the composition of housing credit has shifted notably. Lending to investors is certainly now growing more slowly compared to three or four years ago. But despite the tightening in lending standards – which, it’s important to remember, also apply to owner-occupiers – lending to owner-occupiers grew at a very healthy 8 per cent over the past year. This relatively high rate of rate of growth for owner-occupiers (running broadly at almost 3x household income growth) has been sustained during a period in which lending policies and practices have been gradually strengthened.
Despite the prominence it has been given, our goal in seeking to reinforce standards and practices has been relatively modest: ensuring that internal policies are followed in practice, and applying what is, in most cases, a healthy dose of common sense. This has been an orderly adjustment, and we expect it to continue over time. While there is more “good housekeeping” to do, the heavy lifting on lending standards has largely been done. Any tightening from here on is expected to be at the margin as banks seek to get a better handle on borrower expenses, and better visibility of borrower debt commitments.
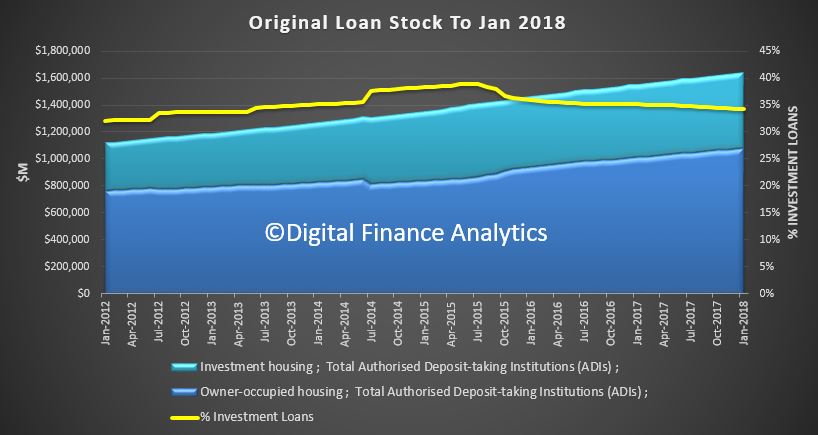
The ABS data shows that total lending stock grew again in May. This is original data split between owner occupied and investment loans.
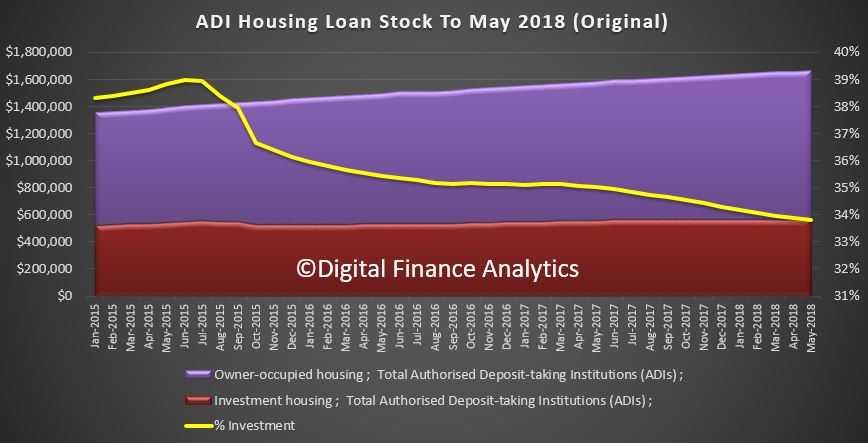 Total housing loan stock rose 0.5% in the month to $1.66 trillion. Within that owner occupied lending rose 0.5% to $1.1 trillion and and investment lending rose just 0.1% to $563 billion. Investment loans fell to be 33.8% of all loans. Overall growth is circa 6% annualised. As for whether growth at 3 times income is “healthy” to quote Wayne Byers; well that’s another story. Remember debt has to be repaid, eventually.
Growth has been strongest in owner occupied lending, but investment lending was also higher.
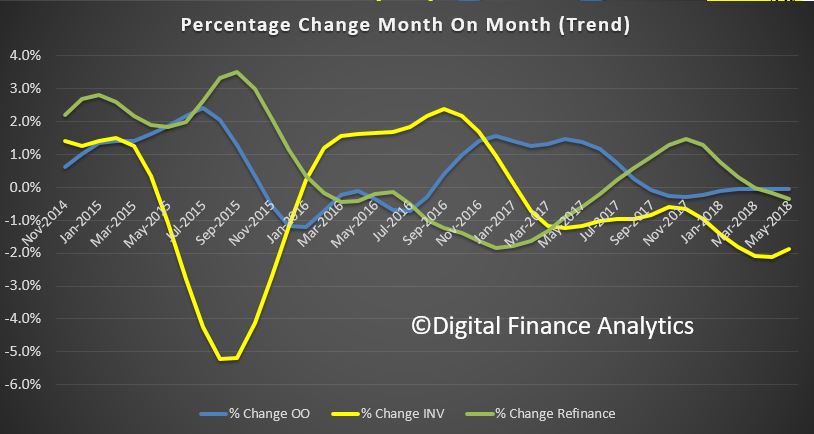
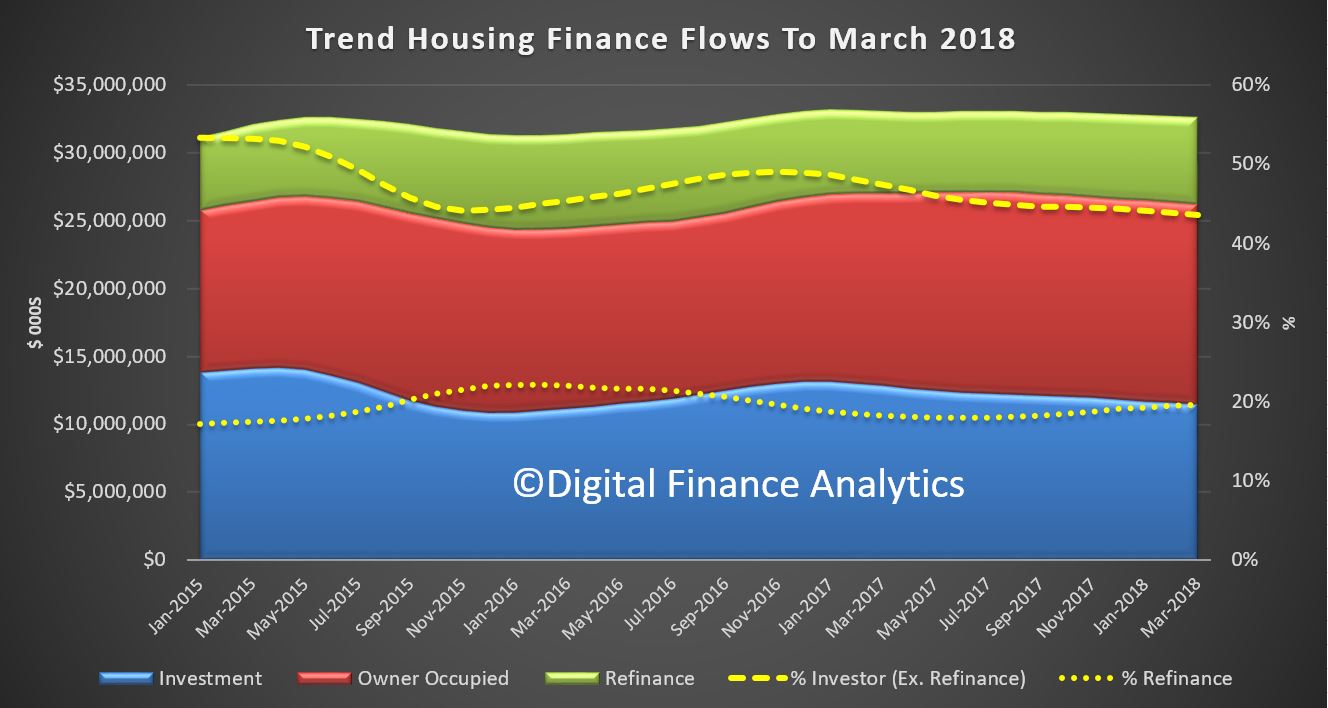
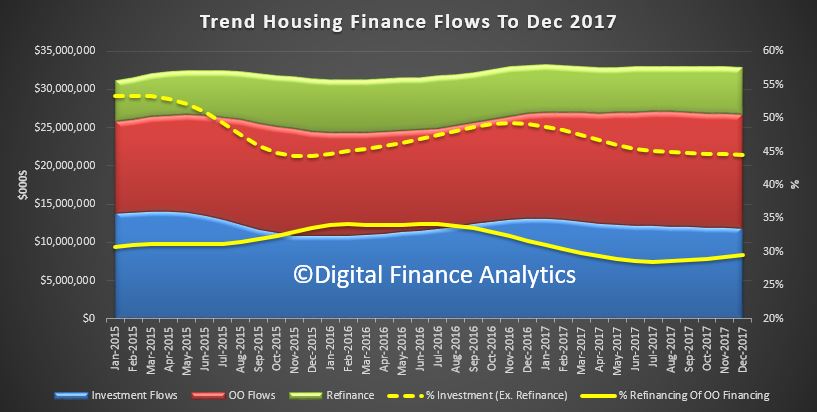
 The trend housing flows were down month on month with a fall of 0.1% in owner occupied lending to $14.7 billion and investment lending down 1.9% to $10.7 billion. There was$6.3 billion of refinancing, a drop of 0.4%. 42% of lending was for investment purposes (excluding refinancing) and 19.9% of lending was refinancing, this proportion rose a little.
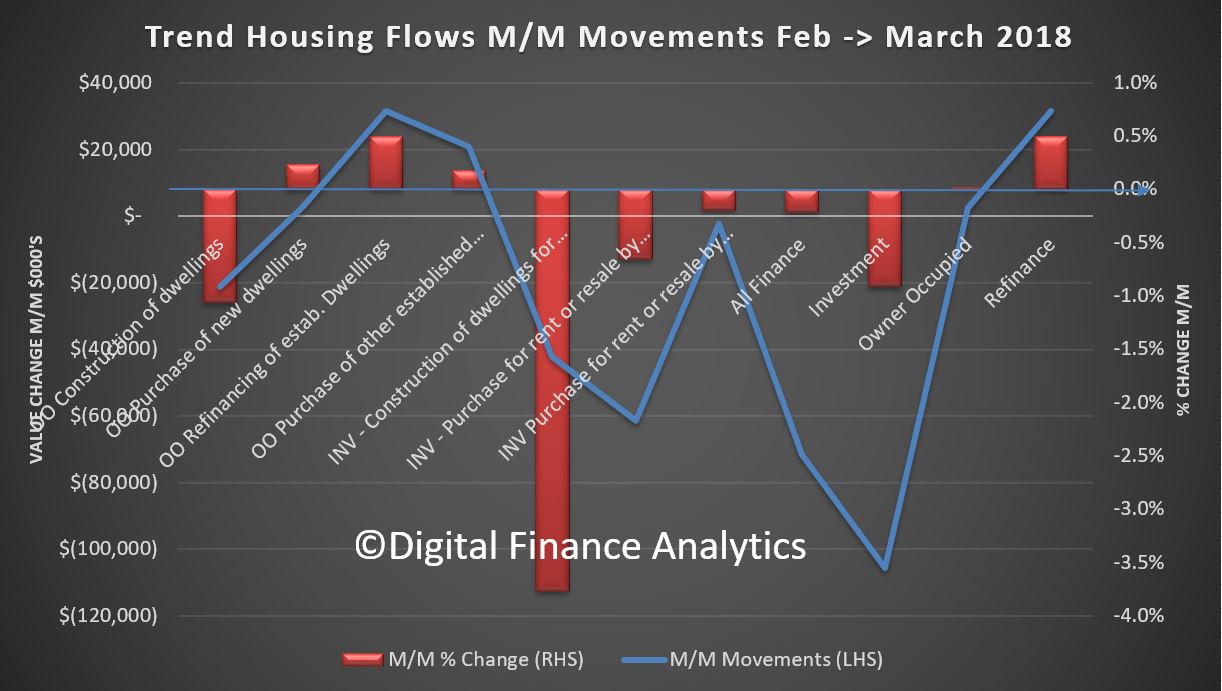
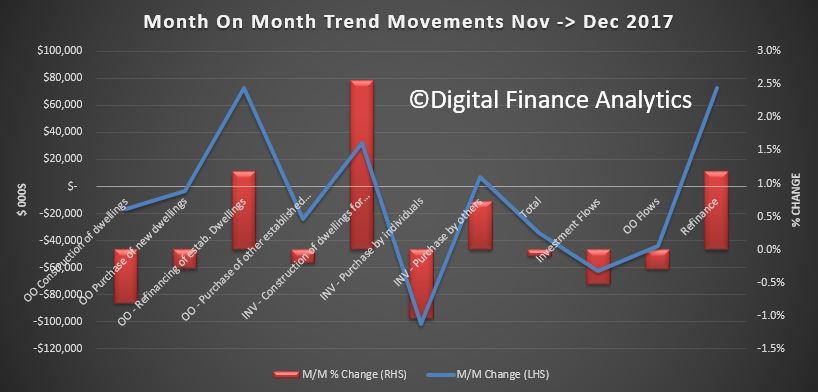
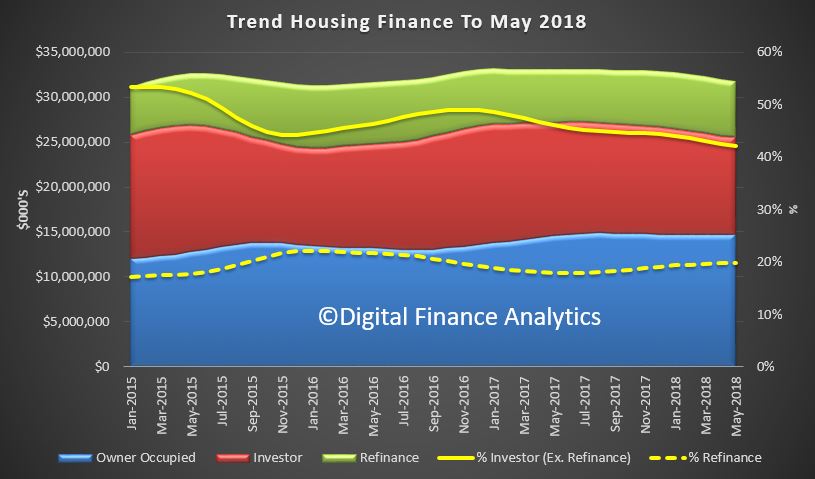 Looking in more detail at the trend movements by category, only owner occupied purchase of established dwellings rose, all other categories fell back. Investor lending continued to slide on a relative basis.
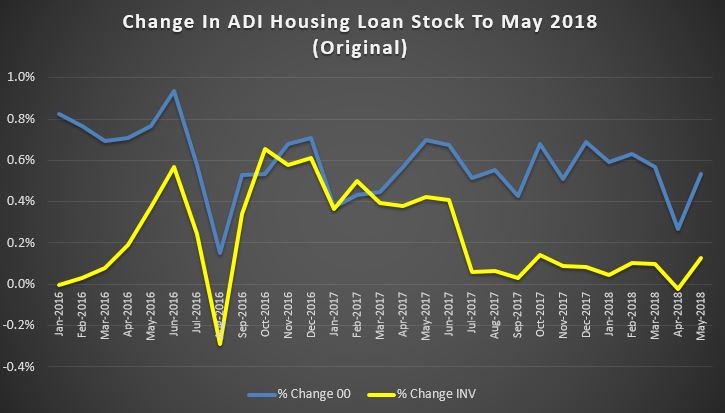
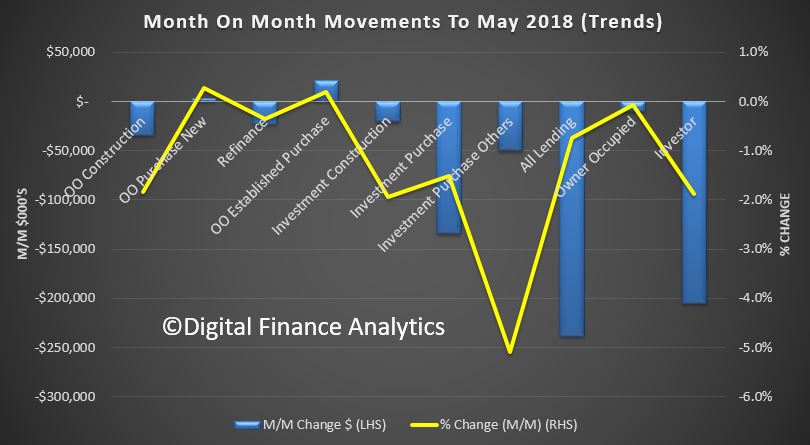 The month on month changes show the movements, and we note a slower rate of decline in investor lending.
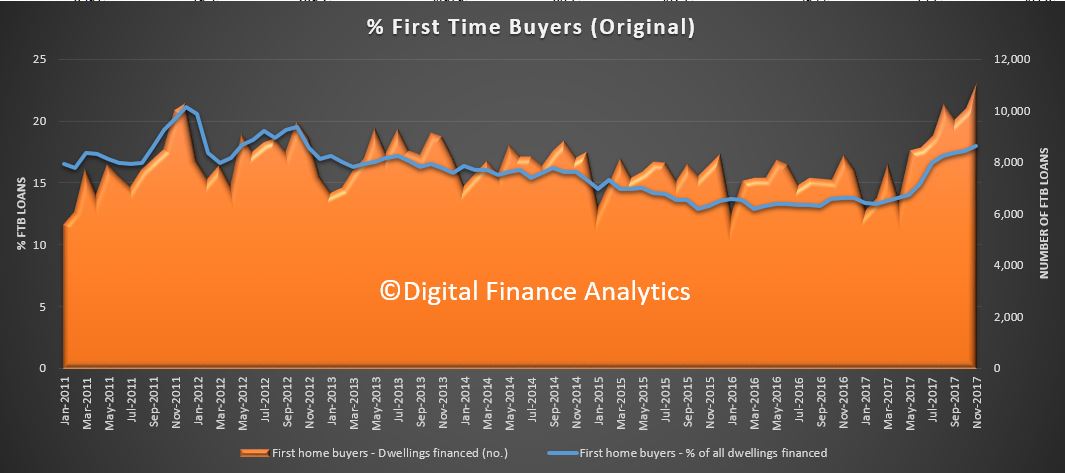
 First time buyers continue to support the market, with a 17.6% share of all loans written but a significant rise in the absolute number of first time loans written (up 20.5% on last months) as well as a rise in non first time buyer borrowers. These are original numbers, so they do move around from month to month, and does reflect the incentives for first time buyers in some states.
![]() The number of investor first time buyers continues to fall.
The number of investor first time buyers continues to fall.
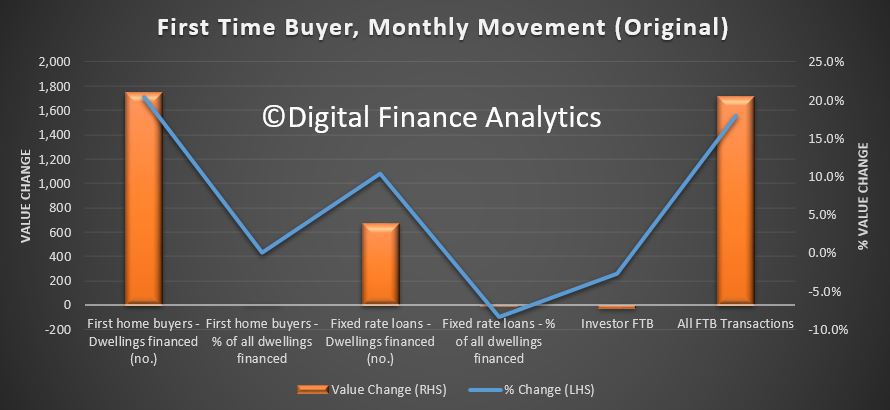
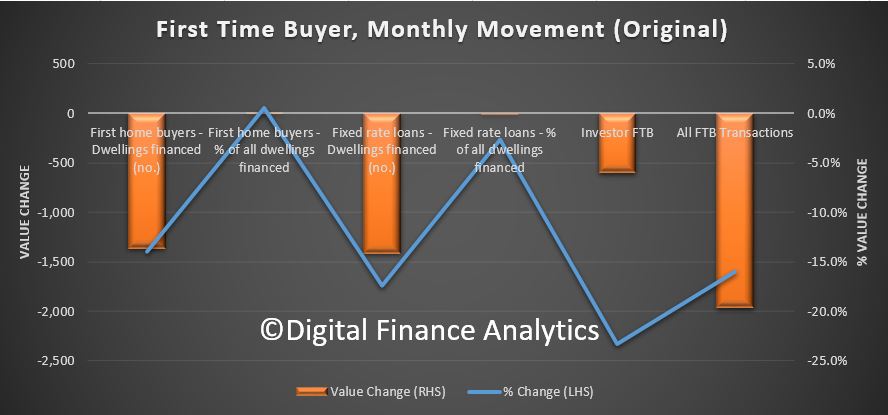
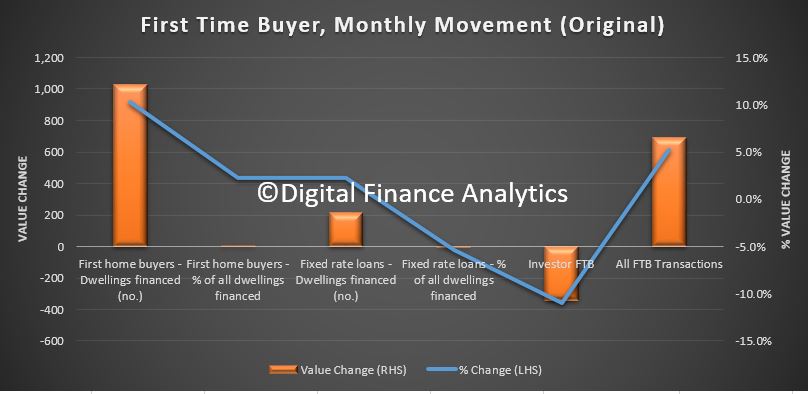
![]() The month on month movements show the additional 1,750 buyers in the month. Worth noting also that the average loan size continues to grow, at $412,000 for non-first time buyers, up 0.4% on the previous month and $344,000 for a first time buyer, up 0.5%. There are some variations across the states, but I won’t include those here. There was also a further fall in the number of fixed rate loans being written, down to 12.1% from 13.2% last month.
The month on month movements show the additional 1,750 buyers in the month. Worth noting also that the average loan size continues to grow, at $412,000 for non-first time buyers, up 0.4% on the previous month and $344,000 for a first time buyer, up 0.5%. There are some variations across the states, but I won’t include those here. There was also a further fall in the number of fixed rate loans being written, down to 12.1% from 13.2% last month.
 To me this begs the question, if credit is still running at these levels, and APRA says the tightening is all but done, will we see home prices starting to trend higher? Clearly the plan is to keep the debt bomb ticking for yet longer.
But this may well mean the RBA will lift rates sooner than I expected.
On 1 July, legislation in Denmark took effect that will trigger the inaugural issuance of Danish public housing covered bonds (almene realkreditobligationer) as a new asset class, says Moody’s.

These new covered bonds will be issued out of newly established capital centres with the sole purpose of funding mortgage loans granted to public housing companies (almen boligforening). As is the practice in the Danish covered bond market, assets serving as security for covered bonds must be segregated into independent cover pools, referred to as capital centres in mortgage banks. The Danish government guarantees in full the mortgage loans as well as the public housing covered bonds.
The law is credit positive for potential investors in public housing covered bonds because their credit risk will be lower than in existing mortgage covered bonds. Although investors in both types of covered bonds benefit from recourse to the issuing mortgage bank and a pool of good quality mortgage assets, only public housing covered bonds benefit from a state guarantee in case the issuer fails to fulfil its obligations.
Today, public housing loans benefit from a municipality’s partial guarantee of the loan, but under the new framework such loans will benefit from the federal government’s guarantee covering the full loan amount. In 2017, Danish municipalities guaranteed on average the most risky 62% of mortgage loans. Under the new model, the government will charge a guarantee commission from the mortgage banks. The mortgage banks, owing to the government’s full guarantee, will have lower capital requirements and lower over- collateralisation requirements for the covered bonds that are set in Denmark at 8% of risk-weighted assets.
Denmark’s public housing covered bonds will be issued by mortgage banks via frequently held auctions and tap sales. For the issuance of public housing covered bonds, banks shall obtain bids for purchases from Denmark’s central bank on behalf of the Danish government before the bonds are sold to others, which reduces funding execution risk for the public housing companies and the mortgage banks. According to the Danish central bank, the government will purchase DKK42.5 billion of public-sector covered bonds in 2018, corresponding to the total of new loans and refinancings of existing loans. The government will bid at a rate corresponding to the yield on government bonds.
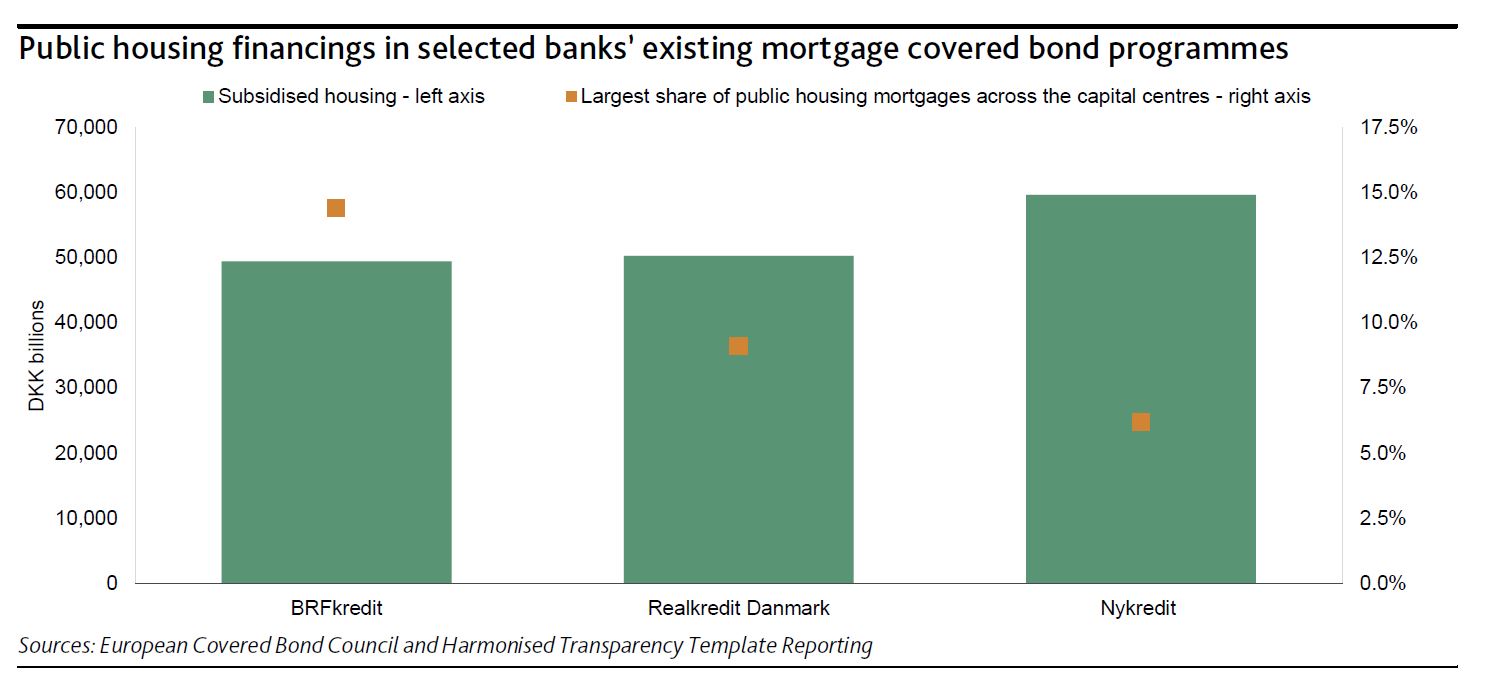
We expect a quick migration of public housing loans to the newly established capital centres in order to benefit from the government guarantees. This will lead to an increased level of prepayments and refinancings in the existing capital centres. The public housing sector has subsidised loans totalling around DKK180 billion that are largely financed by existing capital centres that issue mortgage covered bonds.
Nykredit Realkredit A/S, Realkredit Danmark A/S (part of Danske Bank) and BRFkredit A/S (part of Jyske Bank) are active lenders in this sector, each currently lending DKK50-DKK60 billion to the public housing sector. Despite the public housing loans being refinanced into the new capital centres, the risk characteristics of the capital centres will not change materially because the share of public housing loans is often small and in active capital centres does not exceed 15% as shown in the exhibit.
The ABS released the latest housing finance statistics to April 2018. They confirm the macro trends we already reported. Lending volume flows are solidly down, and the trends suggest more in the months ahead. We are entering a new phase in the credit cycle, and this will put further pressure on home prices.
The total number of first time buyer loans in the month fell by 8%, from the previous month, down, 740.
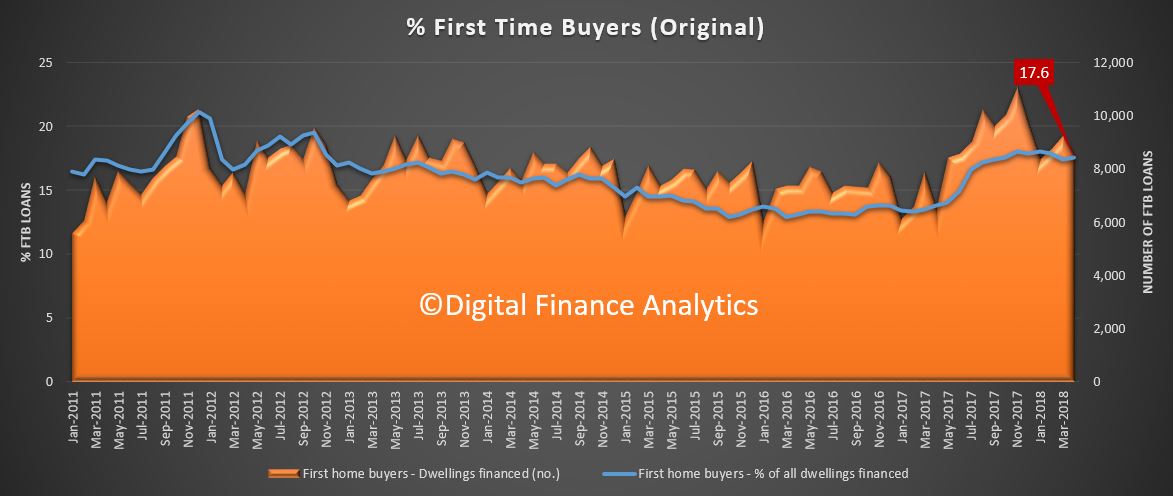 These are original numbers, so they move around, but this is the lowest volume since January. And the volume was equivalent to 17.6% of all buyers, up from 17.4% last month. The number of fixed rate loans also fell.
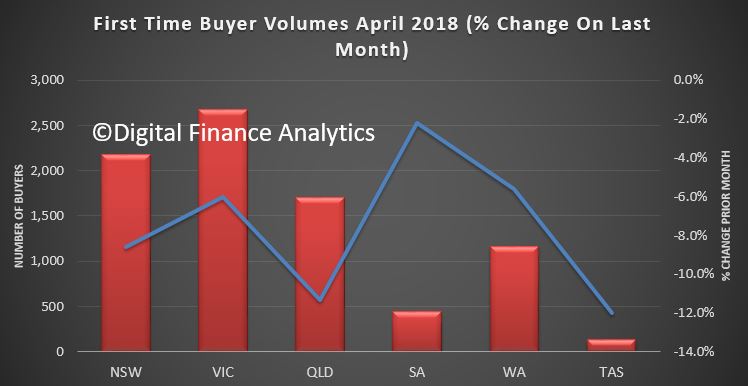
 A fall in number of first time buyers registered across all states, with the largest number in Victoria, at 2,677, down 6% on the prior month, New South Wales was down 8.6% and Queensland was down 11.3%. So this suggests that the first time buyer incentives are running out of puff.
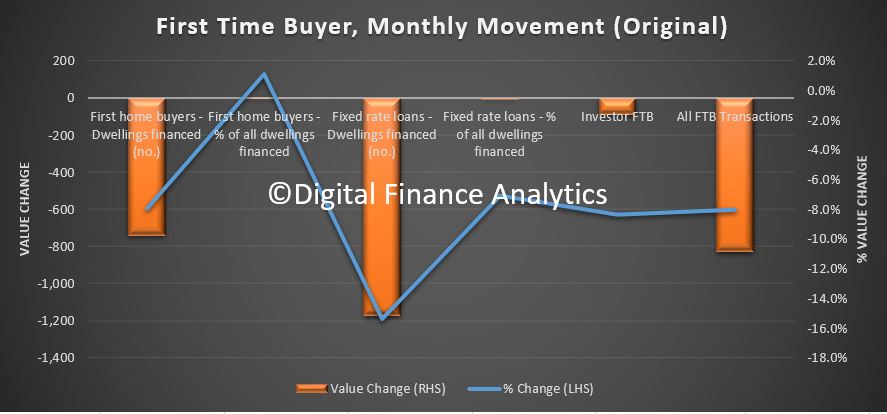
 The number of investor first time buyers also fell and when we overlay this onto the overall first time buyer trends we see a significant drop in flows from a couple of months back. So first time buyers are not going to keep the market up!
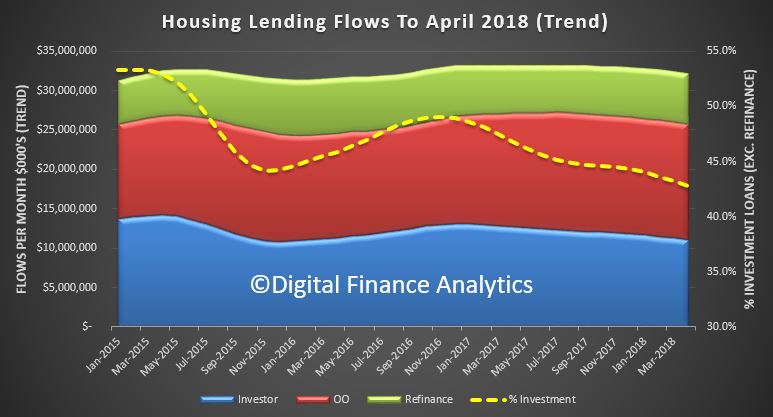
![]() Turning to the overall lending flows, and looking at the trends, we see a fall in pretty much all categories. The proportion of investor loans also fell, down to 42.8 percent of loans approved, excluding refinancing of existing loans, compared with a high of 53% in 2014.
Turning to the overall lending flows, and looking at the trends, we see a fall in pretty much all categories. The proportion of investor loans also fell, down to 42.8 percent of loans approved, excluding refinancing of existing loans, compared with a high of 53% in 2014.
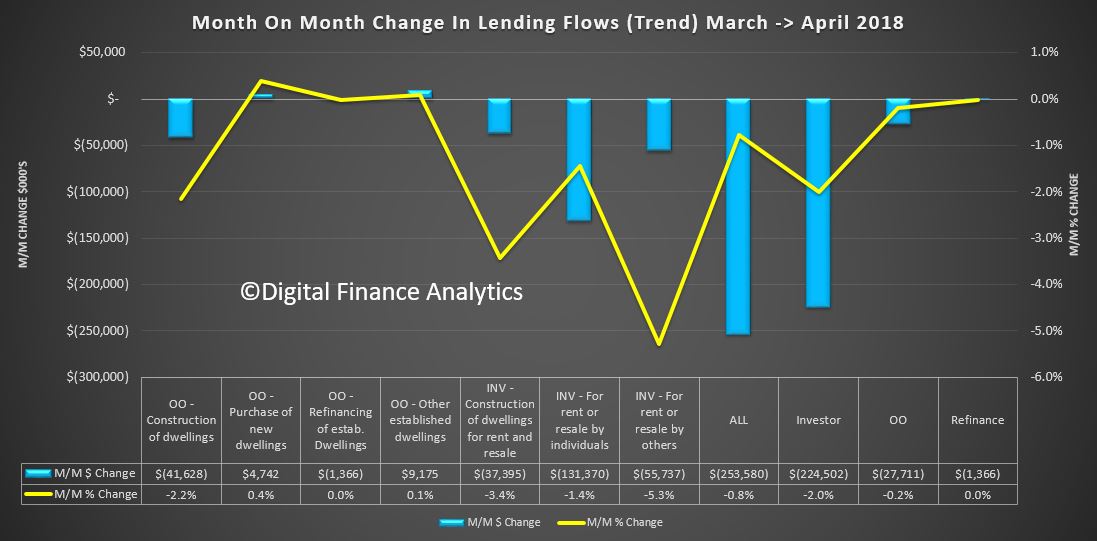
 Across the individual categories, owner occupied lending for construction fell 2.2%, down $41 million, and refinancing of existing dwellings was down just $1 million. However, the purchase of new owner occupied homes rose 0.4% to $4.7 million and the purchase of established dwellings was up 0.1% to $9 million.
On the investment side of the house lending for investment construction fell 3.4% down $37 million while borrowing by individual investors fell 1.4% or $131 million and other investors (such as super funds) fell 5.3%, down $55 million. Overall then investor flows were down 2%, or $224 million and owner occupied lending was down 0.2% or $27 million.
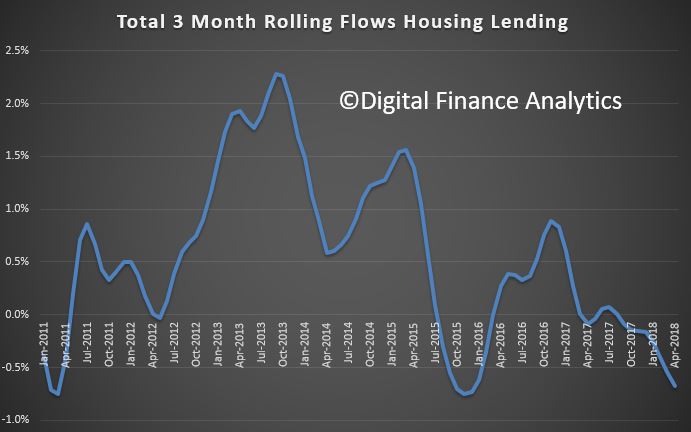
The overall trends are down, as the rolling three month shows, and the trajectory appears lower ahead.
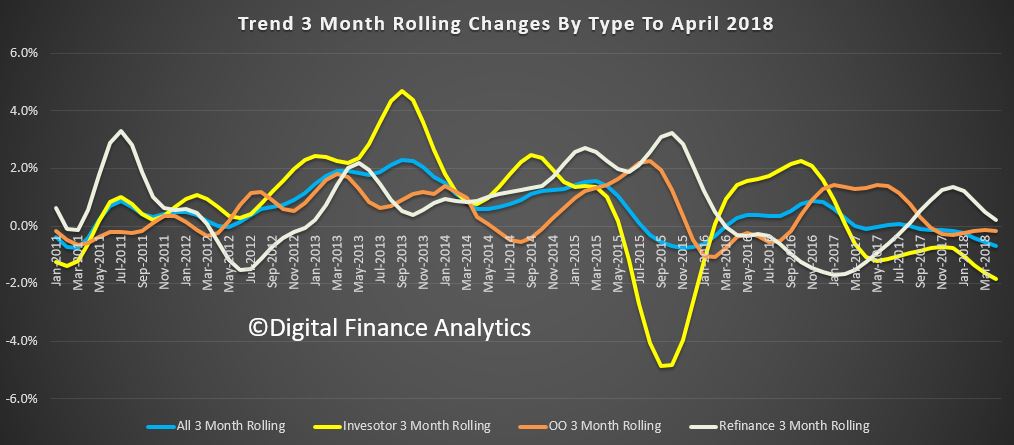
The longer term rolling trend also shows the momentum ebbing, with investor lending flows leading the way down, and refinance also slowing. Note these are based on the trend data which irons out the bumps.
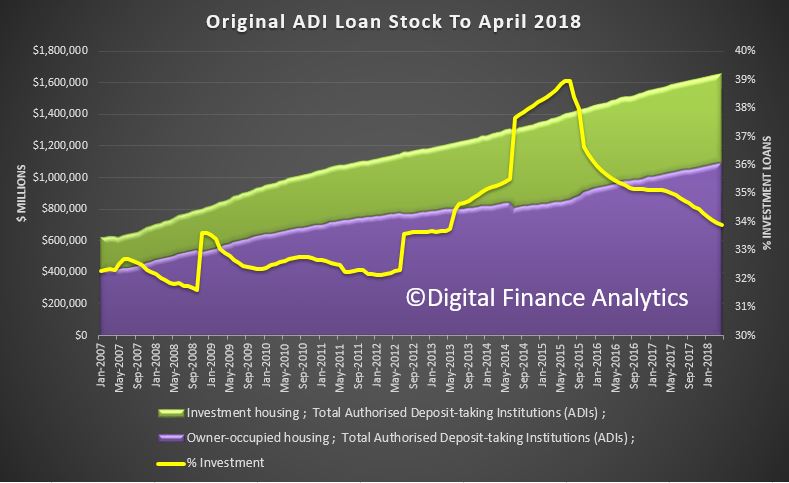
 Finally, the original stock data rose by $2.8 billion, or 0.17%, to $1.66 trillion. Within that owner occupied stock rose by 0.27% or 2.9 billion to 1.09 trillion, and investment lending stock fell by $123 million to $562 billion. Investment lending therefore fell to 33.9% of stock, the lowest since 2012.
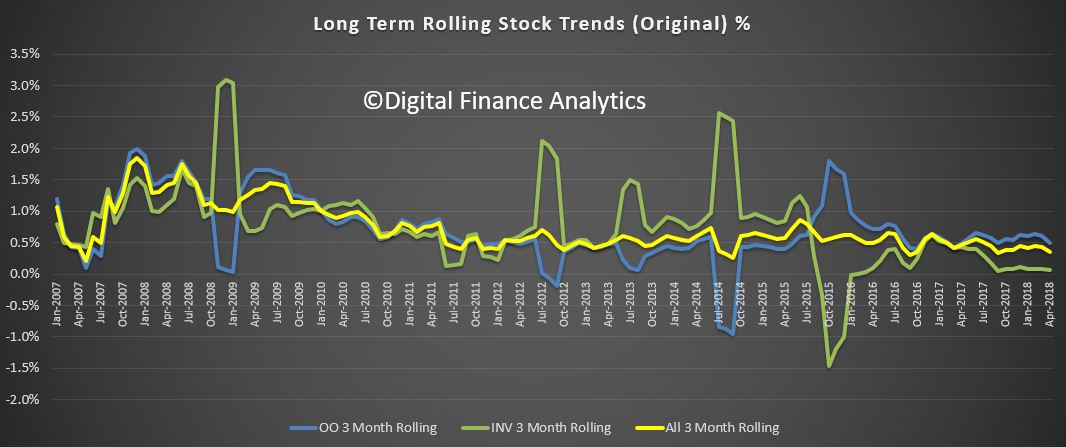
The long term trend tells the story, we are moving into uncharted lending territory, as volumes fall, and this suggests that unlike the large mini clamp-down on mortgage lending in 2016, which lasted just a few months before recovering firmly, the various conditions in the lending market are going to dampen growth further.
 What we do not have is picture of the non-bank sector, which we suspect is picking up some of the slack. Another problem with the myopic data the authorities choose to release.
But the bottom line is there will further contractions in lending in the months ahead, as lending standards get ever tighter, and this will translate into lower home prices ahead.
The real estate boom is firmly over.
The ABS released their housing finance data today to March 2018. The trends are pretty clear, lending is slowing, and bearing in mind our thesis that lending and home prices are inextricably linked, this signals further home price falls ahead, which will be exacerbated by even tighter lending standards we think are coming. Debt is still rising faster than inflation or wages.
Starting with the original first time buyer data we see a rise in volumes, reflecting the incentives in NSW and VIC. On a rolling average basis, volumes are strongest in VIC.
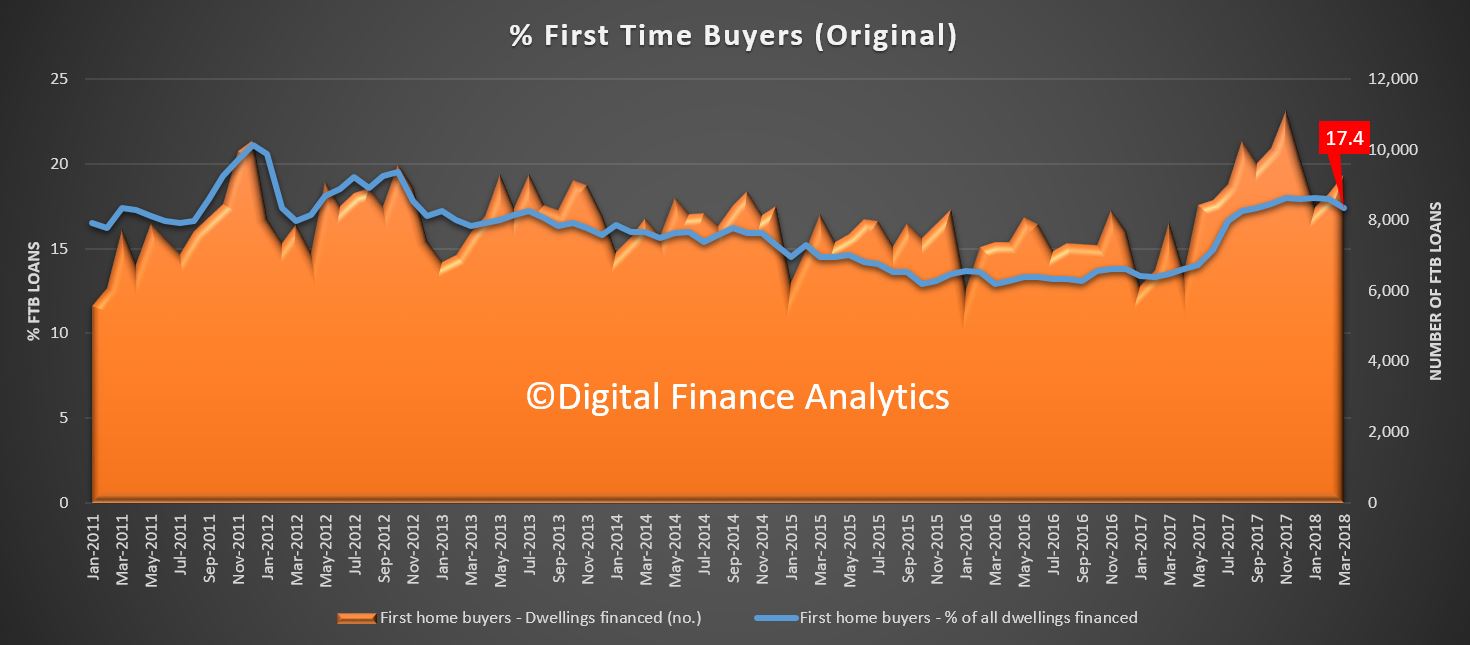
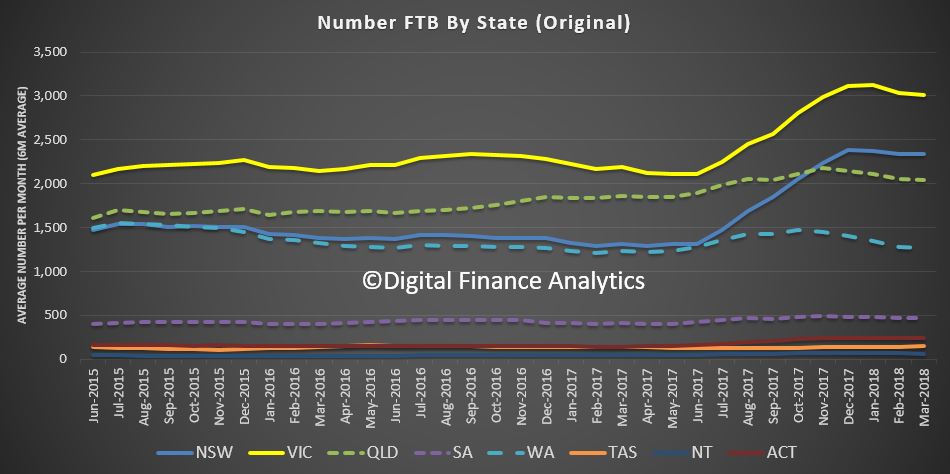 Overall volumes were 17.4% of new loans written compared with 17.9% in February, which is a little higher than 2016, but is appears to be drifting lower now, suggesting that ahead volumes of new loans may fall a little.
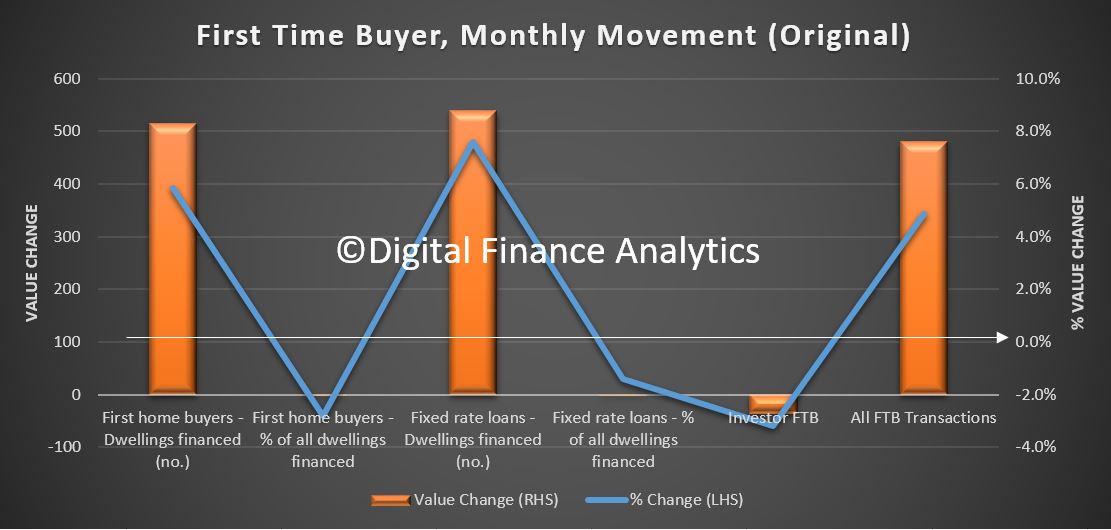
 Looking at the FTB month on month movements, we see a 5.9% uplift in flows which equates to an extra 515 loans last month. The average loan size rose by 2.3% to$335,400.
 Looking at our overall first time buyer tracker, we see a fall in overall volumes, as the number of first time buyer investors falls away, as captured in our household surveys.
![]() Turning to the 12 month rolling trend, we see that both owner occupied and investor loan flows are slowing, with investor lending shrinking faster.
Turning to the 12 month rolling trend, we see that both owner occupied and investor loan flows are slowing, with investor lending shrinking faster.
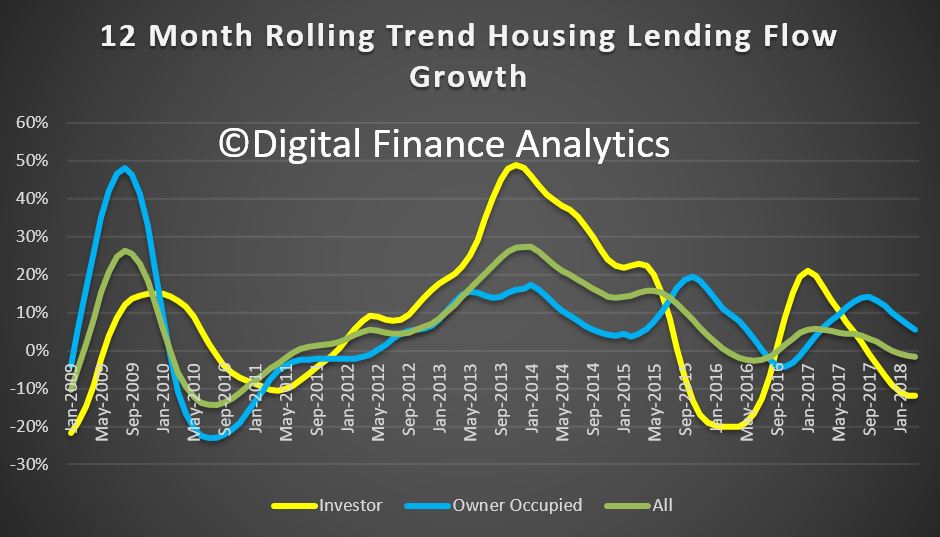 The proportion of investor loan flows slid again (excluding refinance) to 43.6%.
 Looking in more details at the moving parts, in trend terms, lending for owner occupied construction fell 1.1%, owner occupied purchase of new dwellings fell 0.2%, and purchase of other established dwellings rose 0.2%. So overall, owner occupied lending flows, excluding refinance, were flat at $14.8 billion.
Refinance of existing owner occupied loans rose by 0.5% to $6.4 billion, and on the investor side, construction of new property for investment purposes fell 3.8%, purchase of existing property for investment purposes fell 0.7% and purchase of existing property for investment by other entities (e.g. super funds) fell 0.2%. So overall investment flows fell 0.9% to $11.5 billion.
Finally, the total of all finance trend fell overall 0.2% to 32.7 billion.
 And in original terms, the stock of all housing loans rose $6.7 billion, or 0.4% in the month, which equates to 4.9% annualised, still well above inflation or wages growth which is at 2%.
 So, the overall growth of lending for housing is still sufficient to lift household debt even higher. So far from losing lending controls, regulators should be seeking to tighten further. There is no justification for growth above inflation or wages, because stronger momentum will only lift the burden on households even further, and inflate the banks’ balance sheets, which flatters their performance.
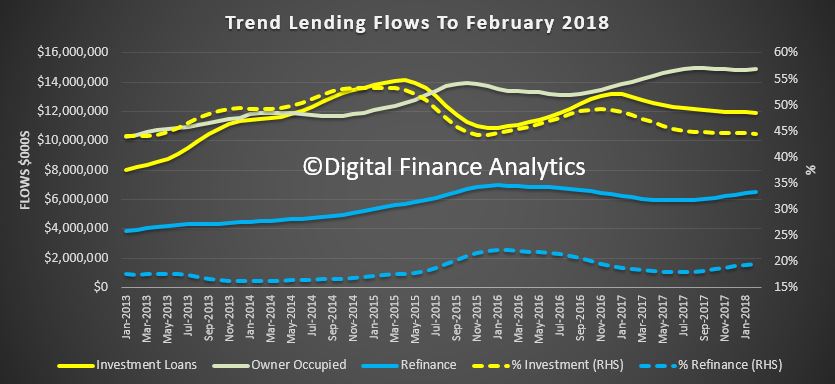
The ABS released their February 2018 housing finance data today. Where possible we track the trend data series, as it irons out some of the bumps along the way.
The flow of investment loans was worth $11.9 billion and down 0.2% from last month. Owner occupied loans rose 0.1% to $17.1 billion, while refinancing of existing loans rose 1.1% to $6.4 billion. So investment loans comprise 44.5% of loans, excluding refinanced, while refinanced loans were 19.5% of owner occupied loans.
 Looking at the individual moving parts, we see owner occupied construction loans flows rose 0.2% by $4.6 million to 2.0 billion, and owner occupied purchase of new dwellings was down 0.1% to $1.2 billion. The purchase of other owner occupied dwellings was up 0.1% by $13.3 million to $11.6 billion. On the investment side of the ledger, investment construction fell 0.9%, down $11 million to $1.2 billion, while purchases by individuals for investment purposes down 0.6% or $60 million to $9.5 billion and purchases by other entities, for example super funds, rose 4% of $47 million to $1.2 billion.
 Looking at the original first time buyer data, there was a small fall this past month, to 17.9% of all loans as the volume of non first time buyers rose faster. However the upward move was a small one, and it appears the benefit of the new first time buyer incentives have abated. Tighter lending standards probably play in here also.
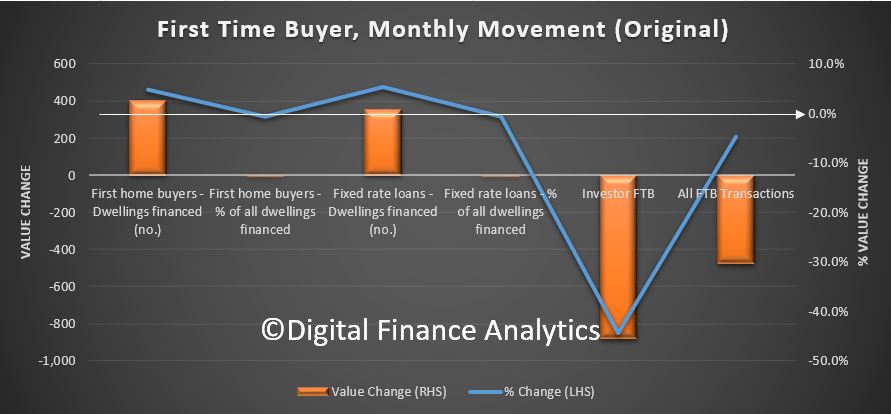
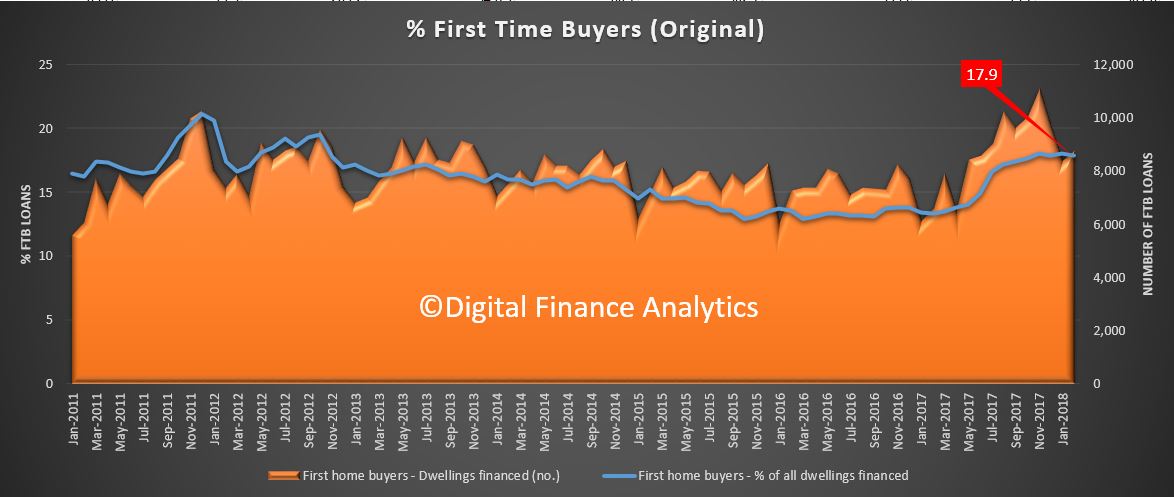 Here are the individual moving parts. There was a rise of 403 buyers, to 8,892, up 4.8%, compared to a 5.9% rise in non-first time buyer loans. The average loan size fell by 2.1%.
 Using our survey data we also track first time buyers going to the investment market directly. We saw a further fall in momentum here as interest in investor loans wains.
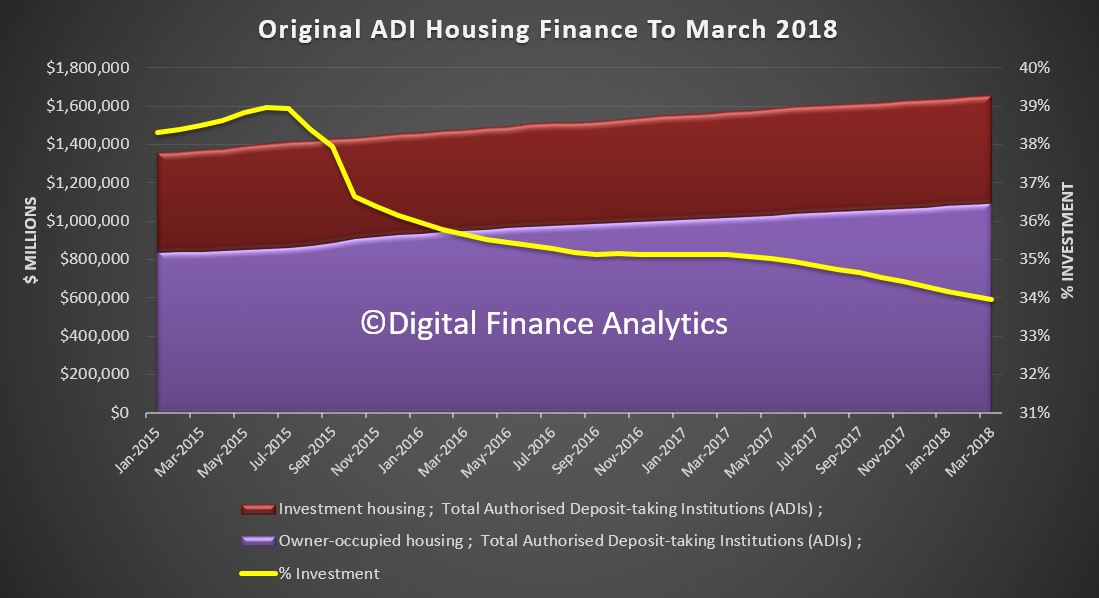
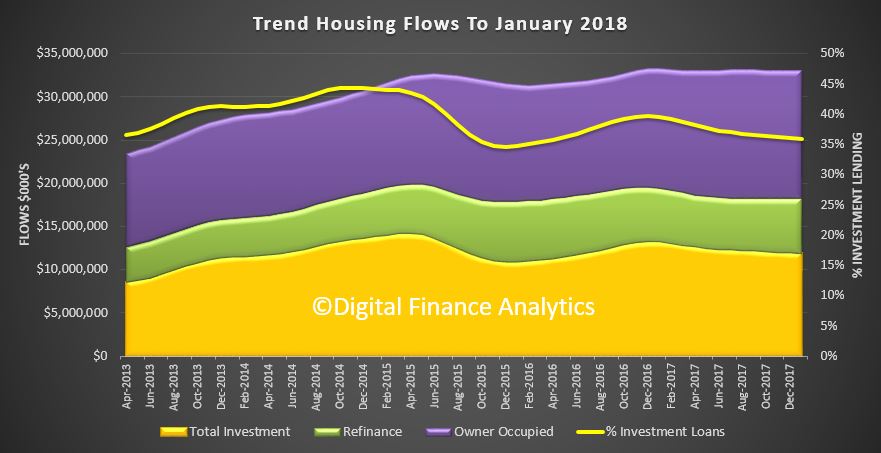
![]() Finally, the original loan stock data for banks (ADIs) shows that the share of investor loans fell to 34.1%, and was up by $590 million or 1.11% to $562 billion. Owner Occupied stock rose 0.63%, up $6.8 billion to $1.08 trillion.
Finally, the original loan stock data for banks (ADIs) shows that the share of investor loans fell to 34.1%, and was up by $590 million or 1.11% to $562 billion. Owner Occupied stock rose 0.63%, up $6.8 billion to $1.08 trillion.
 So the bottom line is investor as still active but at a slower rate. Some are suggesting there is evidence of stabilisation, but we do not see that in our surveys.
Owner occupied loans, especially refinancing is growing quite fast – as lenders seek out lower risk refinance customers with attractive rates. First time buyers remain active, but comprise a small proportion of new loans as the effect of first owner grants pass, and lending standards tighten.
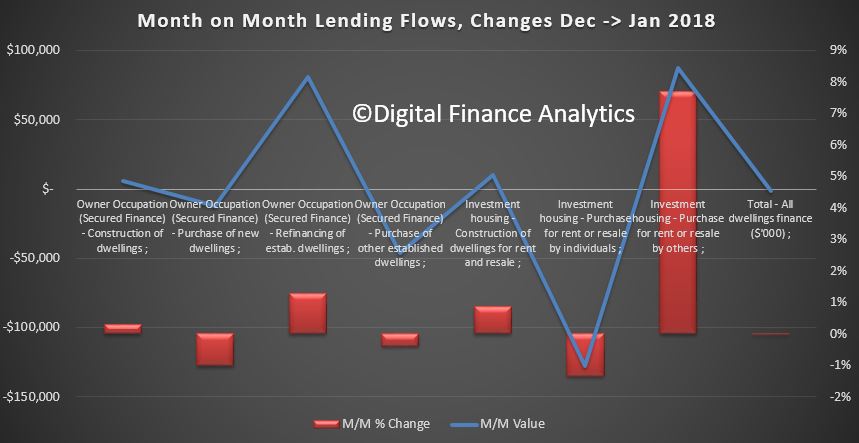
The ABS released the housing finance data today. The trend estimate for the total value of dwelling finance commitments excluding alterations and additions was unchanged. Owner occupied housing commitments rose 0.1% while investment housing commitments fell 0.3%. The proportion of first time buyers rose to 18%, but the absolute number of loans was significantly lower.
The proportion of investment loans fell again but still sit above 35%.
 There were small rises in refinancing and investment loans for entities other than individuals. The number of commitments for owner occupied housing finance fell 0.7% in January 2018. In trend terms, the number of commitments for the purchase of new dwellings fell 1.4%, the number of commitments for the purchase of established dwellings fell 0.7% and the number of commitments for the construction of dwellings was flat.
 The overall stock, in original terms rose 0.3% in the month, and growth continues to slow.
 In original terms, the number of first home buyer commitments as a percentage of total owner occupied housing finance commitments rose to 18.0% in January 2018 from 17.9% in December 2017. The absolute number of first time buyers fell, thanks mainly to falls of 22.3% in NSW and of 13.3% in VIC.
 Here are the movements month on month.
 The DFA FTB tracker, which overlays owner occupied loans from the ABS with first time investment loans from the DFA surveys, shows a significant. fall.
![]()
The ABS warns that the number of first home buyer commitments as a percentage of total owner occupied housing finance commitments recorded strong growth from July 2017 to November 2017. The increase has been driven mainly by changes to first home buyer incentive programs in New South Wales and Victoria. The ABS is working with APRA and the financial institutions to establish the size of the increase in first home buyer lending and improve the quality of first home buyer statistics more broadly. These numbers may be revised and users should take care when interpreting ABS first home buyer statistics.
The ABS released their housing finance data today for December 2017. Weirdly, lending flows were down in trend terms, but stock was up in original terms.
In trend terms, the total value of dwelling finance commitments excluding alterations and additions fell 0.1% or $31 million. Owner occupied housing commitments rose 0.1% while investment housing commitments fell 0.5%.
 Owner occupied flows were worth $14.8 billion, and down 0.3% last month, while owner occupied refinancing was was $6.2 billion, up 1.2% or $73 million. Investment flows were worth 11.9 billion, and fell 0.5% or $62 million. The percentage of loans for investment, excluding refinancing was 45%, down from 49% in Dec 2016. Refinancing was 29.5% of OO transactions, up from 29.2% last month.
 The number of commitments for owner occupied housing finance fell 0.3% in December 2017.
The number of commitments for the construction of dwellings fell 0.8%, the number of commitments for the purchase of established dwellings fell 0.3% and the number of commitments for the purchase of new dwellings fell 0.1%.
Momentum fell in NSW and VIC, the two major states.
 In original terms, the number of first home buyer commitments as a percentage of total owner occupied housing finance commitments fell to 17.9% in December 2017 from 18.0% in November 2017.
 The number of transactions fell by 1,300 compared with last month. The proportion of fixed rate loans also fell.
 We also saw a fall in first time buyer investors, from our own surveys.
![]() In original terms the stock of housing loans with ADI’s rose 0.5% in the month to $1.68 trillion. 34.3% of loans are for property investment purposes.
In original terms the stock of housing loans with ADI’s rose 0.5% in the month to $1.68 trillion. 34.3% of loans are for property investment purposes.
The ABS pointed out that the First Time Buyer data is under review, and new housing datasets are on their way.
The number of loans to first home buyers has recorded strong growth in recent months. The increase has been driven mainly by changes to first home buyer incentives made in July by the New South Wales and Victorian governments. The ABS is working with APRA and the financial institutions to establish the size of the increase in first home buyer lending in recent months and improve the quality of first home buyer statistics more broadly. These numbers may be revised and users should take care when interpreting recent ABS first home buyer statistics.
FORTHCOMING CHANGES
A new publication will soon be released which will see Housing Finance, Australia (5609.0) and Lending Finance, Australia (5671.0) combined into a single, simpler publication called Lending to Households and Businesses, Australia (5601.0).
To enable users to prepare for the new publication, tables of data in the new publication format will be released no less than one month prior to the first release of Lending to Households and Businesses, Australia (5601.0).
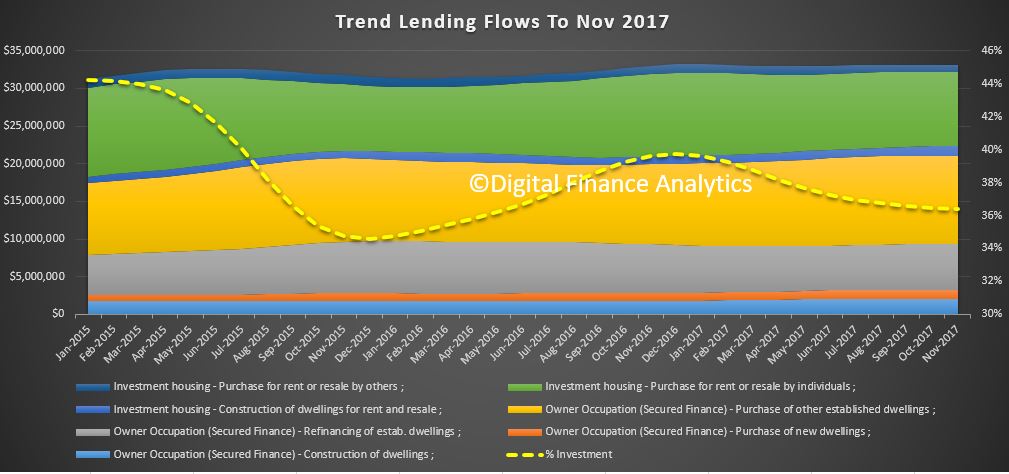
The ABS released their housing finance series for November today. In essence, there was a small rise (0.1%) in overall lending flows, in the smoothed trend series, with around $33 billion of loans written in the month. Total ADI housing loans stood at $1.63 trillion, in original terms. But the percentage changes fell in NSW 0.2% and 1.4% in WA. Lending rose in VIC, up 0.6% and SA, 0.3%. The original series showed a much stronger result, up 11.4% (but this is a volatile series).
We do not think the data gives any support for the notion that regulators should loosen the lending rules, as some are suggesting. That said the “incentives” for first time buyers are having an effect – in essence, persuading people to buy in at the top, even as prices slide. I think people should be really careful, as the increased incentives are there to try and keep the balloon in the air for longer.
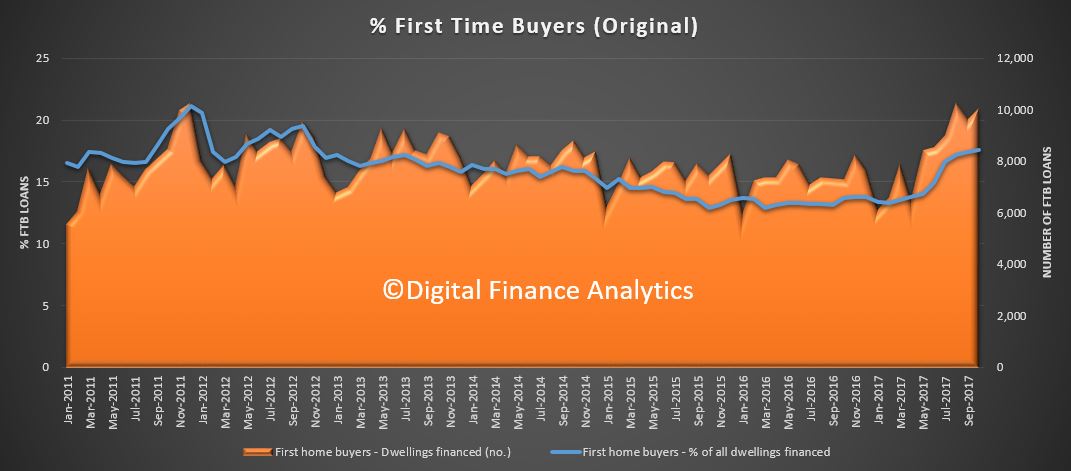
 A highlight was the rise in first time buyer owner occupied loans, up by around 1,030 on the prior month, as buyers reacted to the incentives available, and attractor rates. This equates to 18% of all transactions. Non-first time buyers fell 0.5%. The average first time buyer loan rose again to $327,000, up 1% from last month. The proportion of fixed rate loans fell, down 5.4% to 15.8% of loans.
 We saw a fall in first time buyer investors entering the market, thanks to tighter lending restrictions, and waning investor appetite. This will continue.
 Overall, first time buyers are more active (though still well below the share of a few years ago).
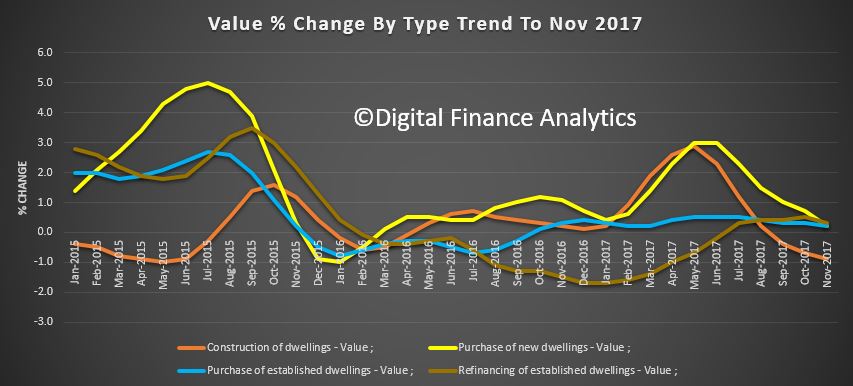
![]() Looking more broadly across the portfolio, trend purchase of new dwellings rose 0.2%, refinance rose 0.3%, established dwellings 0.2%, all offset by a 0.9% drop in the value of construction. The indicators are for a smaller number of new starts (despite recent higher approvals). We are concerned about apartment construction in Brisbane and Melbourne.
Looking more broadly across the portfolio, trend purchase of new dwellings rose 0.2%, refinance rose 0.3%, established dwellings 0.2%, all offset by a 0.9% drop in the value of construction. The indicators are for a smaller number of new starts (despite recent higher approvals). We are concerned about apartment construction in Brisbane and Melbourne.
 The share of investor loans continues to drift lower, but is still very high at around 36.4% of all loans written, but down from 44% in 2015. In fact the total value of finance, in trend terms was just $16m lower compared with last month.
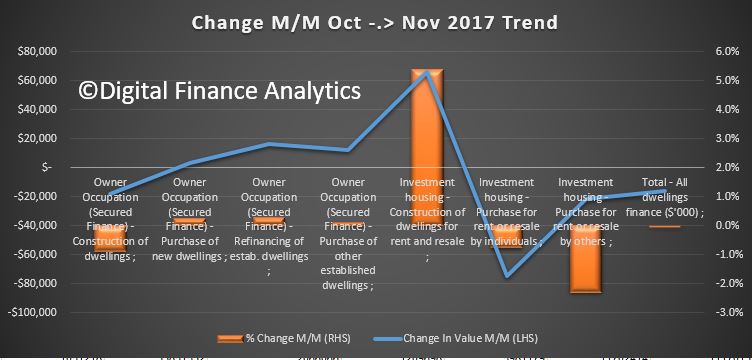
The monthly movements show a rise of 5.44% in loans for investment construction ($65m), Refinance 0.3% ($16m), Purchase of new dwellings up 0.2% ($3m) but a fall of $17m (down 0.9%) for construction of dwellings. Purchase of existing property for investment fell $74m, down 0.8% and for other landlords were down 2.3% of of $21m. The overall trend movement was down $16m. In comparison the original flow was up more than $3bn or 11%.
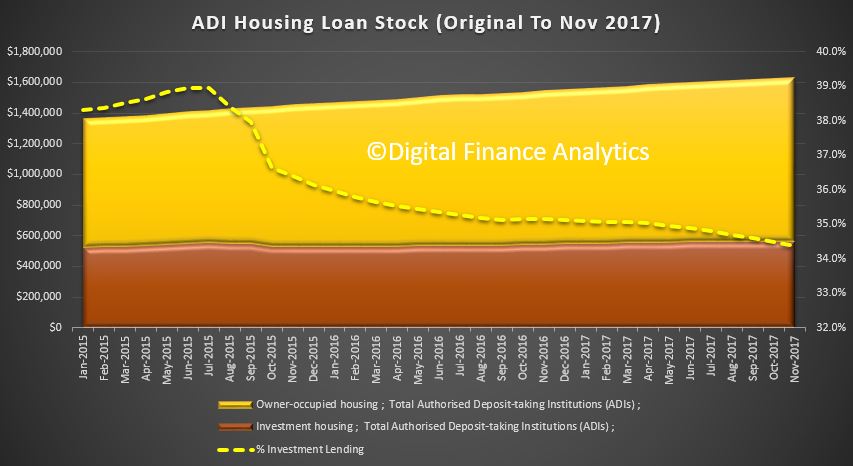
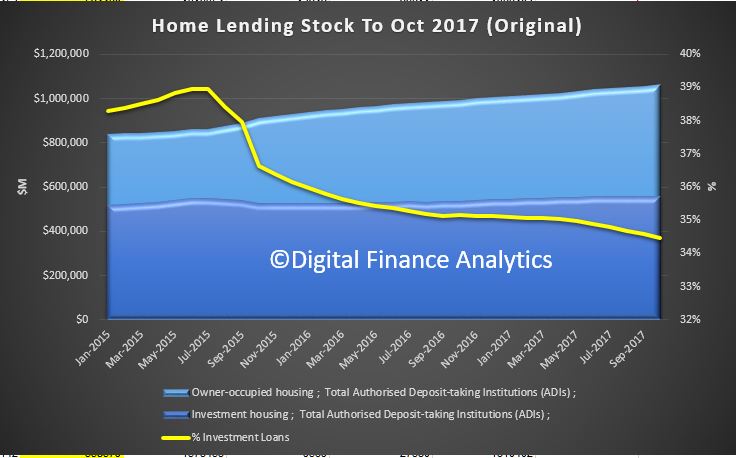
 Looking at the original loan stock data, the share of investment loans slipped again to 34.4%, so we are seeing a small fall, but still too high. Investment loans rose 0.10% or $527 million, while owner occupied loans rose $5.5 billion.or 0.52%. Relatively Building Societies lost share.
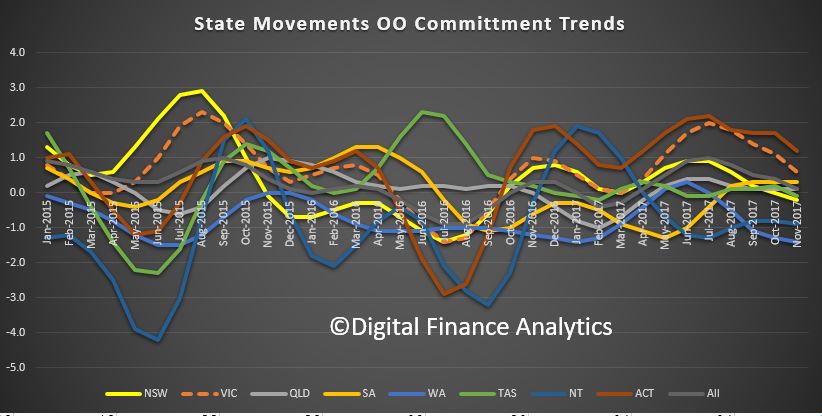
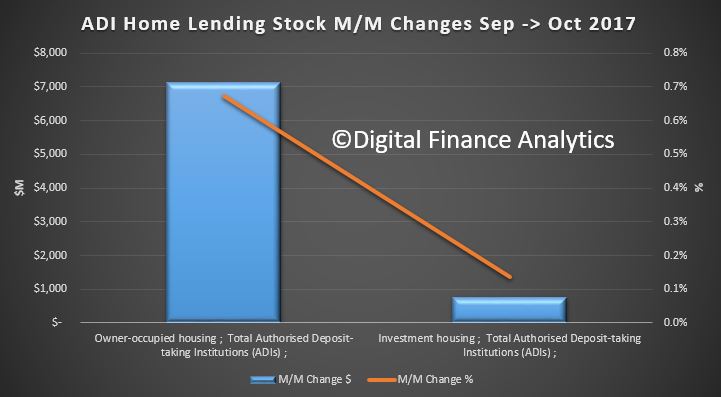
The ABS released their housing finance data to October 2017 yesterday.
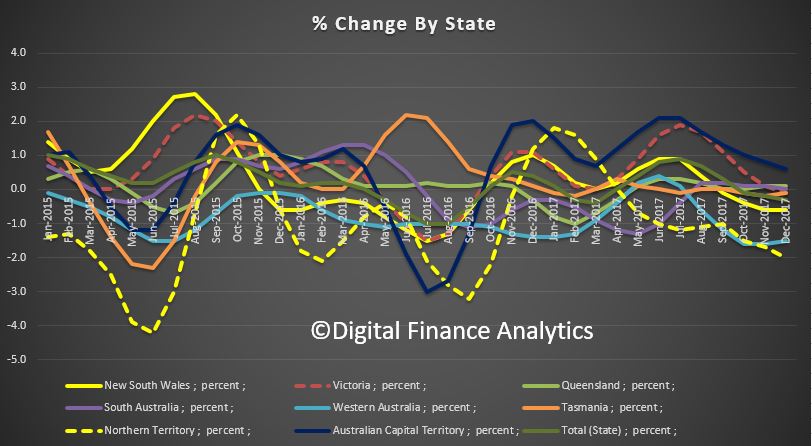
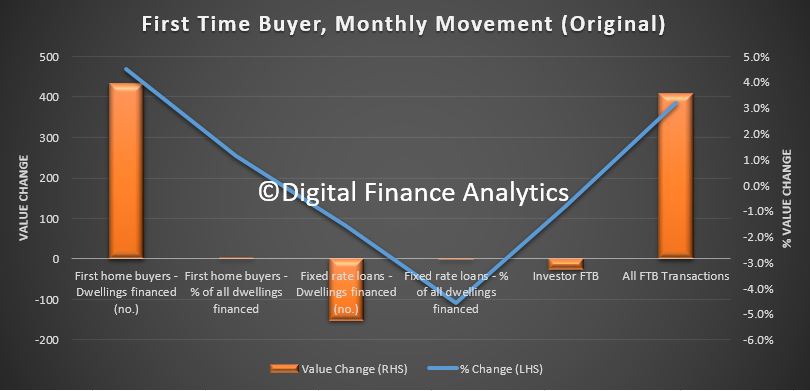
Overall lending was pretty flat, but first time buyers lifted in response to the increased incentives in some states, by 4.5% in original terms to 10,061 new loans nationally.
At a state level, FTB’s accounted for a 19% per cent share in Victoria and 13.7% in New South Wales, where in both states, more favourable stamp duty regime and enhanced grants were introduced this year. But, other states showed a higher FTB share, with NT at 24.8%, WA at 24.6%, ACT at 20.1% and QLD 19.7%. SA stood at 13% and TAS at 13.3%.
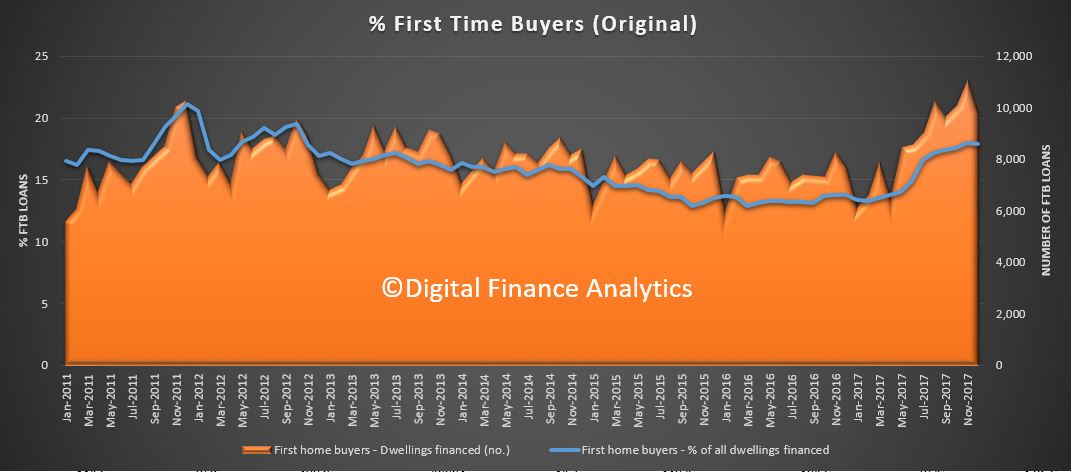
 There was a shift upward shift in the relative numbers of first time buyers compared with other buyers (17.6% compared with 17.4% last month) , still small beer compared with the record 31.4% in 2009. These are original numbers, so they move around each month.
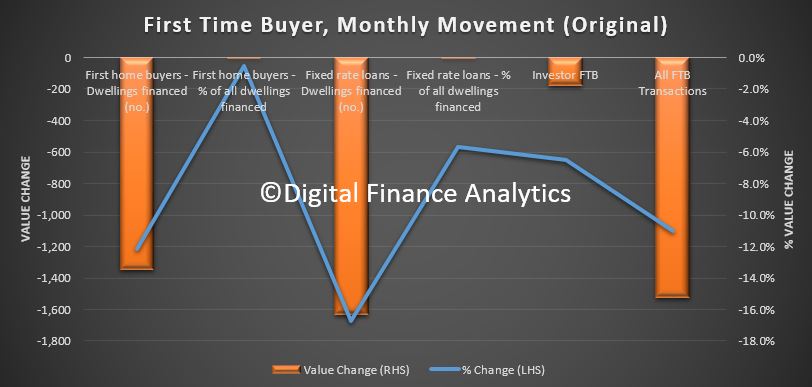
 The number of first time buyer property investors slipped a little, using data from our household surveys, down 0.8% this past month. Together with the OO lift, but total first time buyer participation has helped support the market.
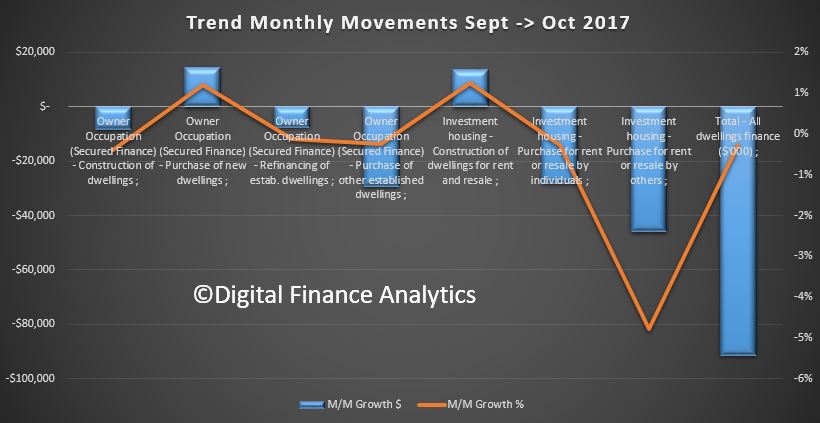
![]() Looking across the data, the trend estimate for the total value of dwelling finance commitments excluding alterations and additions fell 0.3%. Owner occupied housing commitments fell 0.1% and investment housing commitments fell 0.5%. However, in seasonally adjusted terms, the total value of dwelling finance commitments excluding alterations and additions rose 0.6%.
Looking across the data, the trend estimate for the total value of dwelling finance commitments excluding alterations and additions fell 0.3%. Owner occupied housing commitments fell 0.1% and investment housing commitments fell 0.5%. However, in seasonally adjusted terms, the total value of dwelling finance commitments excluding alterations and additions rose 0.6%.
The monthly flows show that owner occupied lending fell $23m compared with the previous month, down 0.15%, while investment lending flows fell 0.5%, down $60m in trend terms. Refinanced loans slipped 0.13% down $7.5 million. The proportion of loans excluding refinanced loans for investment purposes slipped from a recent high of 53.4% in January 2015, down to 44.6% (so investment property lending is far from dead!)
 Here is the breakout by category.
 We see that from a trend monthly perspective, only secured finance for owner occupied purchase of new dwellings, and construction for rent rose.
 In trend terms, the number of commitments for the purchase of new dwellings rose 1.0% and the number of commitments for the purchase of established dwellings rose 0.3% while the number of commitments for the construction of dwellings fell 0.5%.
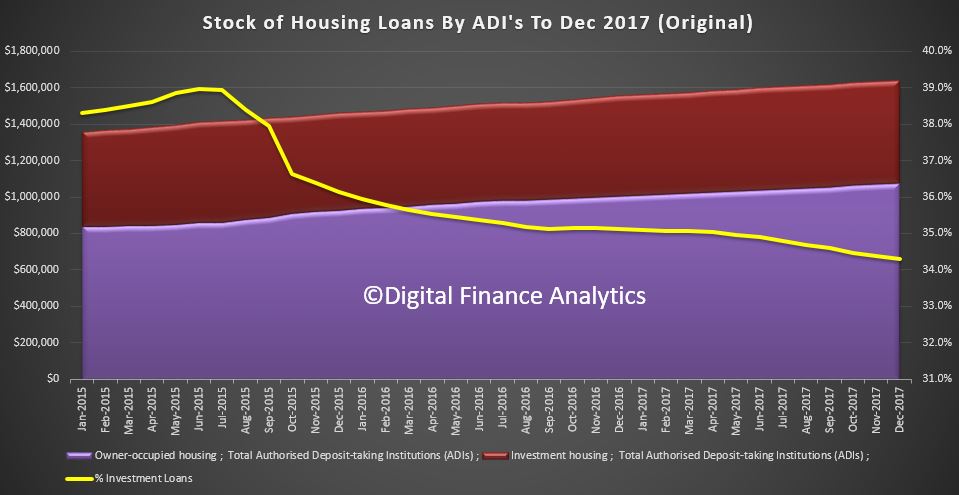
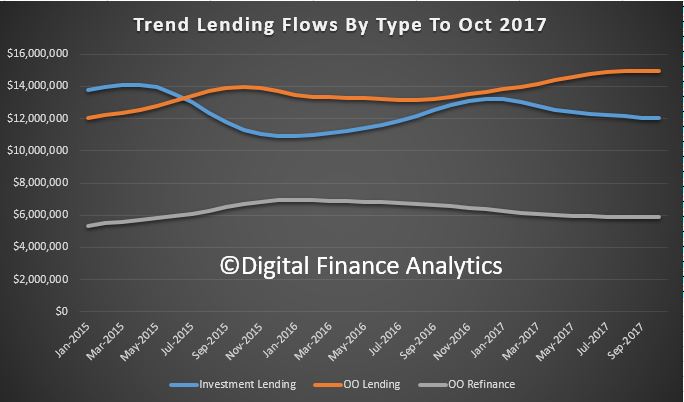
The stock data shows the value of all loans rose 0.49% or $7.8 billion (still an annual equivalent rate of three times income or inflation). Investor stock was 34.5% of all loans, slightly down from last month, but still a substantial proportion of the total.
 The stock data (in original terms) showed a 0.67% rise in owner occupied loans worth around $7.1 billion and investor loans rose by 0.14% of $764 million.
 So, overall the market is being supported by first time buyers, and some refinancing, reflecting the attractor rates currently on offer and recent incentives. But the fact is overall housing debts are rising, creating problems later as household debt rises, relative to income.
Worth also highlighting that many will not see their property lift in value, if the trends in Sydney continue and spread. So many first time buyers are coming in close to the top and when wages are static. So it is important to allow sufficient capacity to handle these risks and that underwriting standards are adjusted accordingly. Trends here continue to mirror events in the USA in 2005/6. Caveat Emptor!