ABC Highlights Housing Risk On 7:30

ABC’s 7:30 did a segment on housing risks, and the implications should the bubble burst.  They discussed the risks if interest rates were to rise, against the context of high household debt. SATYAJIT DAS, FINANCIAL ANALYST said “Australians have been playing this Ponzi game of housing where I buy a house and the value goes up and what happens is then I make money by selling it to somebody else and the whole game depends on the buyer always being able to borrow ever larger sums of money and that all depends on incomes and employment, and that side of the economy, the real economy, is looking extremely weak”.

They also flagged the potential for the RBA to cut the cash rate, in response to banks lifting their mortgage rates.


New Home Sales Falter in May – HIA

The HIA New Home Sales Report, a survey of Australia’s largest volume builders, recorded the first decline for 2015 in May. The four month winning streak came to a modest end in May 2015 with total seasonally adjusted new home sales falling by 2.3 per cent. The decline was driven by a 5.1 per cent dip in detached house sales, reflecting weaker monthly demand in four out of the five states surveyed. DFA observes that the rotation from houses to units continues to build momentum, in answer to the demand for investment property, where returns to builders are also higher.

The mature stage of the new home building cycle primarily reflects further momentum in the ‘multi-unit’ sector, together with persistence of healthy conditions in New South Wales and Victoria. New sales of multi-units increased by 7.6 per cent during the month to yet a new record level, with sales volumes up by 26.7 per cent over the three months to May. Meanwhile strength in detached houses sales is evident in NSW and Victoria, with growth in the May 2015 ‘quarter’ of 5.2 per cent and 6.2 per cent, respectively.

HIA-May-2015In the month of May 2015 detached house sales increased by 3.3 per cent in Queensland, but fell by 2.3 per cent in NSW, 9.9 per cent in Victoria, 5.2 per cent in South Australia, and 8.1 per cent in Western Australia. In the May 2015 quarter, detached house sales increased in NSW (+5.2 per cent) and Victoria (+6.2 per cent). Sales fell over the three month period in SA (-8.1 per cent), Queensland (-7.5 per cent), and WA (-1.3 per cent).

Perspectives on the Housing Debate

Last week amongst all the noise on housing there were some important segments from the ABC which made some significant contributions to the debate. These are worth viewing.

First Lateline interviewed the Grattan Institute CEO on the social and political impacts of housing policy, and also covered negative gearing.

Second The Business covered foreign investors, restrictions on investment lending and the implications for non-bank lenders who are not caught by the APRA “guidance”.

Third, a segment from Insiders on Sunday, dealing with both the economic arguments and the political backcloth.

Next a segment from Australia Wide which explores the tensions dealing with housing in a major growing city, Brisbane. No-one wants building near their backyard, so how to deal with population growth.


Banking: Australian Banks’ Moves to Curb Residential Investment Lending Are Credit-Positive – Moody’s

In a  brief note, Moody’s acknowledged that the bank’s recent moves to adjust their residential loan criteria could be positive for their credit ratings, but also underscored a number of potential risks in the Australian housing sector including elevated and rising house prices, declining mortgage affordability, and record levels of household indebtedness. As a result, they believe more will need to be done to tackle the risks in the portfolio.

Moody’s says the recent initiatives are credit positive since they reduce the banks’ exposure to a higher-risk loan segment. At the same time, it is likely that further additional steps will be required because the growing imbalances in the Australian housing market pose a longer-term challenge to the Australian banks’ credit profiles, over and above the immediate concerns relating to investment lending.

Therefore they expect the banks first to curtail their exposure to high LTV loans and investment lending further over the coming months; and second, they will gradually improve the quantity and quality of their capital through a combination of upward revisions to mortgage risk weights and capital increases. This is likely to happen over the next 18 months or so.

Housing Market Imbalances Pose Long-term Challenges for Australian Banks – Moody’s

Moody’s Investors Service says that underwriting discipline and capital are key variables in maintaining the health of bank credit profiles in Australia, in the face of rising housing market imbalances.

“Rapid house appreciation, particularly in Sydney, as well as lending imbalances are increasing the risks of a housing market correction,” says Ilya Serov, a Moody’s Vice President and Senior Credit Officer. “This poses long-term challenges to Australian bank credit profiles”.

“We expect that over time the banks will revise up their mortgage risk weights and capital levels to better recognize the rising tail risks embedded in their housing portfolios,” adds Serov .

Moody’s analysis is contained in its just-released report titled “Rising Housing Market Imbalances Pose Long-Term Challenges for Australian Banks,” and is authored by Serov.

Moody’s report points out that dividend policy initiatives announced recently by major Australian banks — including National Australia Bank’s announcement of a capital raising of AUD5.5 billion — represent the start of a capital accumulation phase that is likely to extend well into 2016.

In Moody’s assessment, the risks in Australia’s housing market risks are skewed towards the downside. While over the short run, stability in the housing market will be supported by low interest rates and the healthy state of bank balance sheets, elevated and rising house prices are intensifying imbalances in the housing market.

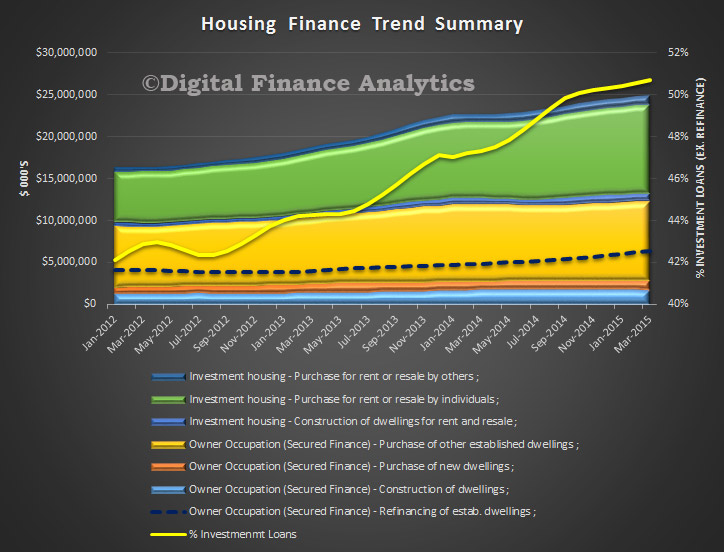
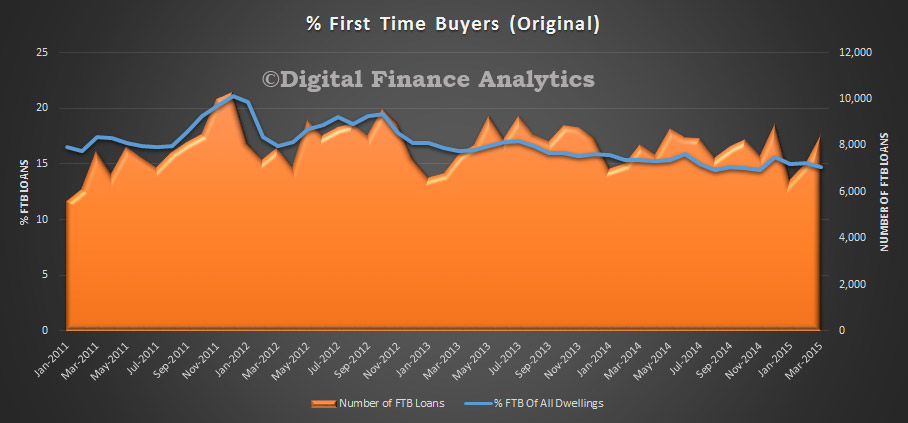
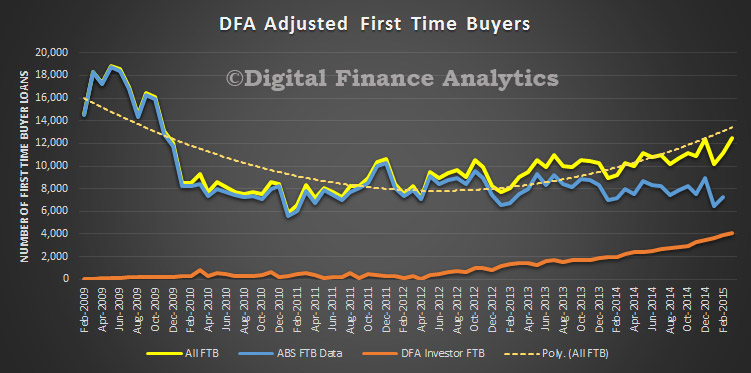
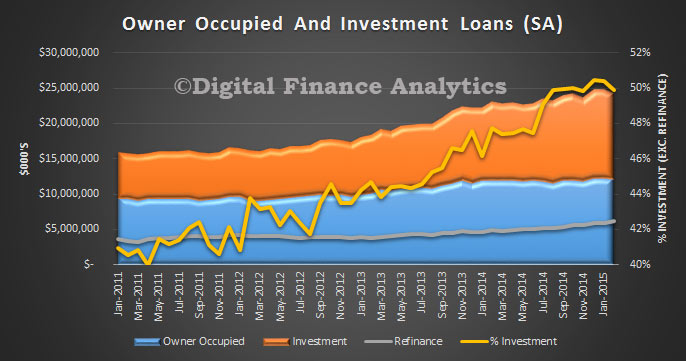
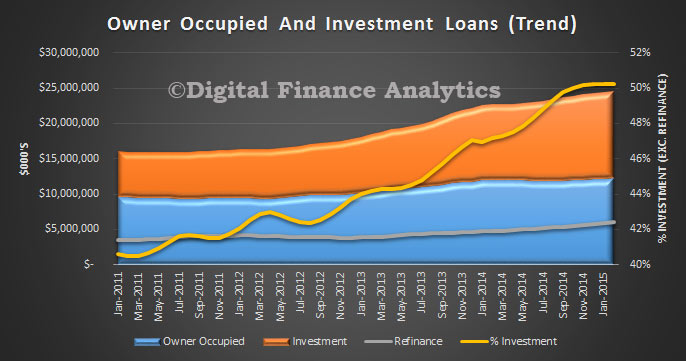
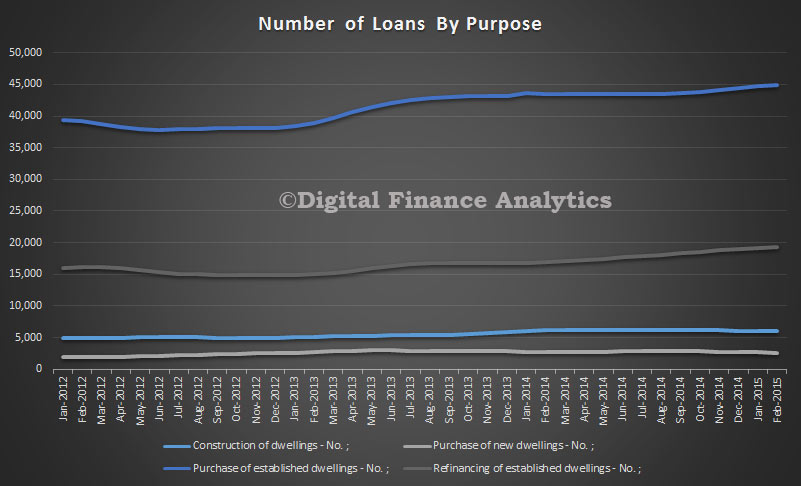
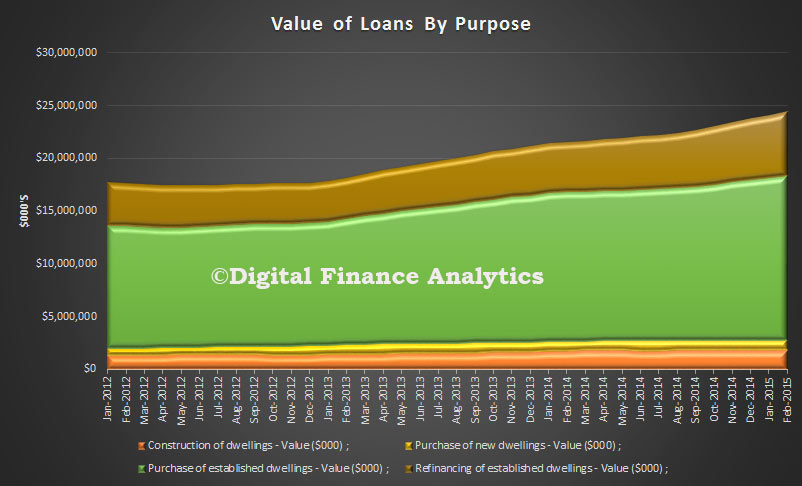
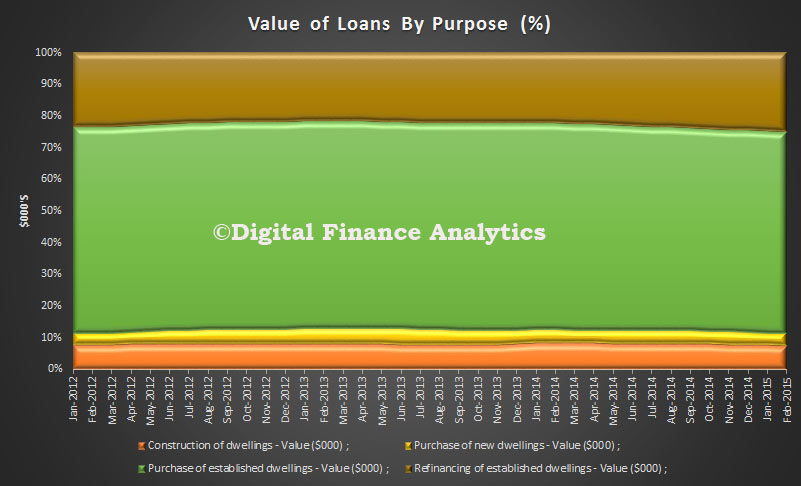
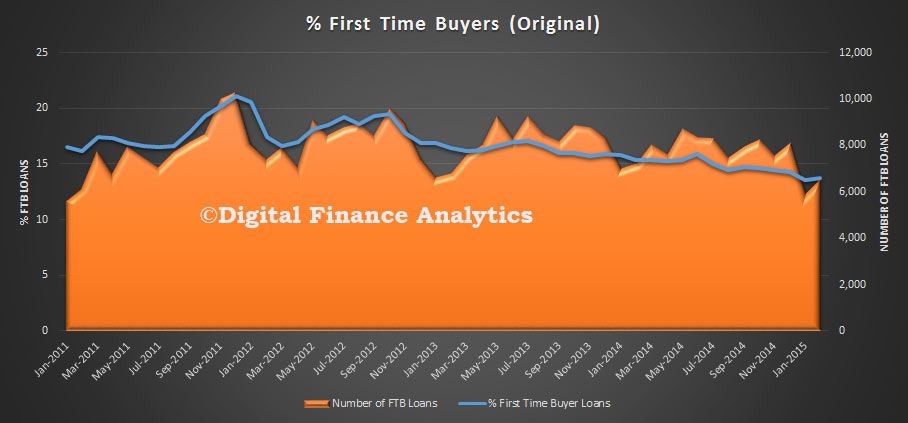
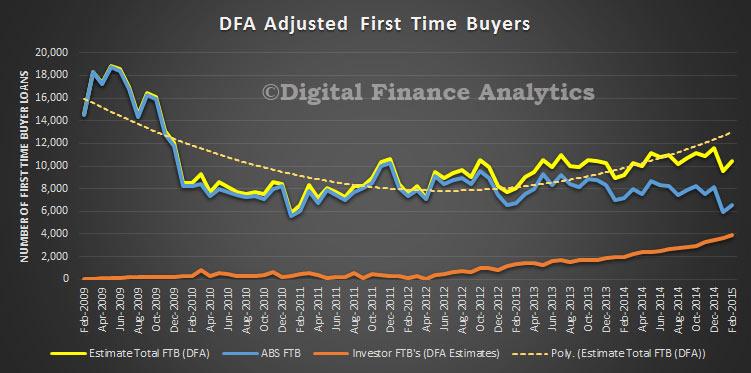
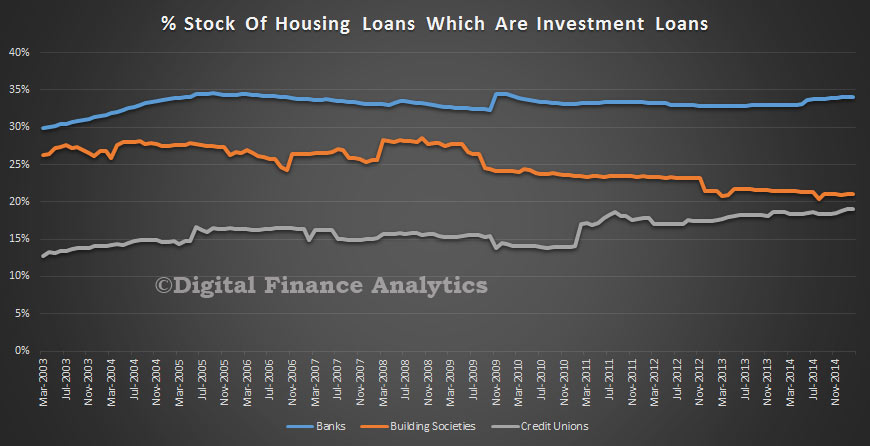
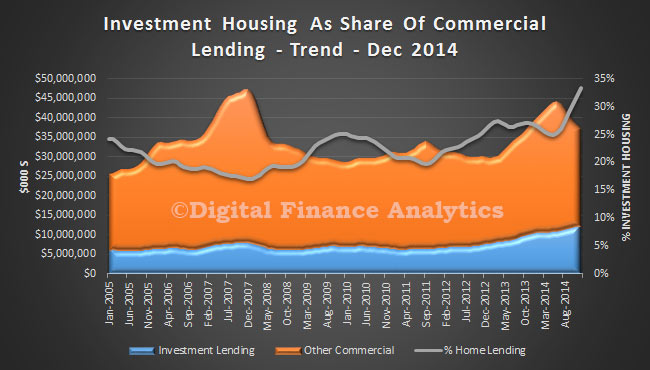
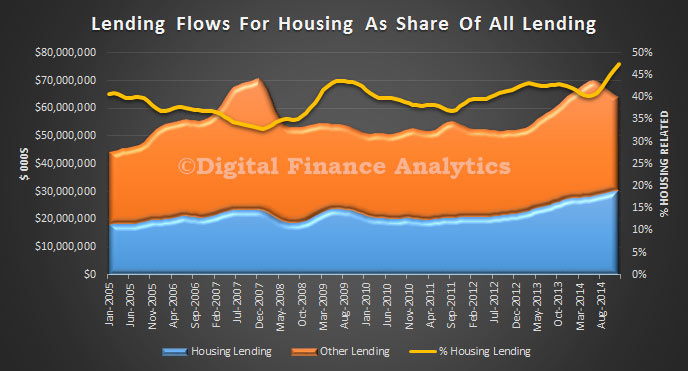
Moody’s evaluation of the Australian housing market suggests that housing affordability is falling, despite the low interest rate environment. Similarly, lending imbalances, including a decline in the proportion of first-time home buyers and a sharp rise in residential investment activity, pose a further source of risk.

In Moody’s view, Australian banks are well-positioned to adjust their origination practices and capital levels to better recognize the rising tail risks embedded in their housing portfolios.

Moody’s report says likely regulatory changes will see average mortgage risk weights for the major banks in Australia increase to the 20%-25% range, up from the current 15%-20%. It estimates that Australia’s four major banks — National Australia Bank Limited (NAB, rated Aa2 stable, a1), Westpac Banking Corporation (Aa2 stable, a1), Australia and New Zealand Banking Group Limited (Aa2 stable, a1) and the Commonwealth Bank of Australia (Aa2 stable, a1) — are well-positioned to absorb such a change.

However, Moody’s also anticipates a broader increase in regulatory capital requirements, in line with the November 2014 recommendation by Australia’s independent Financial System Inquiry that Australian bank capital ratios should be “unquestionably strong” and rank in the top quartile of internationally active banks. This scenario would necessitate deeper adjustments to the banks’ dividend policies, and potentially the raising of new capital.

Moody’s report points out that the latest regulatory data suggests that Australian banks have become more conservative in their underwriting, as they have curtailed their exposure to high loan-to-value ratio loans. Such moves would help offset the risks posed by the country’s deepening housing market imbalances.

The rating agency sees ongoing adjustment to banks’ underwriting practices to bring them into line with the guidelines released by the Australian Prudential Regulation Authority in December 2014, which include limiting growth in investor housing loans to 10% per annum and specific guidance around stressed debt-service requirements, as supportive of the banks’ high rating levels.

Moody’s report notes that since May 2014, median home prices have risen by 10% nationwide, and by 16% in the core Sydney market . The report further notes that Australian home prices have risen by 23% since the start of the latest interest rate cutting cycle in November 2011.

Overall, Moody’s says that the banks’ asset quality metrics and portfolio quality will remain strong in calendar 2015, supported by Australia’s low interest-rate environment.

Investor Loans Still Hot – ABS

The ABS released their housing finance data to March 2015. Pretty common story, with the trend estimate for the total value of dwelling finance commitments excluding alterations and additions rising 0.8%. Owner occupied housing commitments rose 0.8% and investment housing commitments rose 0.8%.  In trend terms, the number of commitments for owner occupied housing finance rose 0.4% in March 2015.

In trend terms, the number of commitments for the purchase of established dwellings rose 0.7%, while the number of commitments for the construction of dwellings fell 1.4% and the number of commitments for the purchase of new dwellings fell 0.1%. The growth in investor property loans continued, with more than half in March (excluding refinance). Refinancing also grew in value and in percentage terms, from 18% of all loans a year ago, to over 20%, stimulated by ultra low rates.

Housing-FinanceMarch2015Looking at the First Time Buyer data, in original terms, WA had the highest share of FTB, and NSW the lowest.

FTBCountByStateMarch2015The percentage of FTB compared with all dwellings is relatively static.

FTBMarch2015However, if we overlay the DFA survey data on first time buyers who are going straight to investment property, this continues to rise, and pushes the true number of FTB higher. We continue to see a rotation away from owner occupation to investor first time buyers.

All-FTBMarch2015


Is The Housing Finance Worm Turning?

The ABS Housing Finance data for February 2015 was released today. The trend estimate for the total value of dwelling finance commitments excluding alterations and additions rose 0.8%. Owner occupied housing commitments rose 1.0% and investment housing commitments rose 0.4%. This is the first time growth in owner occupied loans has exceeded investment loans for many months. As a result the proportion of investment loans dropped below 50% for the first time this year. The cut in RBA rates also stimulated demand for the refinance of existing loans. We also see the bulk of investors purchased established dwellings, not newly constructed property.

OOandINVSAFeb2015The trend data (which irons out monthly changes) held investment loans over 50%, but also registered a slight drop.

OOandINVTrendsFeb2015In trend terms, the number of commitments for owner occupied housing finance rose 0.2% in February 2015.  In trend terms, the number of commitments for the purchase of established dwellings rose 0.5%, while the number of commitments for the purchase of new dwellings fell 1.4% and the number of commitments for the construction of dwellings fell 1.1%. The number of loans to owner occupiers buying established homes, excluding refinancing, fell by 0.9 per cent.NumberofLoansByPurposeFeb2105The overall value of loans made in the month was a record $18 billion, excluding refinancing of existing loans. New construction was up about 2%.

ValueofLoansByPurposeFeb2015In percentage terms, refinance of loans increased slightly, relative to new loans.

ValueofLoansByPurposePCFeb2015 In original terms, the number of first home buyer commitments as a percentage of total owner occupied housing finance commitments rose to 13.7% in February 2015 from 13.6% in January 2015.

FirstTimeBUyersFeb2015If we overlay the DFA modelling of first time investor loans, overall first time buyer activity was up. Remember, also the data refers to loans, not property transfers, and we know form our surveys that additional purchases were made without the need for a mortgage by overseas investors, and local purchases cashed up thanks to the Bank of Mum and Dad.

FirstTimeBUyersAdjustedFeb2015Finally, the bulk of lending is being done by the banks, relative to credit unions and building societies. The total loans on book was $1.375 trillion.

Loan-ValueByLenderTypeFeb2015

It is also worth noting that building societies are lending a smaller proportion of investment loans, and the falling trend here, compared with the rising trend in the credit union sector, though both are well below the 34% of banks loan portfolio.

LoanStockByTypeFeb2015


.

The Problems with Relying on the Bank of Mum and Dad

DFA recently highlighted the rise of the bank of Mum and Dad. In The conversation, there is an article highlighting some of the potential risks, especially with formal bank guarantees.

Ask a parent how far they would go to support the financial aspirations of their children, and chances are they will say: “Yes, if I had the money I would be happy to act as a guarantor for my children to purchase a property.”

Australian capital city house prices rose by 7.9% in 2014, while the number of first home buyer commitments as a percentage of total owner occupied housing finance commitments is near record lows – 14.2% in January 2015, compared to 20.4% in December 2012.

Many family-assisted first-home purchases are not being counted in the first home buyer data collected by the Australian Bureau of Statistics, but it’s likely the growing cost of owning a home is encouraging an increasing number of parents to help out via a guarantee, interest-free loan, initial deposit or simply making a monetary gift to their children. This financial support can change an individual’s decision to buy or rent a house or unit. Parental support can also help first home buyers avoid mortgage insurance charges that can easily exceed A$15,000 for a family home in a desirable suburb.

The risk to parents

Consumer advocates cite “lots of cases” where guarantors have been faced with the prospect of losing their home.

Since 2004 Australian banks have offered specific “family pledge” or “family guarantee” loans, allowing parents to provide both equity support and income support. These products are driving growth in the sector, adding to the risk for parents.

In the current economic climate with rising unemployment and costs of living, parents need to understand the risks of acting as guarantor, and all the legal responsibilities that come with it. The guarantor has a legal responsibility to repay the loan (along with any fees, charges and interest) if the borrower defaults. If the guarantee is tied against assets such as the family home, guarantors may end up losing their home, particularly if the parents’ financial position or health conditions have changed over the years. Often the lenders can sue the guarantor if the loan obligations are not met by the debtor. If parents have concerns, it may be a good idea to contribute towards the deposit so that a guarantee is not required.

It is equally important for parents to be educated with regard to the purpose of the loan, amount of the guarantee, to know in detail if their children have stable incomes, and the kind of loan they are guaranteeing (such as lines of credit or overdraft which have no specific time to maturity).

The risk to the banking sector

Family-pledged loans can be categorised as non-conforming loans, an area where lenders seek to minimise the level of risk as much as possible. The Australian Prudential Regulatory Authority has outlined some guidelines for ADIs with regard to loans including a guarantor relationship (e.g. from a parent of the borrower) to cover shortfalls in minimum deposit requirements. APRA acknowledges these loans carry a high risk and ADIs should carefully assess the guarantor’s income, credit worthiness, enforceability of potential claims and the value of any collateral pledged by the guarantor. APRA also emphasises that as a risk management strategy a prudent ADI should establish portfolio limits within its risk appetite for such lending. Such limits can be stress tested.

Since the 1997 Wallis Inquiry, household leverage has almost doubled. This has been accompanied by a significant increase in house prices relative to income over the past decade. Australian home prices are 50% higher than usual relative to rents, and around 40% higher than usual when compared to incomes. The Bank of International Settlements has already warned that a price correction may be coming.

The Financial System Inquiry is seeking measures to ease the effects of the housing market on the economy along with ways that these measures can be implemented.

Inadequate bank supervision and poorly underwritten home mortgages led to the financial crisis. Easing credit constraints, delivering innovative products (along with fee generating activities) without considering the associated risks, and a lack of internal and external monitoring and supervision, can increase non-performing loans and threaten the financial system and its stability.

Banks More Leveraged Into Housing Than Ever

Putting together data from the recent ABS releases, we can view some important data which shows that today Banks in Australia are deeper into property than ever they have been. As a result they are more leveraged (thanks to capital adequacy rules) and more exposed if prices were to turn. Meantime, other classes of commercial lending continues to decline.

To show this, we look first at the share of commercial lending which is investment housing related. These are the monthly flows, not the overall stocks of loans on book. On latest trend data, around 33 per cent of monthly lending is for investment housing. Its normal range was 20-25 percent, but thanks to a spike in investment for housing, and a fall in other commercial lending categories it has broken above 30 percent. From a capital and risk perspective, lending for investment housing is adjudged as less risky than other commercial lending categories.

InvestmentLendingAsShareOfCommercialDec2014Now, lets look at all lending for property, including owner occupied lending, investment lending, and alterations, again from a flow perspective. Now we find that 47 per cent of all monthly flows are property related, again, higher than it has traditionally been.

LendingDec14HousingVSAllFinally, in our earlier analysis we highlighted the relative stock of different loan types. Overall, only 33% of all lending is productive finance for business purposes. Household and consumer debt continues to rise strongly. Housing Lending is driving the outcomes.

SplitsDec2014

This is unproductive lending, simply feeding the debt beast, and inflating property to boot. It also means the banks have strong interests in keeping the beast fed, and the RBA, conscious of the need for financial stability, will continue to support the current mix. As Murray pointed out the government is guaranteeing the banks and if there was a failure the tax payer would pick up the tab.