What Is The Key To Curing Endemic Deflation?

Given the RBA rate cut, concerns about poor growth, flat-lining income, structural deficits and little business investment, it is worth thinking about unconventional policies to turn the economy round. Just cutting rates does not deliver. What is needed is a longer term, properly developed structural plan.

KeysSo, a timely working paper from the IMF is worth reading. Relating Japan: Time to Get Unconventional? discusses such an approach.

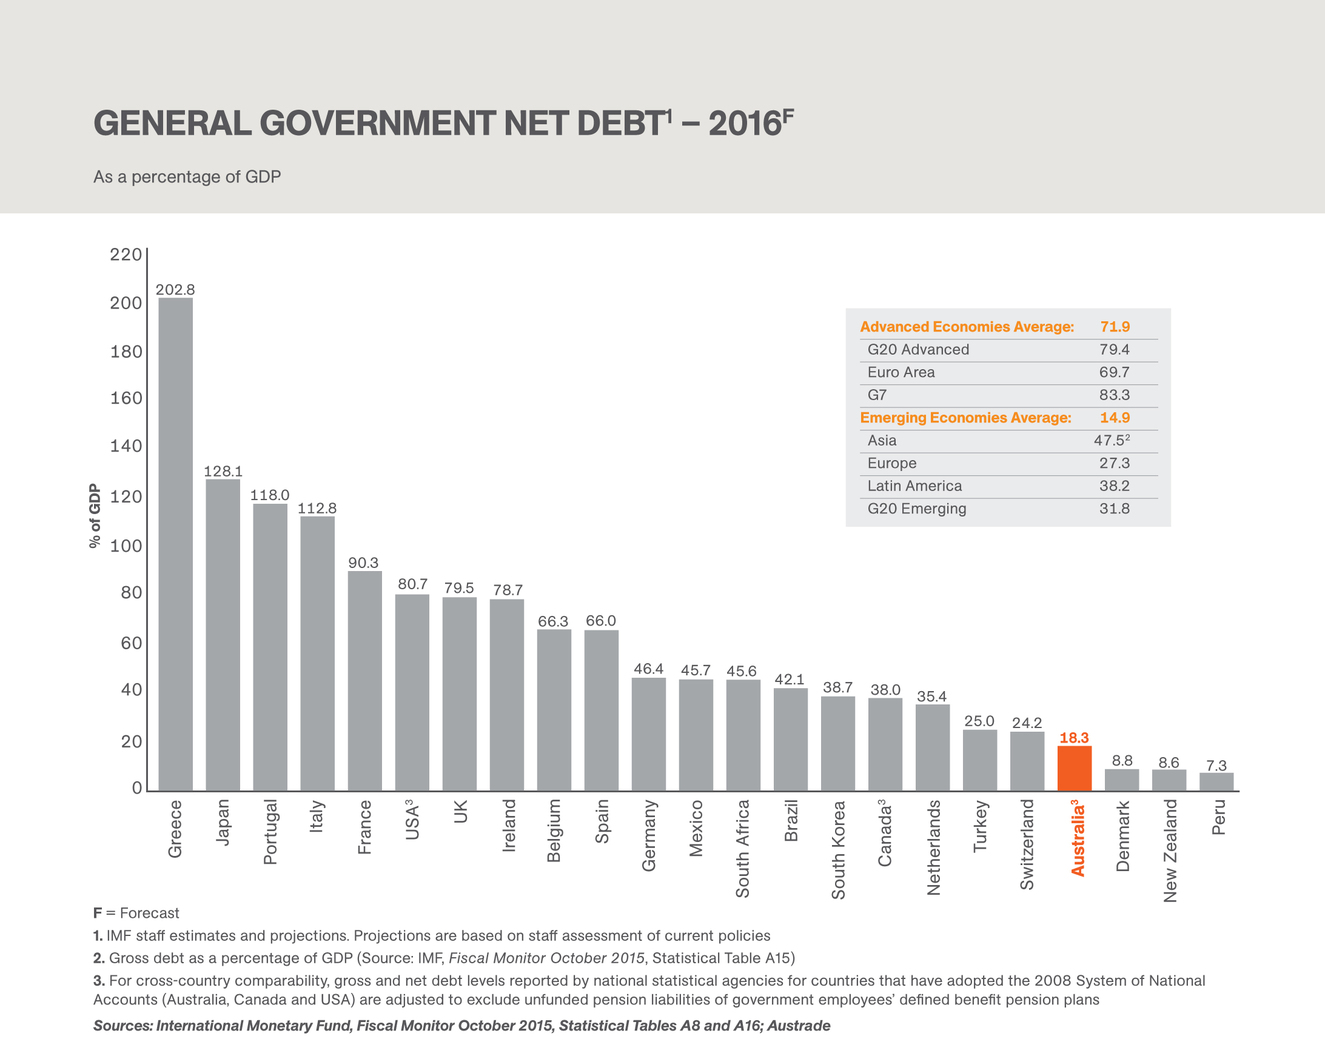
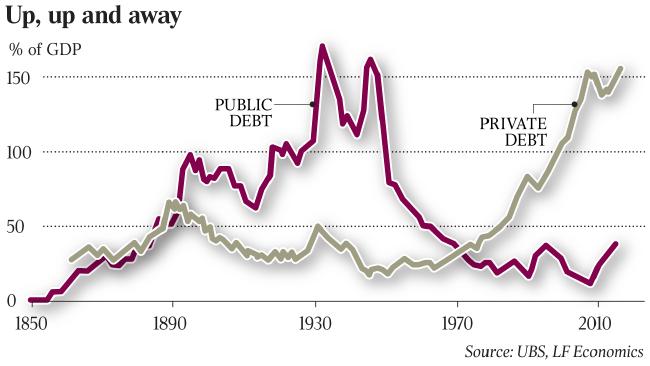
Since the bubble burst in the early 1990s, Japan has experienced deficient nominal and real GDP growth and repeated deflationary episodes. Monetary policy has been unable to get the economy out of the liquidity trap, given the Effective Lower Bound (ELB) on monetary policy rates. These factors together with repeated fiscal stimulus have led to rapid increases in the public debt to GDP ratio. Public gross debt to GDP has reached levels without precedent in peace time.

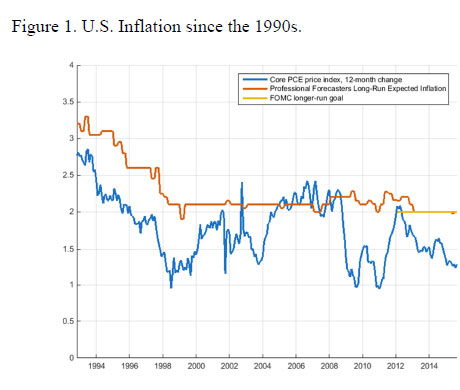
Slow wage-price dynamics amount to a missing link in the transmission of rising corporate earnings to inflation (actual and expected). Wage setting tends to be backward looking, based on recent actual inflation rather than the 2 percent target of monetary policy. Without strong efforts to resolve this market coordination blockage, attempts to raise nominal GDP growth will remain elusive.

The paper argues for a comprehensive policy package to get the Japanese economy to a higher sustainable growth path and end deflation. They call it Three Arrows “Plus”.

Prime Minister Abe’s administration came to power in December 2012 to end this economic malaise with a policy package (the so-called Abenomics) consisting of three arrows: bold monetary policy, flexible fiscal policy, and a growth strategy that promotes private investment. The objective was to jolt the economy to higher sustainable growth, positive inflation, and, through flexible policy, public debt sustainability.

First monetary policy in Japan needs to be cast in a credible and transparent framework that is able to anchor inflation expectations over the medium term. We recommend that the BoJ moves to an inflation-forecast-targeting (IFT) framework, where monetary policy responds to deviations of the inflation forecast from the 2 percent target.

Second, Japan’s fiscal policy would benefit from a transparent framework to manage public sector balance sheet risks over the long term, while maintaining the flexibility to support monetary policy as appropriate. The challenge for fiscal policy is to preserve debt sustainability, given the large debt burden. This ultimately depends on exiting deflation, and thereby reducing long-term real interest rates as well as increasing growth. This requires a skillful fiscal policy mix that supports BoJ inflation targeting through higher public wages and transfers, while increasing VAT rates in small steps over a very extended time period to bring debt on a sustainable path. The advantage of committing to a path of small, rather than less frequent, larger-step, consumption tax hikes would be to avoid the volatility and uncertainty from large intertemporal substitution effects, and to minimize the ultimately negative effects on spending.

Third, to implement structural policies to reduce labor market duality, increase the labor force through foreign workers, and boost potential output. Essential to higher long-term growth is a set of structural reforms that reverses the trend in product offshoring and makes Japan an attractive place to invest again by raising future demand expectations.

Plus, the new arrow of the proposed policy package is an incomes policy for Japan to put an end to low wage growth and induce inflation (through cost-push pressures) to move in line with the BoJ target. It would build on recent measures taken by the authorities, including tax incentives for firms that raise wages, higher minimum wage increases, and moral suasion to encourage wage growth. This would be done through the wage policy of the public sector (see fiscal policy section above) and a “comply or explain” policy for the private sector. The “comply or explain” policy would be similar to the regulatory approach used in Japan, Germany, the Netherlands, and the UK in the field of corporate governance and financial supervision. The government would announce a wage inflation guideline, which companies would then either need to comply with, or explain publicly why they cannot. The wage inflation target would not be a binding law as the purpose of this policy is to reject a “one-size fits all” policy, given differences in productivity and relative prices across the economy. It should be noted that the objective of the incomes policy is not to induce changes in relative prices, higher real wages, or a reduction in competiveness but rather to move all nominal variables in line with the BoJ’s inflation target.

The U.S. incomes policy during the Great Depression was effective in ending deflation. As part of the New Deal, President Roosevelt established the National Recovery Administration (NRA) in early 1933 to help combat deflation. It established collective bargaining rights, a system of codes to set minimum wages, and to allow collusive pricing. By 1935, over half of all employees were covered by NRA codes (Lyon and others, 1935). Other anti-deflationary policies included an exit from the Gold Standard, and a large fiscal stimulus under the Public Works Administration. The US Supreme Court struck down the NRA codes as unconstitutional in 1935. The results of the NRA are difficult to evaluate, amidst all the other developments, but under the program deflation did end, and industrial production rebounded, with a 55 percent expansion, 1933–35

IMF-orkingGenerating wage-push inflation is not without risks and success is not guaranteed. For example, firms might increase hiring of non-regular workers, if there are timing and coordination problems, if “comply-or-explain” policies do not deliver sufficient compliance, or if there is the perception by firms or households that policies can be reversed. Possible declines in competitiveness and profitability—especially for labor intensive SMEs and export-oriented companies— could have an adverse impact on employment and growth in the near term. Finally, proposals to increase public wages are likely to encounter political resistance in light of ongoing fiscal consolidation plans.

Since it reinforces the three arrows of Abenomics, we call it Three Arrows Plus. An unorthodox component of the package is an incomes policy aimed directly at sluggish wage-price dynamics. We build on the authorities’ current policies by emphasizing the need for more credible and transparent monetary and fiscal frameworks that reinforce each other to reduce policy uncertainty and raise policy effectiveness. We emphasize structural reforms to end labor market duality, raise female participation, increase the labor force through foreign workers, and reform certain sectors of the economy. Although their short-term effects are uncertain, over time such reforms would raise the growth rate of potential output. The Three-Arrows-Plus package (monetary, fiscal, structural, and incomes policies) is coordinated to exploit synergies, and have the maximum chance of success.

Note: IMF Working Papers describe research in progress by the author(s) and are published to elicit comments and to encourage debate. The views expressed in IMF Working Papers are those of the author(s) and do not necessarily represent the views of the IMF, its Executive Board, or IMF management.


Global Home Prices, On Average Back to 2007 Levels

The latest data from the IMF Global Housing Watch says shows that, on average, prices are almost back up to where they were at the start of 2007. That said Australia and a number of other countries have had much stronger growth over this period.

IMF-GP-JulyThere is a fair bit of cross-country variation, however. While house prices have increased over the past year in most countries in the sample, the pace of increase varies quite a bit. And there are still a dozen or so countries where house prices have fallen over the past year, including Brazil, China and Russia.

IMF-GP-July1 Both real house prices and real GDP growth in the 2007-2015 period were well below the boom experienced during 2000-2006. In the earlier period, global real GDP grew by over 4% per year while real house prices surged by about 9% on average. In the more recent period, these grew by just 2% and 1% per year, respectively. The simple correlation between real growth in house prices and GDP growth was very similar in the two periods at about 0.6.

The pace of credit creation also fell sharply between the pre- and post-crisis periods from 17% to 6%. The correlation between growth in house prices and credit expansion fell substantially from 0.8 to 0.3. Given that many countries sharply eased monetary policy during the post-crisis period, it seems reasonable to posit that slow credit growth was a result of diminished investment opportunities, reduced risk appetites on the part of lenders, and the adoption of macroprudential policies designed to reduce the probability of boom/bust cycles in the future. Moreover, the decline in the correlation between house prices and credit expansion suggests that other country-specific factors may have played a role in determining house prices.

One such factor is fiscal policy. We use as our indicator the change in the cyclically-adjusted primary fiscal balance as a percentage of GDP during each sub-period. The correlation between the change in the policy stance and home prices went from nearly zero to almost -0.5, suggesting that country-specific policy developments have played a role in determining the development of real estate prices.

Over the last quarter, there have been discussions of housing sector developments in IMF staff reports in over a dozen cases. One feature of the discussions has been a growing emphasis on the role of supply constraints in driving house price increases—this was flagged for instance in the case of Denmark and Germany. Another is the continued active use of macroprudential policies in several countries, among them Canada and the United Arab Emirates. Concerns about the extent of house price growth were flagged in the cases of the Czech Republic (“a strong housing market is becoming a potential source of risk”), Denmark (“rapid house price increases call for early policy action”) and Norway (“high and rising house prices and household debt in Norway pose important macro-financial stability risks”).

IMF Calls for Broad-based Policy Effort to Reinvigorate Growth

Ms. Christine Lagarde, Managing Director of the International Monetary Fund (IMF), issued the following statement today at the conclusion of the Group of 20 (G20) Finance Ministers and Central Bank Governors Meeting in Chengdu, China:

“We met at a time of political uncertainty from the Brexit vote, and continued financial market volatility. Lackluster growth of the post-crisis era continues, with weak demand in advanced economies and difficult transitions to a self-sustained growth model in many emerging markets. As a result, global growth has been revised downward slightly for both 2016 and 2017.

Pin-Global-Crisis“Our discussions were taking place in a spirit of cooperation and willingness to tackle difficult issues. There was a consensus around the table that more needs to be done to share the benefits of growth and economic openness broadly within and among countries.

“In this context, I noted that the G20 members are taking actions to foster confidence and support growth. I welcome their determination to use all policy tools —monetary, fiscal and structural— individually and collectively to achieve strong, sustainable, balanced and inclusive growth. Structural reforms are particularly critical, as recent IMF work shows that well-designed structural reforms can lift both short- and long-term growth and make it more inclusive. Further trade liberalization is also crucial to bolster productivity and global growth, while taking steps to ensure the gains from trade are shared widely.

“The G20 members also emphasized the importance of further strengthening the International Financial Architecture and, in that context, a resilient Global Financial Safety Net (GFSN) with a strong and adequately resourced IMF at its center”.

Uncertainty in the Aftermath of the U.K. Referendum – IMF


The IMF just released an interim World Economic Outlook update. The baseline global growth forecast has been revised down modestly relative to the April 2016, but more negative outcomes are a distinct possibility. The global economy is projected to expand 3.1 percent this year and 3.4 percent in 2017, according to the IMF.

The economies of the United Kingdom (U.K.) and Europe will be hit the hardest by fallout from the June 23 referendum, which prompted a change of government in Britain. Global growth, already sluggish, will suffer as a result, putting the onus on policy makers to strengthen banking systems and deliver on plans to carry out much-needed structural reforms.

Before the June 23 vote in the United Kingdom in favor of leaving the European Union, economic data and financial market developments suggested that the global economy was evolving broadly as forecast in the April 2016 World Economic Outlook (WEO). Growth in most advanced economies remained lackluster, with low potential growth and a gradual closing of output gaps. Prospects remained diverse across emerging market and developing economies, with some improvement for a few large emerging markets—in particular Brazil and Russia—pointing to a modest upward revision to 2017 global growth relative to April’s forecast.

Because the future effects of Brexit are exceptionally uncertain, the report outlined two scenarios that would reduce world growth to less than 3 percent this year and next.

The outcome of the U.K. vote, which surprised global financial markets, implies the materialization of an important downside risk for the world economy. As a result, the global outlook for 2016-17 has worsened, despite the better-than-expected performance in early 2016. This deterioration reflects the expected macroeconomic consequences of a sizable increase in uncertainty, including on the political front. This uncertainty is projected to take a toll on confidence and investment, including through its repercussions on financial conditions and market sentiment more generally. The initial financial market reaction was severe but generally orderly. As of mid-July, the pound has weakened by about 10 percent; despite some rebound, equity prices are lower in some sectors, especially for European banks; and yields on safe assets have declined.

In the first, “downside” scenario, financial conditions are tighter and consumer confidence weaker than currently assumed, both in the U.K. and the rest of the world, until the first half of 2017, and a portion of U.K. financial services gradually migrates to the euro area. The result would be a further slowdown of global growth this year and next.

The second, “severe” scenario, envisages intensified financial stress, particularly in Europe, a sharper tightening of financial conditions and a bigger blow to confidence. Trade arrangements between the U.K. and the EU would revert to World Trade Organization norms. In this scenario, “the global economy would experience a more significant slowdown” through 2017 that would be more pronounced in advanced economies.

Growth Forecasts Chart

With “Brexit” still very much unfolding, the extent of uncertainty complicates the already difficult task of macroeconomic forecasting. The baseline global growth forecast has been revised down modestly relative to the April 2016 WEO (by 0.1 percentage points for 2016 and 2017, as compared to a 0.1 percentage point upward revision for 2017 envisaged pre-Brexit). Brexit-related revisions are concentrated in advanced European economies, with a relatively muted impact elsewhere, including in the United States and China. Pending further clarity on the exit process, this baseline reflects the benign assumption of a gradual reduction in uncertainty going forward, with arrangements between the European Union and the United Kingdom avoiding a large increase in economic barriers, no major financial market disruption, and limited political fallout from the referendum. But more negative outcomes are a distinct possibility.

A more thorough assessment of the global outlook will be presented in the October 2016 WEO.


Low Inflation – A Result Of Globalisation?

As discussed, low inflation is a phenomenon exhibited in many developed economies around the world, and this is driving central banks to cut core cash rates, in an attempt to move inflation into a policy band which is typically 2-3%.

Yet, inflation seems to be staying lower for longer. A new working paper from the IMF “What is Keeping U.S. Core Inflation Low” uses bottom-up analysis to try and identify the underlying causes of low inflation. They conclude that sizable elements which drive inflation outcomes are related to the international price of goods, and that this global linkage has been one of the major factors in driving inflation lower. In other words, globalisation explains much of the current lower inflation. Therefore we, perhaps, need to question underlying assumptions about what the right inflation target should be.  2-3% may not be relevant any more, and monetary policy needs to be reviewed.

Over and above the potential non-linearity of the Phillips curve, another key element of the current conjuncture is global concerns about low inflation. One way of seeing how this may be impacting the U.S. is to look at the very different trends in core PCE goods and services inflation.

IMF-Inflation---Root1 Core services inflation declined through the 1990s from close to 5 percent to 2 percent, climbed again in the 2000s to reach 3.4 percent on the eve of the Great Recession, but then fell significantly during the Great Recession. It has recovered since then, but at around 2 percent remains significantly below levels seen earlier. Core goods inflation, on the other hand, has often been negative over the last twenty years, likely reflecting the impact of global pressures

IMF-Inflation---Root2Indeed, core goods inflation seems to react to nonpetroleum import prices with a lag, and the latter have been on a downward trend since late-2011.

Aggregate analysis only allows a limited understanding of the channels by which global pressures are impacting U.S. inflation. Moreover, it does not really facilitate the analysis of sector-specific factors such as the impact of the Affordable Care Act (ACA) on healthcare inflation. To really understand how external, domestic, and idiosyncratic factors drive the different components of inflation, one needs to develop a structural or “bottom-up” model, which is the goal of this paper. Specifically, we develop models of inflation for import prices, core goods, healthcare services, housing services, and core services excluding healthcare and housing. We then combine these models into one for aggregate PCE inflation. The overall findings of the paper are:

  • Core goods inflation is driven mainly by global price pressures and dollar movements. Domestic factors (e.g. the unemployment gap) help explain core services inflation, and it is important to separately model housing and healthcare
    sub-components of services inflation.
  • The aggregate inflation forecasts from this “bottom-up” approach have small root mean square errors (RMSEs), although the RMSEs using an aggregate Phillips curve equation are also small. The former, however, is more informative in tracing the effects of shocks and understanding the exact channels through which they affect overall inflation.
  • When we use the bottom up model for forecasting inflation in 2016 and beyond, our benchmark scenario has inflation gradually rising towards but not reaching 2 percent by 2020, given the headwinds caused by global price pressures. This benchmark scenario uses the Congressional Budget Office’s (CBO) forecast for the unemployment gap (which troughs at around -0.4 percent in 2017 before starting to increase and turning positive in 2019), assumes the dollar remains constant in nominal effective terms, house price inflation remains around levels of late 2015, and the impact of the public spending cuts on health care inflation gradually declines.
  • Core PCE inflation could, however, reach as high as 2.4 percent by 2018 if the dollar were to depreciate, the unemployment rate goes well below the natural rate, house price inflation climbs, and there is a more temporary impact of public spending cuts on health services inflation.
  • These forecasts assume inflation expectations stay well anchored. If inflation expectations do become unanchored, then of course inflation could rise more rapidly and reach a higher level. This, however, seems a very unlikely scenario. The forecasts also assume the absence of non-linearities in the Phillips curve, which is empirically supported by our recursive analysis and direct tests.

Price changes in PCE core goods and core services have evolved differently over the past few decades. This motivated us to look deeper into inflation dynamics and investigate whether the underlying determinants of core goods and core services inflation also differ.

Our empirical work indicated that that this is indeed the case. In particular, we found that foreign rather than domestic factors drive core goods inflation, with a specific channel operating through import prices. The latter were, in turn, found to be primarily determined by the strength of the dollar as well as inflation in countries that are major non-oil commodity exporters of to the U.S.—most notably, China, Canada, the Euro area, and Mexico.

Note: IMF Working Papers describe research in progress by the author(s) and are published to elicit comments and to encourage debate.The views expressed in IMF Working Papers are those of the author(s) and do not necessarily represent the views of the IMF, itsExecutive Board, or IMF management


How Are Employment and Inflation Connected?

Inflation dynamics and its interaction with unemployment seem to be behaving differently since the Global Financial Crisis (GFC). Are external factors such as low interest rates and credit availability and other external variables influencing the current apparent dislocation of the assumed relationship between inflation and unemployment? Or is the underlying relationship, as described in the so called Phillips curve at fault? Perhaps we cannot assume, all else being equal, that in the current economic climate, lower levels of unemployment will necessarily translate to higher inflation.

The Phillips curve is a single-equation empirical model, named after A. W. Phillips, describing a historical inverse relationship between rates of unemployment and corresponding rates of inflation that result within an economy. Stated simply, decreased unemployment, (i.e., increased levels of employment) in an economy will correlate with higher rates of inflation. (Wikipedia).

Is the Phillips curve broken? This question is a central topic in macroeconomics as modified forms of the Phillips Curve that take inflationary expectations into account remain influential. Modern Phillips curve models include both a short-run Phillips Curve and a long-run Phillips Curve. This is because in the short run, there is generally an inverse relationship between inflation and the unemployment rate; as illustrated in the downward sloping short-run Phillips curve. In the long run, that relationship breaks down and the economy eventually returns to the natural rate of unemployment regardless of the inflation rate.

The key question is – how does unemployment affect inflation? Since the Great Financial Crisis (GFC) of 2008-2009, while inflation has declined, it has fallen less than was anticipated (an outcome referred to as the “missing disinflation”). More recently the currently low unemployment rates should have pushed the inflation rate closer to the Federal Open Market Committee’s longer-run inflation goal, but inflation has been running below the 2 percent target for an extended period.

IMF-PhilllipsSo an IMF working paper “Did the global financial crisis break the US Phillips Curve?” is worth looking at.

Clearly, if confirmed, a changing or non-linear, relation between inflation and unemployment would have significant implications for monetary policy. While a linear Phillips curve warrants a symmetric monetary policy response with respect to business cycle conditions, a nonlinear Phillips curve, where inflation increases rapidly when unemployment rate declines below the natural rate may imply preemptive measures are needed to counter inflation when the economy is closer to potential. If, on the other hand, the Phillips curve is very flat monetary policy should react more strongly to unemployment movements, relative to inflation.

In this paper, we shed light on the forces and, possibly changing, dynamics between inflation and activity since the GFC. In other words, did the GFC break the U.S. Phillips curve? Moreover, we investigate three hypotheses which have recently been put forward as factors which could explain why inflation is currently low:

(a) Financial frictions, and shocks could imply slow recoveries and persistently low inflation.

(b) Globalization has increased the role of international factors and decreased the role of domestic factors in the inflation process in industrial economies. These hypotheses originated from the concerns of some monetary policymakers of an increasing disconnect between monetary policy on one side and domestic inflation and long-term interest rates on the other.

(c) the last hypothesis pertains to the inability of stabilization policy – due to the effective lower bound on policy rates – to lower real interest rates enough to bring the economy back to long-run sustainable levels and to achieve long-run inflation goals. Policymakers have emphasized how persistently low inflation poses substantial risks if monetary policy is constrained by the zero bound, and could derail the economic recovery .

Using extensive modelling they examine a series of “(possibly) nonlinear vector stochastic dynamic process(es)”. They took account of the Federal Reserve lowered the federal funds rate to the zero lower bound (ZLB) where it remained until December 2015. “Once the ZLB, or a negative Shadow Funds rate, is obtained, the perception, if applicable, that the funds rate reacts differently e.g. can fall no further, would be captured by switching in coefficients plus switching in shock variances such that adverse shocks to the Shadow funds rate are obtained. Second, there could be a change in the relationship between the federal funds rate and the term spread either directly because of the negative Shadow rates, or because of nonstandard monetary policy measures that stand in for conventional monetary policy. This is the main reason why the term spread is included as a variable in the model”. They conclude:

We use large BVAR’s, DFM’s and MS-VAR models to investigate the possibility of non-linearity in the recent post-crisis dynamic of inflation and unemployment rate in U.S. data. In other words, did the GFC break the U.S. Phillips curve? We also study what conditioning information set is informative for inflation and unemployment. We find that changes in shocks is a more salient feature of the data than changes in coefficients and a model with time-varying coefficients in the policy rule fits better than all other models that allow a change in coefficients. The model with coefficient switching in the simple instrument rule with variance switching in all equations attain the highest marginal data density.

Moreover, conditional forecasts which condition on external variables and financial risk variables seems to come closest to describing the dynamics of inflation while credit variables are the most important conditioning variables of the post-GFC unemployment rate.

We show that financial and external variables have the highest forecasting power for inflation and unemployment, post-GFC.

In other words, the Phillips curve is not broken, but is swamped by external factors, which makes it a less useful and authoritative tool. We cannot assume, all else being equal, that in the current economic climate, lower levels of unemployment will necessarily translate to higher inflation. We think the missing and critical factor is low, or falling real wages.

Note: IMF Working Papers describe research in progress by the author(s) and are published to elicit comments and to encourage debate. The views expressed in IMF Working Papers are those of the author(s) and do not necessarily represent the views of the IMF, its Executive Board, or IMF management.

IMF On UK’s Financial Stability

The latest IMF Report on the Financial System Stability Assessment on the United Kingdom warns on the impact of a Brexit, and underscored concerns that 16 per cent of the residential property market are investors (remember in Australia, our is more than double, at 35 per cent!).  The review assess the stability of the financial system as a whole and not that of individual institutions and was completed in June 2016 from visits to United Kingdom in November 2015 and in January-February 2016.

Property Sector

U.K. residential property prices reflect mostly long-standing supply-demand imbalances. While annual house-price growth slowed substantially between mid-2014 and mid-2015, it has accelerated again more recently, outpacing the growth of nominal GDP. This price growth largely reflects the realignment of relative prices of housing in light of tight supply constraints and growing demand. There is little evidence of a credit-fueled boom: the growth of mortgage lending and the number of housing transactions still remain well below their pre-crisis levels.UK-IMF-Prty-1At the same time, two particular segments of the property market show signs of overheating. First, lending in the buy-to-let sector has grown from 4 percent of mortgage stock in 2002 to 16 percent in mid-2015. In view of this, the FPC requested powers of direction over this sector. As the FPC already has these powers over the buy-to-own market, this would level the regulatory playing field for residential mortgages.

UK-IMF-Prty-2Second, the commercial real estate (CRE) market, has also been buoyant, with annual price growth around 10 percent as of mid-2015, although it has slowed somewhat in early 2016. The prices of prime U.K.—and especially prime London—CRE properties have grown rapidly since 2013. Although a recent analysis by the BoE shows that the overvaluation of CRE properties is limited to certain prime locations, continued rapid price growth could further reduce rental yields and increase the probability of price reversals. Credit risks to domestic banks from a CRE price reversal are reduced in comparison to the run-up to the 2008 crisis: U.K. banks have reduced their commercial real estate exposure, and international investors now account for more than half of CRE financing flows. But the sector can pose a macroeconomic risk since the majority of small and medium firms rely on CRE as collateral.

Their Overall Observations.

Since the last FSAP, the U.K. financial system has put the legacy of the crisis behind it and has become stronger and more resilient. Five years ago, the financial system had stabilized but still faced major residual weaknesses. This FSAP found the system to be much stronger and thus better able to serve the real economy. Like all systems, the U.K. financial system is exposed to risks. Given its size, complexity, and global interconnectedness, if these risks were to materialize they could have a major impact not only on the U.K. but also on the global financial system. Financial stability in the U.K. is thus a global public good. At the same time, understanding, mitigating, and staying a step ahead of the evolving risks in such a complex system is a constant analytical and policy challenge for U.K. policy-makers and regulators.

Its position as a global hub exposes the U.K. financial system to global risks. Regardless of the trigger, global shocks, such as a negative growth shock in emerging markets, a rapid hike in global risk premia, or renewed tensions in the eurozone, would impact significantly U.K. banks and, more broadly, the financial system as a whole. Moreover, as the domestic credit cycle matures while interest rates remain at historic lows, trends in some segments of the U.K. property market—notably buy-to-let and commercial real estate—could become financial stability risks.

In addition, the uncertainties associated with the possibility of British exit from the EU weigh heavily on the outlook. A vote in favor of leaving would usher in a period of uncertainty and financial market volatility during the negotiation of the terms of British exit, which could take years. And the eventual exit deal would have profound effects on trade and the real economy, the “passporting” arrangements for financial institutions, and the location decisions of major international financial firms now headquartered in London. Though highly uncertain, these effects would have major long-term implications for the U.K. financial sector, its contribution to the domestic economy, and its global standing. Needless to say, these economic aspects are only one element of the decision that is for British voters to make.

The main parts of the U.K. financial system appear resilient. At the core of the system, banks have more than doubled their risk-weighted capital ratios from pre-crisis levels, strengthened liquidity, and reduced leverage. Stress tests by both the BoE and the FSAP show that the largest banks would be able to meet regulatory requirements and sustain the capacity to finance the economy in the face of severe shocks. The possible impact of Brexit, however, though potentially significant, is inherently difficult to quantify and has not been covered in the stress tests. U.K. insurers, asset managers, and central counterparties (CCPs) also appear resilient, based on assessments by the BoE, FCA, European financial authorities, and the FSAP.

Despite the apparent resilience of individual sectors, interconnectedness across sectors has the potential to amplify shocks and turn sector-specific distress systemic. New patterns of interconnectedness are emerging due to structural market shifts and new entrants in some markets. These changes are not, by themselves, inherently risky. But they create a major challenge for the supervisors, who should upgrade their capacity and tools to connect the dots across sectors.

This resilience reflects to a large extent a wave of regulatory reforms since the crisis, which are now near completion. These were aimed at strengthening regulation and supervision, thus reducing the probability of failures; and lowering the cost of failures and safeguarding the taxpayer. They are aligned with the global regulatory reform agenda, where the U.K. has played a leading role, and were complemented by steps to enhance the governance and conduct of financial firms, as well as the decision to ring-fence retail banking and related services from riskier activities of U.K. banks. Many of these reforms correspond to the recommendations of the 2011 FSAP (Appendix I).

The first major plank of the reforms was to overhaul financial sector oversight and focus it on systemic stability. The new macroprudential framework provides clear roles and responsibilities, adequate powers and accountability, and promotes coordination across agencies. Its track record to-date, albeit short, is encouraging. Microprudential and conduct oversight have also become more rigorous and hands-on. The focus of supervisory effort and resources on the resilience of the most important firms is appropriate from a systemic perspective, but it inevitably implies less individual attention to small and mid-size companies, for which supervisors rely more on data monitoring, thematic reviews, and outlier analysis. This tradeoff warrants constant vigilance, because the business models of smaller firms tend to be correlated and, regardless of their systemic impact, failures of even small firms can be a source of reputational risk for the supervisor. In view of the downward trend of the ratio of risk-weighted to total assets and methodological inconsistencies across banks, internal models should be reviewed closely. A new, sophisticated framework for annual stress tests of major banks is a key link between the microprudential and macroprudential frameworks, but further investment is needed to ensure it can deliver on its ambitious goals.

The BoE’s new liquidity framework is a key shock absorber, and attendant risks seem adequately managed. By ensuring the Bank is “open for business” in the event of distress, the BoE’s flexible framework can help stop the propagation of a shock through liquidity contagion. Access by a broader range of entities, including broker-dealers and CCPs, is a major plus, made possible by the fact that all entities with access to the framework are supervised by the BoE and PRA. Because the relative ease of access to BoE liquidity risks distorting over time the incentives of participating firms, the BoE needs to monitor their behavior for signs of moral hazard or regulatory arbitrage.

The other major plank of the agenda was to ensure that the failure of a financial firm, regardless of its size, would not compromise financial stability or burden the taxpayer. The transposition of the EU Bank Recovery and Resolution Directive has completed the reform of the U.K.’s Special Resolution Regime for banks, which is now broadly aligned with global standards. The resolution powers, tools, and coordination arrangements for crisis management domestically and cross-border are now much stronger. The key challenge now is to complete the process that will facilitate the resolvability of U.K. financial firms. This is a complex, multi-year task that involves, inter alia, the implementation of ring-fencing and Minimum Requirements for Own Funds and Eligible Liabilities (MREL). The authorities should also build on current arrangements to develop operational principles for funding of firms in resolution and establish an effective resolution regime for insurance companies whose failure could be systemic. Finally, given the systemic role played by U.K. banks in smaller jurisdictions that are not part of the Crisis Management Groups (CMGs), the U.K. authorities should develop appropriate cooperation arrangements with such host countries.


Getting Government Debt In Perspective

A good piece in today’s The Conversation, examines the claim that the current government has lifted net government debt by $100 billion. This is proved to be correct, with caveats. However, some perspective is required in the debate. As highlighted in the piece, an important measure is debt to GDP. On that basis, on an international comparison, Australia is still well placed.

GDP Comparisons May 2016However, a recent report from LF Economics highlights that “while mainstream commentary and attention is firmly focused on public debt, the nation has accumulated a dangerously high level of private debt, including a moderately high level of external debt. Globally, Australia ranks near the top of indebted households. The exponential surge in mortgage debt issuance over the last two decades has generated the largest housing bubble in Australian economic history”. “Australia’s household debt ratio has grown above peaks established in countries where housing bubbles formed and burst, as in Ireland, Spain and the United States,” say report authors Philip Soos and Lindsay David. “So highly leveraged is the housing market that even small declines in residential land prices will have adverse consequences.”

Indeed, Australian households overtook the Swiss as the world’s most indebted this year, with outstanding debt equivalent to 125 per cent of GDP and no let up in sight. Combined owner-occupier and investor loans outstanding have risen from $1.2 trillion to $1.6 trillion in the past five years.

Here is the problem, the economic growth is being stoked by ever higher household debt, which is unsustainable. Why are we not getting better political discussion on this much more important issue during the election? The current economic path which has been set is unsustainable. The chart below makes the point – private debt should be the focus.

Australian Debt By CategoryAs we highlighted from the recent RBA chart pack, household debt to income is also sky high.

household-financesAnd here is data (from 2014) from the OECD showing the relative ratio of household debt to disposable income for Australia,  in comparison with other countries.

OECD-Debt-To-IncomeThe issue we SHOULD be talking about is the household debt overhang, and how we are going to deal with it. Government debt, in comparison is a side-show!

Neoliberalism: Oversold?

Instead of delivering growth, some neoliberal policies have increased inequality, in turn jeopardizing durable expansion, an article published by the IMF’s Finance and Development, by Jonathan D. Ostry, Prakash Loungani, and Davide Furceri states that the benefits of some policies that are an important part of the neoliberal agenda appear to have been somewhat overplayed.

Milton Friedman in 1982 hailed Chile as an “economic miracle.” Nearly a decade earlier, Chile had turned to policies that have since been widely emulated across the globe. The neoliberal agenda—a label used more by critics than by the architects of the policies—rests on two main planks. The first is increased competition—achieved through deregulation and the opening up of domestic markets, including financial markets, to foreign competition. The second is a smaller role for the state, achieved through privatization and limits on the ability of governments to run fiscal deficits and accumulate debt.­

There has been a strong and widespread global trend toward neoliberalism since the 1980s, according to a composite index that measures the extent to which countries introduced competition in various spheres of economic activity to foster economic growth. As shown in Chart 1, Chile’s push started a decade or so earlier than 1982, with subsequent policy changes bringing it ever closer to the United States. Other countries have also steadily implemented neoliberal policies.

ostry1_smlThere is much to cheer in the neoliberal agenda. The expansion of global trade has rescued millions from abject poverty. Foreign direct investment has often been a way to transfer technology and know-how to developing economies. Privatization of state-owned enterprises has in many instances led to more efficient provision of services and lowered the fiscal burden on governments.­

However, there are aspects of the neoliberal agenda that have not delivered as expected. Our assessment of the agenda is confined to the effects of two policies: removing restrictions on the movement of capital across a country’s borders (so-called capital account liberalization); and fiscal consolidation, sometimes called “austerity,” which is shorthand for policies to reduce fiscal deficits and debt levels. An assessment of these specific policies (rather than the broad neoliberal agenda) reaches three disquieting conclusions:

  • The benefits in terms of increased growth seem fairly difficult to establish when looking at a broad group of countries.­
  • The costs in terms of increased inequality are prominent. Such costs epitomize the trade-off between the growth and equity effects of some aspects of the neoliberal agenda.­
  • Increased inequality in turn hurts the level and sustainability of growth. Even if growth is the sole or main purpose of the neoliberal agenda, advocates of that agenda still need to pay attention to the distributional effects.­

The benefits of some policies that are an important part of the neoliberal agenda appear to have been somewhat overplayed. In the case of financial openness, some capital flows, such as foreign direct investment, do appear to confer the benefits claimed for them. But for others, particularly short-term capital flows, the benefits to growth are difficult to reap, whereas the risks, in terms of greater volatility and increased risk of crisis, loom large.­

In the case of fiscal consolidation, the short-run costs in terms of lower output and welfare and higher unemployment have been underplayed, and the desirability for countries with ample fiscal space of simply living with high debt and allowing debt ratios to decline organically through growth is underappreciated.

Moreover, since both openness and austerity are associated with increasing income inequality, this distributional effect sets up an adverse feedback loop. The increase in inequality engendered by financial openness and austerity might itself undercut growth, the very thing that the neoliberal agenda is intent on boosting. There is now strong evidence that inequality can significantly lower both the level and the durability of growth.

The evidence of the economic damage from inequality suggests that policymakers should be more open to redistribution than they are. Of course, apart from redistribution, policies could be designed to mitigate some of the impacts in advance—for instance, through increased spending on education and training, which expands equality of opportunity (so-called predistribution policies). And fiscal consolidation strategies—when they are needed—could be designed to minimize the adverse impact on low-income groups. But in some cases, the untoward distributional consequences will have to be remedied after they occur by using taxes and government spending to redistribute income. Fortunately, the fear that such policies will themselves necessarily hurt growth is unfounded.­

These findings suggest a need for a more nuanced view of what the neoliberal agenda is likely to be able to achieve. The IMF, which oversees the international monetary system, has been at the forefront of this reconsideration.­

For example, its former chief economist, Olivier Blanchard, said in 2010 that “what is needed in many advanced economies is a credible medium-term fiscal consolidation, not a fiscal noose today.” Three years later, IMF Managing Director Christine Lagarde said the institution believed that the U.S. Congress was right to raise the country’s debt ceiling “because the point is not to contract the economy by slashing spending brutally now as recovery is picking up.” And in 2015 the IMF advised that countries in the euro area “with fiscal space should use it to support investment.”

On capital account liberalization, the IMF’s view has also changed—from one that considered capital controls as almost always counterproductive to greater acceptance of controls to deal with the volatility of capital flows. The IMF also recognizes that full capital flow liberalization is not always an appropriate end-goal, and that further liberalization is more beneficial and less risky if countries have reached certain thresholds of financial and institutional development.­

Chile’s pioneering experience with neoliberalism received high praise from Nobel laureate Friedman, but many economists have now come around to the more nuanced view expressed by Columbia University professor Joseph Stiglitz (himself a Nobel laureate) that Chile “is an example of a success of combining markets with appropriate regulation” (2002). Stiglitz noted that in the early years of its move to neoliberalism, Chile imposed “controls on the inflows of capital, so they wouldn’t be inundated,” as, for example, the first Asian-crisis country, Thailand, was a decade and a half later. Chile’s experience (the country now eschews capital controls), and that of other countries, suggests that no fixed agenda delivers good outcomes for all countries for all times. Policymakers, and institutions like the IMF that advise them, must be guided not by faith, but by evidence of what has worked.­


Global House Price Index Falls – IMF

The IMF Quarterly Update includes an update of the Global House Price Index.  In Australia, the aggregate house price index has been rising in a strong but volatile pattern for the past twenty-five years, and has enjoyed a particularly strong burst of growth since 2013. However, house prices in Perth—surrounded by major mining and petroleum industries and known for providing services to these industries—are declining.

After sixteen quarters of inching upwards, the global house price index shows a small downtick. But it is too soon to tell if this is a reversal in trend.

IMF-Apr-01Over the past year, many more countries have registered house price increases than declines. Australia is the eighth highest (well behind New Zealand!)

IMF-Apr-16-02Credit growth has also remained strong in many countries, though the overall correlation with house price growth at present is modest. Australia is twelfth, behind USA and Norway.

IMF-Apr-16-03Among OECD countries, house prices have grown faster than incomes ( Australia ninth highest) and rents since 2010 in about half the countries (Australia twelfth highest).

IMF-Apr-16-04IMF-Apr-16-05The decline in commodity prices does not seem to be affecting national house prices but is having some effect in regions and cities within countries.

IMF-Apr-16-06