So Just How Sensitive Are Property Investors To Rising Interest Rates Now?

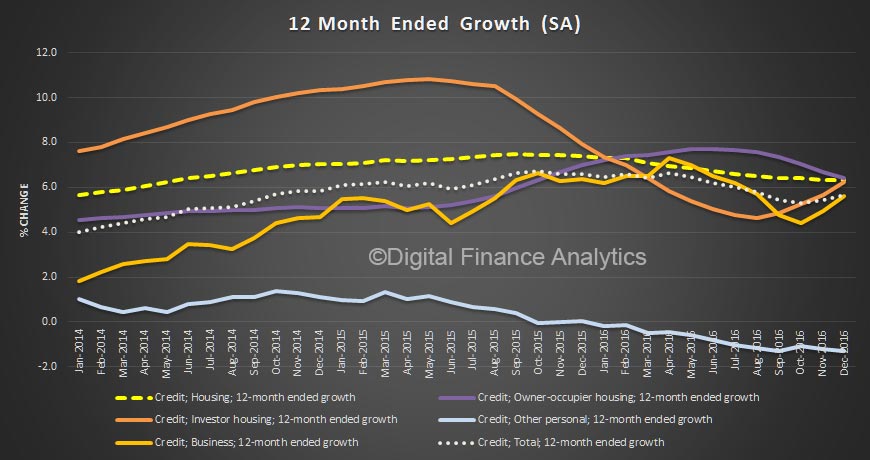
Having looked at changes in investment loan supply, and the motivations of the rising number portfolio property investors, today we use updated data from our rolling household surveys to look at how property investors are positioned should mortgage rates rise. In fact, for many, rates have already been raised, thanks to lender repricing independent of any RBA cash rate move, some as much as 65 basis points. We think there is more to come, as loan supply gets tighter, international financial markets tighten and competitive dynamics allows for hikes to cover capital costs and to bolster margins.

To assess the sensitivity we model households ability to service mortgage debt, taking into account their other outgoings, and rental income.  We are not here looking at default risk, but net cash flow. How high would rates rise before they were under pressure? Where they also have owner occupied loans, or other debts, we take this into account in our assessment.

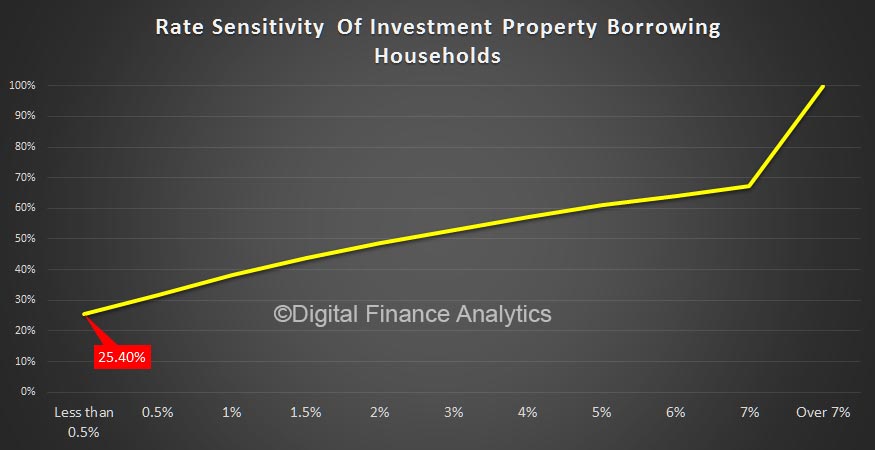
The first chart is a summary of all borrowing investor households. The horizontal scale is the amount by rates may rise, and for each scenario we make an assessment of the proportion of households impacted, on a cumulative basis. So as rates rise, more households would feel pain.

The summary shows that nationally around a quarter of households would struggle with a rate hike of up to 0.5%, and as rate rose higher, this rises to 50% with a 3% rate rise, though 40% could cope with even a rise of 7%.

So a varied picture. But it gets really interesting if you segment the analysis. Those who follow DFA will know we are a great believer in segmentation to gain insight!

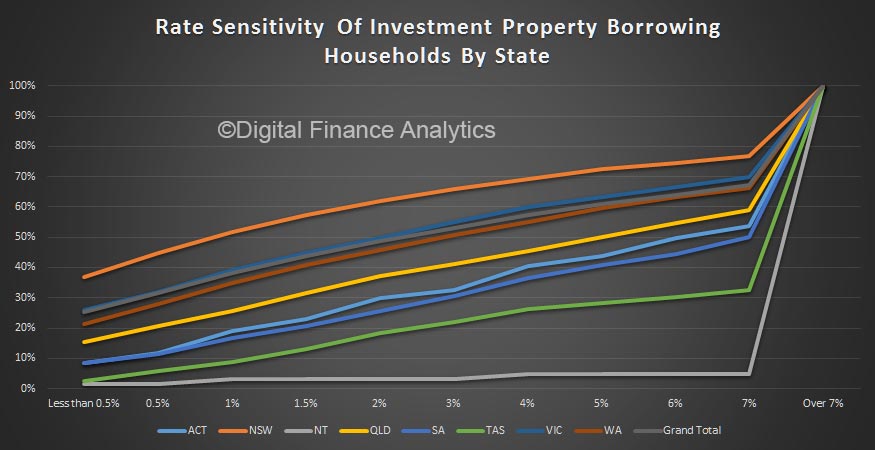
A state by state analysis shows that households in NSW are most exposed to a small rate rise, with 36% estimated to be under pressure from a 0.5% rise (explained by large mortgages and static rental yields), compared with 2% in TAS.

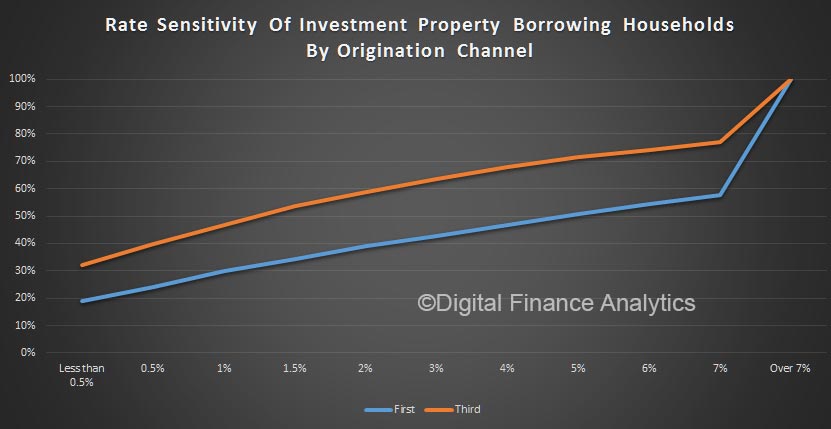
Origination channel makes a difference, with those who used a mortgage broker or advisor (third party) more exposed compared with those who when direct to a lender. The pattern is consistent across the rate rise bands.  This could be explained by brokers knowing where to go to get the bigger loans, or the type of households going to brokers.

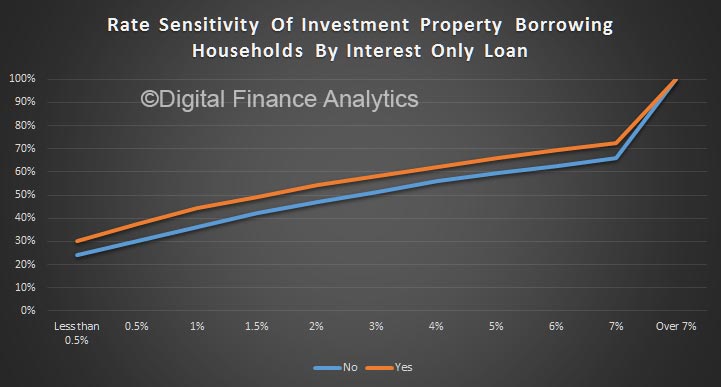
Households with interest only loans are 6% more exposed to a small rise, and this gap remains across our scenarios. No surprise, as interest only loans are more sensitive to rate movements. We have not here considered the tighter lending criteria now in play for interest only lending.

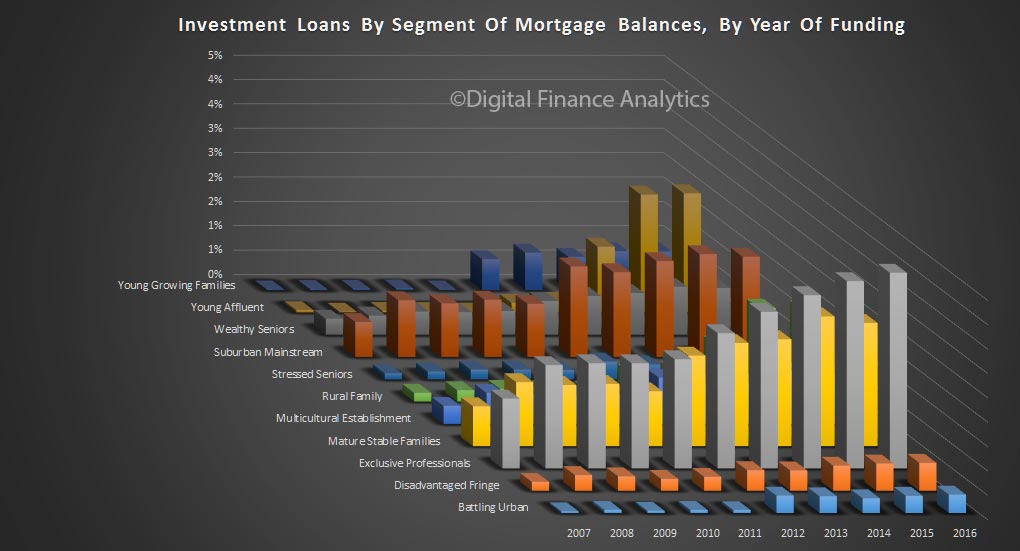
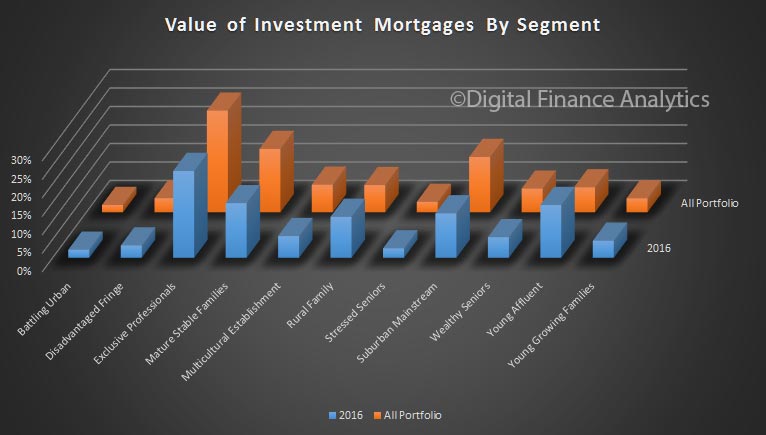
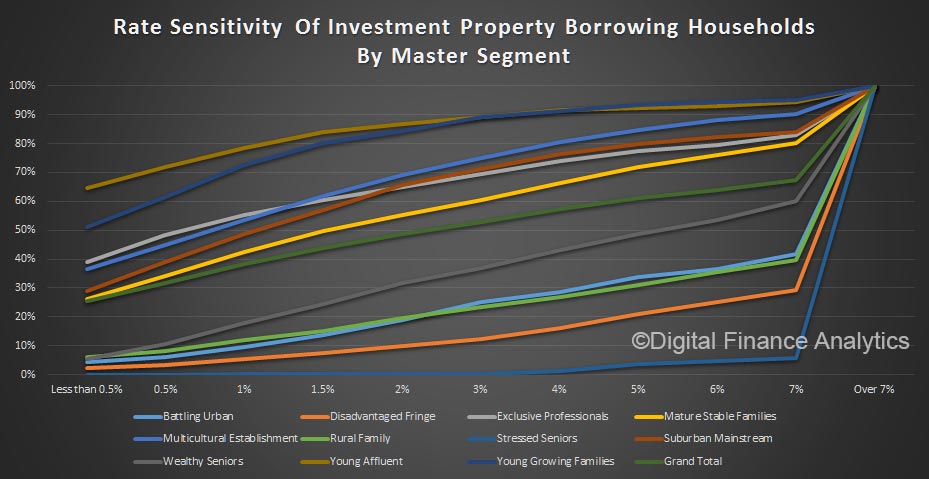
Our master segmentation reveals that it is Young Affluent and Young Growing Families who are most exposed, followed by Exclusive Professionals. Some of the more affluent are portfolio investors, so are more leveraged, despite larger incomes.

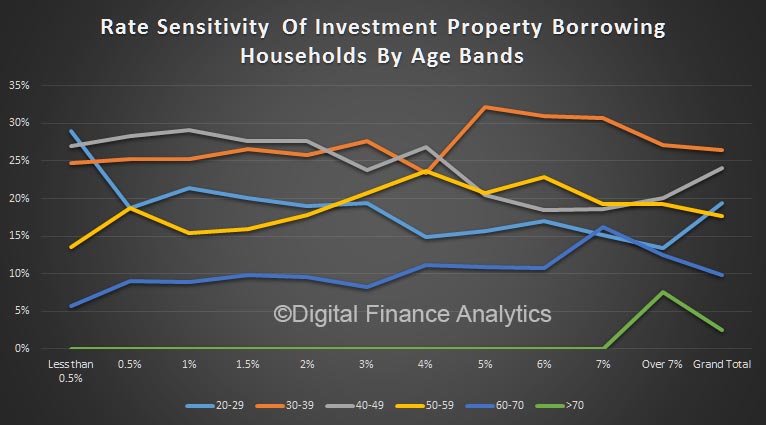
Finally, we can present the age band data, which shows that those aged 40-49 have the greatest exposure as rates rise, though young households are most sensitive to a small rise.  Note this does not reveal the relative number of investor across the age groups, just their relative sensitivity.

This all suggests that lenders need to get granular to understand the risks in the portfolio. Households need to have a strategy to prepare for rate rises and should not be fixated on the capital appreciation, at the expense of cash flow management, especially in a rising rate environment.

Is This Why CBA Has Cut Back Its Investment Lending?

As a follow-up from our recent post, this chart may explain why CBA has been forced to trim its investment housing lending sails.

If you annualise the monthly net movements in investment loan stock, in December CBA came out at 10.3%, above the 10% APRA imposed speed limit. Also, clearly the growth trend was upwards.

Further evidence to our hypothesis that the regulator picked up the phone, and suggested they should trim their growth. It also shows that the remaining majors need to be a little careful, but there is headroom in the system to take up some of the slack. It will be interesting to see how this plays out.

Of course the APRA data is full of noise thanks to ongoing loan reclassification, but the trend is pretty clear.


CBA suspends some investor home lending

From AAP.

The Commonwealth Bank will stop accepting refinancing applications for investment home loans from next week.

The bank has written to mortgage brokers on Wednesday to advise of the suspension, which takes place from Monday, February 13.

In its message, the bank says it is committed to “upholding the highest level of professional standards, and meeting our responsible lending and regulatory obligations” and it will suspend the acceptances “to ensure we continue to meet our commitments”.

Investor and owner-occupier loan applications will not be affected and investor refinance applications submitted prior to February 13 will be processed as usual.

The decision comes a day after CBA’s subsidiary, Bankwest, said it had stopped accepting new business from customers seeking to refinance their investor home loans.


APRA Says Banks Home Lending Up In December … But

APRA has released their monthly banking statistics, which shows the portfolio movements of the major banks. Total lending for housing was up 0.68% to $1.52 trillion, with owner occupied lending up 1% to $987 billion and investment lending up 0.06% to $537 trillion. But there are adjustments in these numbers which make them pretty useless, especially when looking at the mix between investment and owner occupied loans.

The trend here is quite different from the RBA data also out today, which showed growth of 0.8% for investment loans and 0.4% for owner occupied loans (and includes non-banks in these totals). A quick look at the monthly movements shows that there was a significant ($3bn+) adjustment at ING, which distorts the overall picture. No explanation from APRA, and this movement is much bigger than the $0.9 billion net figure the RBA mentioned in their release.

For what it is worth, here is the sorted 12 month growth trend by lending, showing the 10% “hurdle”. ING is to the right of the chart thanks to their adjustment.

But the point is, we really do not know where we stand as i) data quality from the banks is still poor, and ii) the regulators are unable to provide a reconciled and transparent picture of lending. Given the debate about housing affordability, we need better and consistent data to aid the debate.

Credit Growth Strong In December; But By How Much?

The RBA released their Credit Aggregates to December 2016 today.  Total housing was a new record at $1.62 trillion.

The headline statement from the RBA says housing grew 0.5% in the month and 6.3% annually, personal credit fell 0.1%, down 1.3% annually, and business credit role 1.1% in December, making 5.6% annually. All these are well above inflation, and wage growth.

Within housing, investment lending continued to grow up 0.8%, compared with 0.4% for owner occupied lending, making annual changes of 6.2% and 6.4% respectively.  So, once again we see growth in the investment sector moving up, which is in line with our surveys.

The monthly data shows the spike in both investment lending for housing and other business lending. This dataset, says the RBA has been adjusted for series breaks, to reflect as accurate picture as possible.

Now, things get interesting if we look at the more detailed data, which does not include series adjustments, although they are seasonally adjusted. Clearly there was further switching between loan categories.

Total lending for housing rose to $1.62 trillion, up $14 billion in the month. This is a new record and is up 0.88% from last month. On these figures, owner occupied loans grew 0.9% ($9.4 billion) and investment loans grew 0.84% ($4.68 billion). We see variations in the personal credit series too, with borrowing up 0.1% in the month, by $0.15 billion to $144 billion; business credit rose by 1.29% or $11.2 billion to $879.8 billion. But there is no way we can reconcile the two data series, so actually, we just have to take the RBA’s word on the figures – hardly open and transparent. Perhaps they prefer to paint the lower “adjusted figure” to support their view all is well in the housing lending sector, but it is mighty strange to have such varied outcomes.

We also see the proportion of housing lending for investment purposes remained at 34.8% of all lending, still too high in our view and the proportion of lending to business rose a little to 33.2% of all lending. We are still over leveraged into housing generally, and to investment housing in particular.

The RBA noted:

All growth rates for the financial aggregates are seasonally adjusted, and adjusted for the effects of breaks in the series as recorded in the notes to the tables listed below. Data for the levels of financial aggregates are not adjusted for series breaks. Historical levels and growth rates for the financial aggregates have been revised owing to the resubmission of data by some financial intermediaries, the re-estimation of seasonal factors and the incorporation of securitisation data. The RBA credit aggregates measure credit provided by financial institutions operating domestically. They do not capture cross-border or non-intermediated lending.

Following the introduction of an interest rate differential between housing loans to investors and owner-occupiers in mid-2015, a number of borrowers have changed the purpose of their existing loan; the net value of switching of loan purpose from investor to owner-occupier is estimated to have been $48 billion over the period of July 2015 to December 2016, of which $0.9 billion occurred in December 2016. These changes are reflected in the level of owner-occupier and investor credit outstanding. However, growth rates for these series have been adjusted to remove the effect of loan purpose changes”.

We will discuss the APRA monthly banking stats later.

More than 50% Investment Lending In NSW

From CoreLogic.

The Australian Bureau of Statistics (ABS) released lending finance earlier today and when it is paired with the earlier housing finance data release, the figures provide insight into the value of mortgage lending over the month in each state and territory.  Over recent months investor demand for mortgages has been trending higher and this is being largely driven by resurgent investor demand in New South Wales and Victoria.  Of course the capital cities of these two states have consistently recorded the strongest value growth of all capital cities over the past five years and also have the lowest rental returns.

The data analysed is based on the value of mortgage finance commitments.  Given this it is important to consider that more expensive markets (such as NSW) will tend to result in borrowers taking out larger mortgages whereas borrowers in more affordable markets will generally take out smaller mortgages.  More than half of all the mortgage lending to investors in November 2016 was lent in New South Wales and with a further 24.5% in Victoria, three quarters of all mortgage lending to investors occurred in the two most populous states.

Looking only at new lending (that is excluding refinances) investors accounted for 56.7% of the value of lending in New South Wales in November 2016.  Looking over the past four years, the value of new lending to investors in New South Wales has been greater than new owner occupier lending for 42 of the past 48 months.  Victoria was previously seeing slightly more than 50% of new lending to investors but was recorded at 45.0% in November 2016.  Across the remaining states and territories, the proportion of total new lending to investors in November 2016 was recorded at: 39.7% in Queensland, 37.1% in South Australia, 31.0% in Western Australia, 26.1% in Tasmania, 40.3% in the Northern Territory and 38.7% in the Australian Capital Territory.

It’s clear that demand for mortgages from the investor segment is picking up, particularly in New South Wales and Victoria, which are proxies for Sydney and Melbourne respectively.  With a low cost of borrowing and many owner occupiers having seen substantial increases in housing equity in Sydney and Melbourne over the past 4.5 years it is easy to understand why investor demand is rising.  On the other side of things, you have a value growth phase that has now run for 4.5 years, largely focussed on two major cities and rental returns at historic low levels in these cities.  Investors should be considering the potential risks, especially as housing supply is responding and that the value growth phase is now quite mature.  While many have seen a substantial increase in the value of properties and may continue to do so, at some point growth will slow.  With record low yields, slow rental growth and additional housing supply entering the market over the coming years, if investors need to start relying on rental returns rather than increase in the asset value, boosting those returns is likely to prove difficult.

Investment Mortgages, a 10-Year View

Continuing our series on the 10-year data from our household surveys, today we look at the investment mortgage portfolio. We find some interesting variations compared with the owner occupied borrowing segments, which we discussed recently.

In value terms, 28% of the portfolio is held by exclusive professionals, 15% to suburban mainstream, 14% mature stable families, 10% to young affluent, 9% to rural and 5% to young growing families.  19% of the portfolio was written in 2016.

In 2016, 23% of the loans were to the exclusive professional segment, 14% to young affluent, 11% to rural, 17% to mature stable families, 12% to suburban mainstream, and 5% to young growing families.  Young affluent households were more active last year, than across the entire portfolio.

In 2016, the average value of the mortgage to exclusive professionals for investment purposes was $982,360 compared with $536,193 for young affluent, $652,812 for mature stable families and $412,924 for young growing families.

The analysis shows the penetration of investment properties touches most segments, but is also shows a skew towards more affluent groups.

Is Business Lending Momentum On The Turn?

The latest data from the ABS, Lending Finance for October 2016, shows total credit flows in October were $68.1 billion, up 0.72% compared with last month, in the more reliable trend terms. Within that, the total value of owner occupied housing commitments excluding alterations and additions fell 0.5% in trend terms, to $19.7 billion. Alterations and additions, fell 0.5%.

The trend series for the value of total personal finance commitments fell 1.2%. Revolving credit commitments fell 3.5%, while fixed lending commitments rose 0.1%. Total personal finance flows fell to $6.6 billion.

The trend series for the value of total commercial finance commitments rose 1.7% to $40.9 billion. Fixed lending commitments rose 2.0% to $32.8 billion and revolving credit commitments rose 0.4% to $8.1 billion

The trend series for the value of total lease finance commitments rose 0.1% in October 2016 and the seasonally adjusted series fell 11.8%, after a rise of 10.1% in September 2016.

What is possibly significant is that within the fixed business lending category, we have a combination of lending for investment property and lending for other business purposes. We are beginning to see a rise in other business lending, alongside lending for investment property. We need to see more of the former, and less of the latter.

Lending for investment property rose 1.5% to $12.5 billion, whilst lending for other business purposes rose 2.3% to $20.3 billion. As a result, the share of lending for business (other than for investment property) rose, whilst the share of commercial lending for investment property fell from 38.2% to 38%.

Looking at the investment property data, investors were hot to trot in Sydney, and Melbourne. Much of the investment property remains in these two centres.

ANZ Lifts Variable Investment Property Rates

ANZ today announced its variable Residential Investment Property Loan Index Rate would increase by 0.08%pa to 5.60%pa in response to rising funding costs and changing market conditions.

There is no change to ANZ’s standard variable rate for owner-occupier home loans.

Fixed rates remain unchanged for both investors and owner occupiers.

ANZ Group Executive Australia Fred Ohlsson said: “Despite residential investor rates remaining at historic low levels, this was a difficult decision that took into account increases in our funding costs and our regulatory obligation to manage a balanced portfolio.

“There are no changes to our variable rates for owner-occupier home loans. Customers concerned about the long-term direction of interest rates are able to take advantage of our competitive fixed rates that remain unchanged for both investors and owner-occupiers,” Mr Ohlsson said.

ANZ will also increase its Equity Manager Account rate by 0.15%pa to 5.82%pa. All changes are effective 16 December.

NAB residential investor home loan variable interest rates to change

NAB has said it will increase its variable rates on new and existing residential investor home loans by 0.15% per annum, effective from Monday 12 December 2016.

nab-pic

This will mean NAB’s Variable Rate for Residential Investment Home Loans will be 5.55% per annum.

There is no change to NAB’s Variable Rate for Home Loans (Standard Variable Rate) for owner occupier customers, which remains at 5.25% p.a.

NAB Chief Operating Officer, Antony Cahill, said NAB takes a disciplined approach to managing its entire portfolio, and needs to make adjustments to ensure it continues to lend responsibly and sustainably to all customers.

“We don’t make these decisions lightly, and these changes reflect the increasingly challenging environment we are currently operating in as we seek to meet the needs of all our customers and our shareholders,” Mr Cahill said.

“As was evident during the recent bank reporting season, net interest margins – the difference between what we pay to borrow funds to lend to our customers and what our customers pay – are down, particularly in home lending, and they remain under pressure.

“A low-rate environment poses considerable challenges to all lenders, and we must respond to what is happening in the economy and the market. In doing so, we have to consider a range of factors including the ongoing need to hold longer-term stable sources of funding, continued elevated funding costs, regulatory requirements, and the competitive pressures at play.

“We will continue to regularly review our products and pricing, and make decisions that enable us to achieve a balance for all stakeholders – borrowers wanting to buy a home or grow their business, depositors and investors seeking a return on their investment, and our shareholders who rely on our dividends.”

Earlier this year, NAB made changes to the way it prices its home loans based on loan purpose and repayment type.

“We can now be more specific in how we manage our entire home lending portfolio in line with economic conditions and regulatory requirements,” Mr Cahill said.

He said the investor segment continues to be important to NAB, and interest rates for all home buyers are around their lowest levels in more than 50 years.

“NAB is committed to providing customers with great value and service, and home loan products that suit their needs at a competitive price,” Mr Cahill said.

NAB continues to offer highly competitive fixed rate terms, and borrowers seeking certainty about their repayments may want to consider fixing part or all of their home loan.

“Switching to a fixed rate loan is a straightforward and easy process, and I encourage borrowers to speak with their banker or broker to find out more about what’s available, and if a fixed rate home loan might be right for their circumstances.

“We’re here to help our customers as they make choices about which product may best suit their needs,” Mr Cahill said.

Conditions, fees and eligibility criteria apply to NAB’s products. Customers who want to know more about these changes are encouraged to contact their banker about what works best for them.