Major banks reduce maximum loan amounts

In the September 2015 edition of the Property Imperative, DFA highlighted the impact of reductions in loan values being offered, as lenders tightened their lending criteria and affordability guidelines. This trend has been confirmed in more recent media reports, and will potentially make it difficult for some refinancing borrowers to get the loans they need, and further dampen property demand and prices. It will also make the on-ramp for first time buyers even steeper.

According to Australian Broker,

“Major banks have significantly reduced the amount they are prepared to lend home buyers, a new analysis by leading brokerage Home Loan Experts has revealed.

A couple with a combined income of $120,000 purchasing an investment property can now borrow up to $80,000 less from a major bank than they could a year ago, according to the calculations published in a report by the Sydney Morning Herald.

Investment property buyers aren’t the only ones affected either. The maximum loan size for the same hypothetical couple buying an owner-occupied home has fallen by up to $65,000, according to the Sydney-based brokerage’s calculations.

According to the Sydney Morning Herald report, the calculations were based on the borrowing power or maximum loan amount for a couple earning $60,000 each, with two children. The comparison compared December 2014 with December 2015 and included Commonwealth Bank, National Australia Bank and Westpac. The broker was not able to access comparative figures for ANZ from 2014.

Commonwealth Bank, for example, would have lent $640,000 as a housing investment loan a year ago, compared with $560,000 now — an $80,000 reduction.

Westpac would have lent the couple buying an owner-occupied home $645,000 a year ago, but this amount has fallen to $580,000 — a $65,000 reduction.

Home Loan Experts mortgage broker Christina Parnham told the Sydney Morning Herald that the maximum loan amount has been reduced because banks are requiring borrowers be tested against how they would cope with higher interest rates.

“You’re going to have to be able to service the loan at about 7.5 to 8%,” she said.

At the same time, Farnham says banks have adopted more conservative assumptions about living expenses”

Home Lending More Risky – APRA

Wayne Byres, Chairman APRA, “Banking On Housing“, speech today, portrayed the current state of play with regards to supervision of housing lending.  He started by noting that housing lending now accounts for around 40 per cent of banking industry assets, and a little under two-thirds of the aggregate loan portfolio. With such a concentration in a single business line, we are all banking on housing lending remaining ‘as safe as houses’.

IMF-Home-LoansSupervision is important, he say’s given the high household debt involved. As with housing prices, these debt levels are at the higher end of the spectrum. Furthermore, after plateauing for much of the past decade, the household debt-to-income ratio has begun drifting upwards again. Households still have a significant (and growing) net worth, as housing assets are increasing in value faster than debt. Nevertheless, the trends in overall level of debt bear watching.Debt-to-IncomeHe acknowledges the change in mix of loans, with the growth of investor loans.

Turning to the composition of loan portfolios, a notable change has been the well-publicised growth in lending to investors. In terms of the outstanding stock of housing lending, investors account for more than one-third; of the current flow of approvals, investors now account for more than 40 per cent. For comparison, in the mid-1990’s both those proportions were around half today’s levels.

A key question is: does this compositional shift change portfolio risk profiles? Australian data suggests that there has been little difference in the propensity of investor loans to become impaired, vis-à-vis those to owner-occupiers. However, caution is needed given the lack of any period of severe household stress over the past two decades: evidence from other countries suggests we should be wary of extrapolating the current Australian experience into more stressful scenarios.

Of course, it is not just the nature of the borrower, but also the growth in lending, that acts as a warning sign for supervisors. When we wrote to ADIs in December 2014, we flagged a benchmark for investor lending growth of 10 per cent, or higher, as a sign of increased risk. We highlighted investor lending because it was an area of accelerating credit growth and strong competition: a combination in which the temptation to compete and protect market share could drive a weakening of credit standards. By moderating growth aspirations, we are reducing the tendency for ADIs to whittle away lending standards in the name of ‘matching our competitors’ – when it comes to lower standards, it’s always the other guy’s fault.

He highlighted the rising share of loans originated via brokers.

Third-PartyAnother feature of the home lending market has been the increasing use of third-party distribution channels. There are potentially significant advantages from such an approach: for example, allowing smaller lenders or new entrants to compete more readily against the established branch networks of the bigger players. On the other hand, third-party-originated loans tend to have a materially higher default rate compared to loans originated through proprietary channels. This does not mean third-party channels have lower underwriting standards, but simply that the new business that flows through these channels appears to be of higher risk, and must be managed with appropriate care.

He also described the rise in interest only loans, and changes in LVR ratios as highlighted in yesterdays APRA data, which we discussed in detail already.

Finally, he discussed lending standards.

The final layer of analysis has been our detailed review of lending standards at individual lenders. We published some conclusions from this in May,6 and highlighted a few areas where standards were not what they could or should be. Examples included, generous interpretations of the stability and reliability of borrowers’ incomes; borrowers assumed to have very meagre living expenses; and/or a reliance on interest rates not rising very much, or (more puzzlingly) rising on new debts but not existing ones.

ASIC’s recently announced review of interest-only home lending made similar findings.

The industry has responded with improved practices in the past few months. For example, it is now commonplace for lenders to apply a haircut to unstable sources of income, and to assume a minimum interest rate of around 7.25 per cent – well above rates currently being paid – when assessing a borrower’s ability to service a loan. These steps should give greater comfort about the quality of new business now being written.

However, a close eye will need to kept on policy overrides – in other words, the extent to which lenders approve loans outside their standard policy parameters. There are some definitional issues that mean care is needed with this data, but the rising trend for loans to be approved outside policy needs to be watched: as lenders strengthen their lending policies, it’s important to make sure this good intent isn’t being undone by an increasing number of policy exceptions.

OutsideServiceBefore I wrap up, I’d like to comment on the potential for further action by APRA, including targeted measures that, it has been suggested, we should employ to specifically respond to rising housing prices in Sydney and Melbourne. In response, I would make three points:

First, our mandate is to preserve the resilience of the banking system, not to influence prices in particular regions; second, the broader environmental factors I outlined at the start of my remarks – high housing prices, high debt levels, low interest rates and subdued income growth – are not present only in our two largest cities; and
third, sound lending standards – prudently estimating borrower income and expenses, and not assuming interest rates will stay low forever – are just as important (and maybe even more so) in an environment where price growth is subdued as they are in markets where prices are rising quickly.

That is not to say that geographic measures would never be contemplated. Parallels are often drawn with New Zealand, where specific measures have been directed at the rapid price appreciation in Auckland. In comparing the respective actions on both sides of the ditch, it’s important to note the Reserve Bank of New Zealand (RBNZ) initiated measures for Auckland only after first instituting a range of measures that applied New Zealand-wide. In other words, more targeted measures built on, rather than substituted for, measures to reduce financial stability risks nationally.

Given many changes to lenders’ policies, practices and pricing are still relatively recent, it is too early to say whether further action might be needed to preserve the resilience of the banking system. We remain open to taking additional steps if needed, but from my perspective the best outcome will be if lenders themselves maintain a healthy dose of common sense in their lending practices, and reduce the need for APRA to do more.


Bank Profits Were $35.2 billion to March 2015

APRA released their quarterly ADI performance statistics to end March 2015 today. Over the year ending 31 March 2015, ADIs recorded net profit after tax of $35.2 billion. This is an increase of $3.0 billion (9.4 per cent) on the year ending 31 March 2014.

The most telling data relates to the relationship between loans and capital. We look at the big four,  who dominate the market. Home loans continue to grow as a proportion of total assets. The major banks have $1.42 trillion of housing, out of total assets of $2.27 trillion – 62.4% of all loans are housing related. Now, because of the generous “risk weighted” calculation, whilst the tier 1 capital ratio has moved higher for the 4 big banks, to 10.8%, if you look at shareholder funds (not risk weight adjusted) we see that the ratio of shareholder funds to total loans is lower now than its been for some time, and is continuing to fall. So the banks are using less of their own funds to grow their balance sheet and hold less in reserve for a rainy day. This is why there is a discussion about the right increases in capital weightings.

APRAMarch2015
More generally, at 31 March 2015, the total assets of ADIs were $4.5 trillion, an increase of $519.9 billion (13.1 per cent) over the year. The total capital base of ADIs was $228.1 billion at 31 March 2015 and risk-weighted assets were $1.8 trillion at that date. The capital adequacy ratio for all ADIs was 12.7 per cent.

  • major banks had total assets of $3.50 trillion as at 31 March 2015, 78.0 per cent of the industry total;
  • other domestic banks had total assets of $397.7 billion, 8.9 per cent of the industry total;
  • foreign subsidiary banks had total assets of $115.1 billion, 2.6 per cent of the industry total; and
  • foreign branch banks had total assets of $404.1 billion, 9.0 per cent of the industry total.

The remainder of the industry total assets were held by building societies, credit unions and other ADIs, with $68.0 billion, 1.5 per cent of the industry total.

For all ADIs*, as at 31 March 2015:

  • Gross loans and advances were $2.80 trillion. This is an increase of $71.6 billion (2.6 per cent) on 31 December 2014 and an increase of $227.2 billion (8.8 per cent) on 31 March 2014.
  • Total liabilities were $4.22 trillion. This is an increase of $137.8 billion (3.4 per cent) on 31 December 2014 and an increase $504.3 billion (13.6 per cent) on 31 March 2014.
  • Total deposits were $2.46 trillion. This is an increase of $50.9 billion (2.1 per cent) on 31 December 2014 and an increase $196.1 billion (8.7 per cent) on 31 March 2014.
  • The net loans to deposits ratio was 112.6 per cent for the year ending 31 March 2015, an increase from 111.7 per cent for the year ending 31 March 2014.

Capital adequacy

The Common Equity Tier 1 capital ratio for all ADIs (excluding foreign branch banks and ‘other ADIs’) was 9.2 per cent as at 31 March 2015. This is an increase on 31 December 2014 (9.1 per cent) and 31 March 2014 (9.1 per cent).

The Common Equity Tier 1 capital ratio as at 31 March 2015 for each segment was:

  • 8.8 per cent for major banks (an increase from 8.7 per cent at 31 December 2014);
  • 9.6 per cent for other domestic banks (an increase from 9.3 per cent);
  • 15.1 per cent for foreign subsidiary banks (unchanged 31 December 2014);
  • 16.9 per cent for building societies (a decrease from 17.1 per cent); and
  • 15.7 per cent for credit unions (unchanged 31 December 2014).

The Tier 1 capital ratio for all ADIs (excluding foreign branch banks and ‘other ADIs’) was 11.0 per cent as at 31 March 2015. This is an increase on 31 December 2014 (10.8 per cent) and 31 March 2014 (10.8 per cent).  The Tier 1 capital ratio as at 31 March 2015 for each segment was:

  • 10.8 per cent for major banks (an increase from 10.6 per cent at 31 December 2014);
  • 10.9 per cent for other domestic banks (an increase from 10.6 per cent);
  • 15.1 per cent for foreign subsidiary banks (a decrease from 15.1 per cent);
  • 16.9 per cent for building societies (a decrease from 17.1 per cent); and
  • 15.9 per cent for credit unions (an increase from 15.8 per cent).

Impaired assets and past due items were $27.8 billion, a decrease of $5.9 billion (17.5 per cent) over the year. Total provisions were $14.4 billion, a decrease of $5.8 billion (28.9 per cent) over the year.

Impaired facilities were $15.2 billion as at 31 March 2015. This is a decrease of $0.7 billion (4.2 per cent) on 31 December 2014 and a decrease of $6.4 billion (29.7 per cent) on 31 March 2014. Impaired facilities as a proportion of total loans and advances was 0.5 per cent as at 31 March 2015. This is a decrease from 31 December 2014 (0.6 per cent) and a decrease from 31 March 2014 (0.8 per cent).

Past due items were $12.5 billion as at 31 March 2015. This is an increase of $1.1 billion (9.6 per cent) on 31 December 2014 and an increase of $534 million (4.4 per cent) on 31 March 2014. Total provisions held were $14.4 billion as at 31 March 2015. This is a decrease of $0.6 billion (4.0 per cent) on 31 December 2014 and a decrease of $5.8 billion (28.9 per cent) on 31 March 2014.


APRA On Lending Standards And Capital

APRA’s Wayne Byres today spoke at the COBA CEO & Director Forum in Sydney. His speech was entitled ‘Sound lending standards and adequate capital: preconditions for long-term success’. He highlights some interesting behaviourial differences between banks when it comes to the appraisal of mortgage loans, and also talks (and reinforces APRA’s position) with regards to capital measures.

I’d like to use my time today to talk about two issues of relevance to all ADIs: credit risk and capital. In the world of banking supervision, these are at the heart of what we do: credit risk because it is far and away the biggest risk that ADIs take on, and capital because it is a critical form of defence for when those risks go awry. Sound lending and adequate capital do not guarantee long-run success, but they are certainly a precondition for it.

Reinforcing sound lending standards

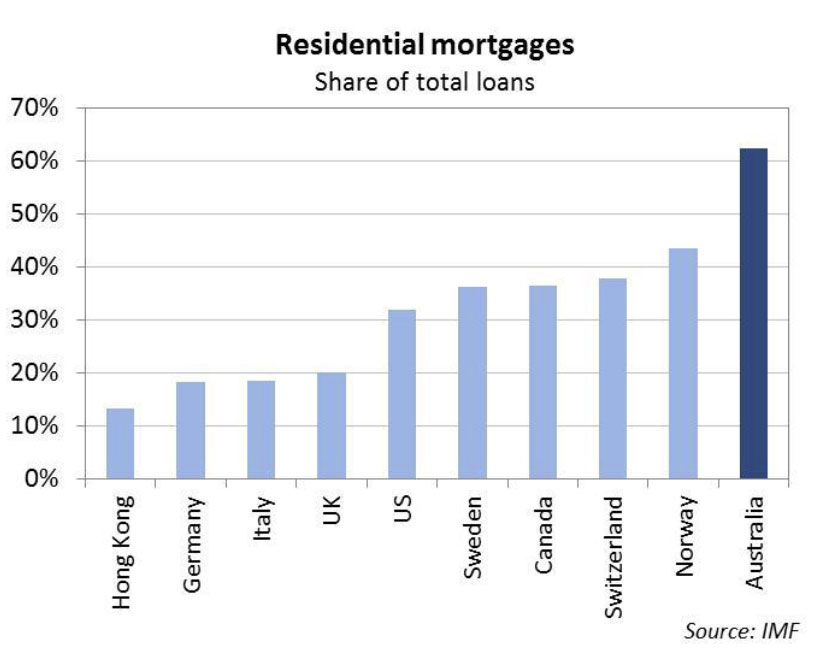
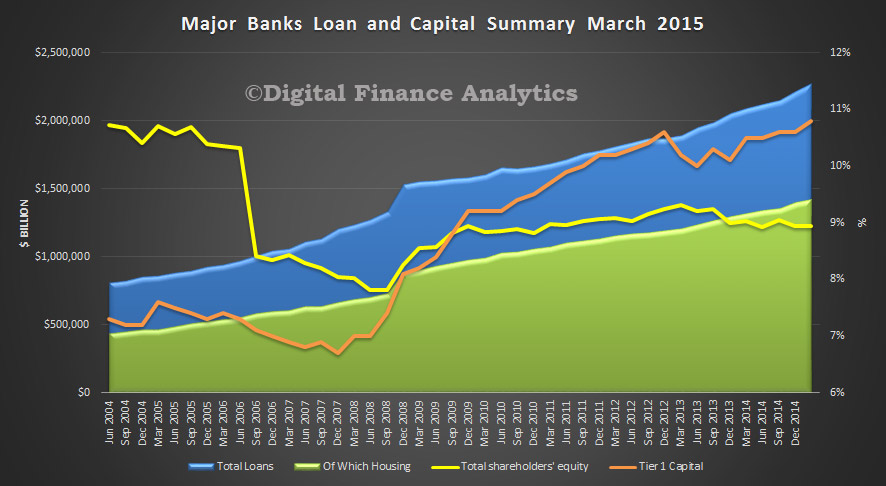
For many of you in the room today, the largest part of your loan portfolios is lending for housing. In that, you are reflective of the broader banking system in Australia. Across all ADIs, the proportion of lending attributable to housing has increased over the past decade from (an already dominant) 55 per cent to a little under 65 per cent today. For credit unions and building societies, the trend is directionally the same, but the dominance of housing even greater (Chart 1).

Chart1: Housing loans as a share of total lending

I have made the point elsewhere that the traditionally low risk nature of Australian housing portfolios has provided important ballast for the Australian banking system – a steady income stream and low loss rates from housing loan books have helped keep the system on a reasonably even keel, despite occasional stormy seas and misadventures elsewhere1. Much of the ongoing trust and confidence in the system, by Australian depositors and international investors alike, is founded on this history of stability.

It is not something we should place at risk.

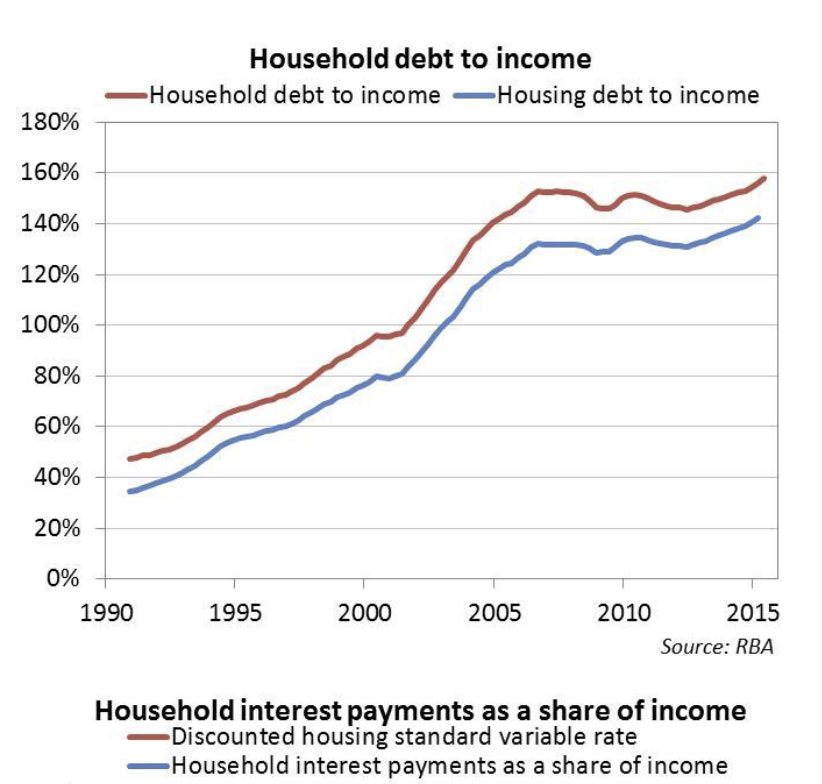
The current economic environment for housing lenders is characterised by heightened levels of risk, reflecting a combination of historically low interest rates, high household debt, subdued income growth, unemployment that has drifted higher, significant house price growth, and strong competitive pressures. Many of these features have been emerging over a number of years, and APRA’s supervision has been intensifying in response. In addition to a heightened level of supervisory activity at individual ADIs, APRA has, for example:

  • increased the level of analysis of mortgage portfolios, including regular review of detailed data on ADI underwriting policies and key risk indicators, to identify outliers;
  • written to boards of the larger lenders, seeking their written assurances with respect to their oversight of the evolving risks in residential mortgage lending;
  • issued a prudential practice guide (APG 223) on sound risk management practices for residential mortgage lending; and
  • completed a stress test of the largest ADIs, with two scenarios focussed on a severe downturn in the housing market.

Not all of you have been directly involved with every one of these initiatives, but I’m sure you will have felt APRA’s presence in some shape or form.

We see this increasing intensity as an example of APRA’s risk-based approach to supervision. As housing-related risks have potentially grown, we have sought to ‘turn up the dial’ of our supervisory scrutiny and, importantly, ensure that Boards and management of ADIs are doing likewise.

Our most recent turning up of the dial was the letter sent to all ADIs in December last year regarding our plans to reinforce sound lending standards2. The letter, beyond expressing some of the general concerns I have just touched upon, also set out some more specific areas that APRA supervisors would be focussing on, and how we would respond if we felt our concerns were not being addressed. Similar sentiments have also been included in more recent letters sent to smaller ADIs.

There are a number of additional regulatory and supervisory tools that APRA has available to address emerging risks: additional supervisory monitoring and oversight, supervisory actions involving Pillar 2 capital requirements for individual ADIs, and higher regulatory capital requirements at a system-wide level. Beyond this, there are more direct controls that are increasingly being used in other jurisdictions, such as limits on particular types of lending – what are commonly referred to as macro-prudential controls.

Up to this point, we have opted to stick with traditional micro-prudential tools targeted at individual ADIs and their specific practices, albeit with an eye to financial stability risks as well as the safety and soundness of individual entities. We are not seeking to determine an appropriate level of house prices, or a particular level of household debt. That is beyond our mandate. Our goal is simpler: reinforcing sound lending standards, which is the ‘bread and butter’ work of a banking supervisor.

Credit assessments – room for improvement

Accurately assessing a borrower’s ability to service and ultimately to repay a loan without undue hardship, including under periods of economic stress, is an inherent component of sound credit risk management, particularly for residential mortgage lending.3

One of the interesting challenges of assessing serviceability practices has been that, just as the vast majority of motor vehicle drivers believe they are above average in driving ability, ADIs invariably claim their lending standards are at the more conservative end of the spectrum, and that it is their competitors that are the source of poor practices. As with everyone claiming to be an above-average driver, not every ADI can be right.

To help us get to the bottom of this, we recently undertook a small hypothetical borrower survey. We asked a number of the larger housing lenders (including a few mutuals) to provide their serviceability assessments for four hypothetical borrowers that we invented (two owner-occupiers, and two investors). The outcomes for these hypothetical borrowers helped to put the spotlight on differences in credit assessments and lending standards. The outcomes were quite enlightening for us – and, to be frank, a little disconcerting in places.

Mortgage lending is often thought of as a fairly commoditised product, but in reality there are wide differences in how lenders assessed the risk of a given borrower. The first surprising result from our review was the very wide range of loan amounts that, hypothetically, were offered to our borrowers. It was not uncommon to find the most generous ADI was prepared to lend in the order of 50 per cent more than the most conservative ADI.

More importantly, the exercise also allowed us to explore the key drivers of difference in risk assessments across lenders. Serviceability is obviously multi-dimensional; it depends on how big a loan is extended, relative to a borrower’s income (and the reliability of the various components of that income) and the nature and extent of non-housing obligations that a borrower needs to meet.

One significant factor behind differences in serviceability assessments, particularly for owner occupiers, was how ADIs measured the borrower’s living expenses (Chart 2a and 2b). As a regulator, it is hard to understand the rationale for large differences in what should be a relatively objective, and extremely critical, metric.4

Chart 2a: Minimum living expense assumptions shows percentage of owner-occupier borrower pre-tax salary income between 20%-35%
Chart 2b: Minimum living expense assumptions shows percentage of investor borrower pre-tax salary income between 0%-25%

Of major concern were a few ADIs who opted to make their credit assessment based on a lower level of living expenses than that declared by the borrower. That is obviously a practice that should not continue, and ADIs should be making reasonable inquiries about a borrower’s living expenses. In fact, best practice (and intuition) would be to apply minimum living expense assumptions that increase with borrower incomes; this was a practice adopted by only a minority of ADIs in our survey.

The treatment of other income sources (such as bonuses, overtime and investment earnings) also played a large role in credit decisions (Chart 3). Common sense would suggest it is prudent to apply a discount or haircut to these types of income, reflecting the fact they are often less reliable means of meeting regular loan repayments. Unfortunately, common sense was sometimes absent.

Chart 3: Income recognised (less tax and haircuts) shows percentage of investor borrower gross pre-tax income

Another area of interest was the discount or ‘haircut’ applied to declared rental income on an investment property. The norm in the ADI industry seems to be a 20% haircut, but we noted in our exercise that some ADIs based their serviceability assessment on smaller, or even zero, haircuts. Bearing in mind that the cost of real estate fees, strata fees, rates and maintenance can easily account for a significant part of expected rental income, and this does not take into account potential periods of vacancy, the 20% norm itself does not seem particularly conservative. We also came across a few instances in which ADIs were relying on anticipated future tax benefits from negative gearing to get a borrower over the line for a mortgage.

Variations in assessments were also driven by the size of interest-rate buffers applied to the new loan (Chart 4) – something we flagged in our December letter as an area of particular importance. For investor lending, this issue was more pronounced: a major driver of differences across ADIs was whether an interest-rate buffer was applied to both the investor’s existing debts (such as loans outstanding on existing owner-occupied or investment properties), as well as to the proposed new loan. As of earlier this year when the survey was conducted, only about half of the surveyed ADIs applied such a buffer to existing debts (all applied some form of buffer to new debts). I confess to struggling to see the logic of such an approach – after all, any rise in interest rates will at some point in time affect the borrower’s other debts just as they will for the new loan being sought.

Chart 4: Existing mortgage debt shows interest rate used in investor serviceability assessment between 4%-9%

The final area I would highlight were differences in the treatment of interest only loans. Our test included one borrower seeking a 30-year loan, with the first 5 years on an interest-only basis. Only a minority of surveyed ADIs calculated the ability to service principal and interest (P&I) repayments over the residual 25 year term. Despite the contractual terms, the majority assumed P&I repayments over the full 30-year term, and hence were able to inflate the hypothetical borrower’s apparent surplus income by, in our particular example, around 5 per cent.

So there is no confusion, let me be clear that Australian ADIs are thankfully well away from the types of subprime lending that have caused so many problems elsewhere (eg lending with an LVR in excess of 100 per cent, at teaser rates, to borrowers with no real capacity to repay). Nevertheless, our overall conclusion from this hypothetical borrower exercise was that there were clearly examples of practice that were less than prudent. As a result, we have shown ADIs that participated in the exercise how they compare to their peers and where their serviceability assessments could be strengthened: in all of the examples above, we expect to see changes to practices across a range of ADIs.

In doing so, we have been asked whether APRA is trying to standardise mortgage risk assessments or impose a common ‘risk appetite’ across the industry. In fact, we do think it important that ADIs adhere to some minimum expectations with respect to, for example, interest-rate buffers and floors, and adopt prudent estimates of borrower’s likely income and expenses. In that regard, to the extent we are reinforcing a healthy dose of common sense in lending standards, greater convergence is probably warranted.

At the same time, we certainly want to see competition between lenders and fully accept that different ADIs can have different risk appetites. And we are not seeking to interfere in ADIs’ ability to compete on price, service standards or other aspects of the customer experience. However, making overly optimistic assessments of a borrower’s capacity to repay does not seem a sensible or sustainable basis on which to attract new customers or retain existing ones. It also runs the risk of adverse selection and an accumulation of higher risk customers who (perhaps quite justifiably) cannot get finance elsewhere. To go back to my opening remarks, it does not fulfil the precondition for long-term success.

I have mentioned all of this for two reasons:

  • First, because what at first glance might seem prudent practice is not always so. When our December letter was issued, a number of ADIs were quick to point out they were already utilising a floor rate of 7 per cent and a buffer of 2 per cent within their serviceability assessments. Leaving aside that our letter suggested it would be good practice to operate comfortably above those levels, if the buffers are being applied to overly optimistic assessments of income, or only to part of the borrower’s debts, they do not serve their purpose.
  • Second, because much of the attention given to our December letter has focussed on the 10 per cent benchmark for growth in investor lending. I want to emphasise that our analysis goes much broader than just investor lending growth, and captures ADIs’ lending standards and risk profile across the board. Investor lending aspirations will only be one factor in our consideration of the need for further supervisory action.

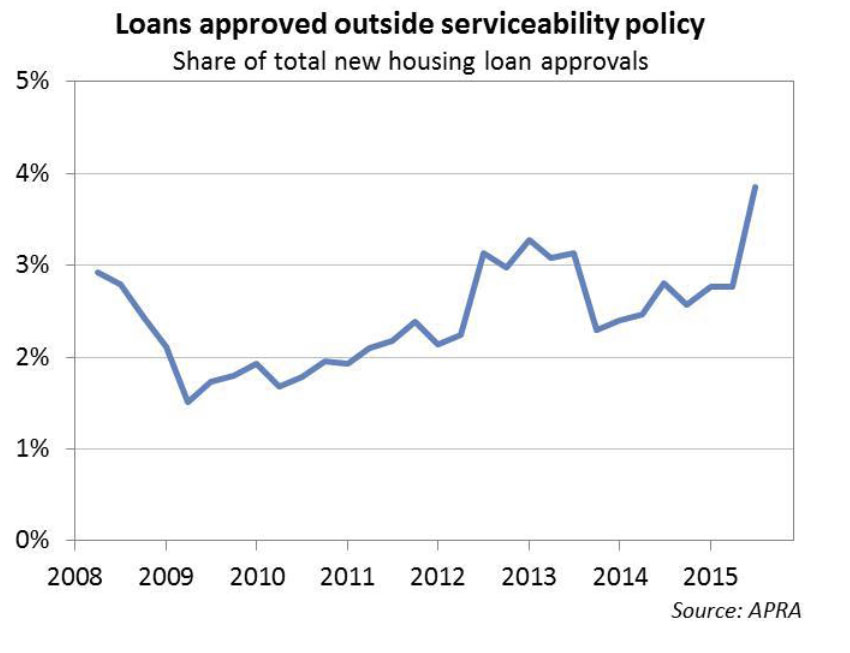
This work on lending standards has been intensive and time-consuming for APRA and, no doubt, all of the ADIs involved, but has been well worth it if we have been able to reinforce sound lending standards across the industry. (If you have not yet looked at your own policies in the areas I have outlined, I would encourage you to do so as a matter of priority.) Of course, we will need to keep up our scrutiny and be alert to both subsequent policy changes, and/or substantial policy overrides (ie loan approvals outside policy). The latter will warrant particular attention by both ADIs and APRA: if policies are tightened only for overrides to correspondingly increase, we will have not achieved our objective.

That also applies to business plans and growth aspirations: where we have agreed plans with ADIs, we will obviously be monitoring closely to see that they kick into effect in the second half of the year. We recognise that it takes time for growth plans to alter course, especially given lending pipelines of pre-approved loans (there is also typically slightly stronger growth in the second quarter of the calendar year). However, ADIs have now had long enough to revise their ambitions where needed, and we will be watching carefully to see a moderation in growth in investor lending in the second half of the year as revised plans are implemented.

Developments in capital standards

Let me now turn to capital adequacy.

As most of you know, there were five recommendations from the Final Report of the Financial System Inquiry that relate to ADI capital:

  • Recommendation 1 – that we set ADI capital standards in such a manner as to ensure ADIs are ‘unquestionably strong’ (with a suggestion this could be met by having Australian banks in the top quartile when measured against the capital ratios of international peers);
  • Recommendation 2 – that we narrow the differential in risk weights on mortgages between the standardised and internal-ratings based (IRB) approaches (again, with a suggestion of a 25-30 per cent risk weight for the IRB approach);
  • Recommendation 3 – that we should implement a framework for additional loss absorbing and recapitalisation capacity in line with international practice;
  • Recommendation 4 – that we develop a reporting template that allows the capital ratios of Australian ADIs to be reported without the impact of APRA adjustments to the Basel minimums; and
  • Recommendation 8 – that we introduce a leverage ratio as a backstop to the risk-based capital framework.

In addition, the Basel Committee has work underway that will intersect with these recommendations. Most relevantly, it is currently considering:

  • responses to submissions on proposed revisions to the standardised approach, including, importantly, to housing risk weights;
  • responses to submissions on proposed revisions to the capital floor for banks using the IRB approach; and
  • how the IRB framework can be reinforced, given the increasing scepticism towards modelling approaches in light of the excessive variability in capital requirements they are producing.

To repeat what I have said previously, it is to everyone’s benefit that we approach the FSI and Basel proposals in a coordinated manner. But that does not mean waiting until every i is dotted and t is crossed.

The Basel Committee meets again in June to review the way ahead on its various proposals. I do not think it will be too long after that that we are able to announce how we will respond to those issues that are easiest to tackle sooner rather than later (particularly Recommendations 2 and 4). Other items will take a little longer to pin down the precise detail. But the direction is clear, and we fully support the FSI’s recommendation that Australian ADIs should be unquestionably strong. So it also makes sense to start early and move forward in an orderly fashion wherever possible: affected ADIs should, provided they take sensible opportunities to accumulate capital, be well-placed to accommodate these changes when they occur.

What does all of it mean for customer-owned banking organisations? As this audience already knows, the capital ratios of credit unions and building societies stand, on average, well above that of the rest of the banking sector (Chart 5), providing a healthy buffer with which to accommodate any future changes. I suspect that, when looked at in aggregate, mutual ADIs will be less impacted by the collective set of changes to regulatory requirements than other parts of the ADI sector. Of course, within the sector, there are differences from ADI to ADI, so I am wary of making sweeping statements. But there is no doubt that mutual ADIs generally start with high capital ratios vis-à-vis many of their larger competitors, and the impact of changes are likely to be felt more acutely elsewhere.

That said – and I wouldn’t be true to my role as a prudential supervisor if I did not sound a note of caution before I conclude – it doesn’t mean the changes won’t be felt at all, or that changes in the competitive landscape will provide a panacea to the strategic challenges that face smaller organisations in a more demanding environment. Long-standing issues of scale, geographic concentration, technological capacity, and more mobile and demanding customers will not be diminished by regulatory changes. The only suggestion I would offer on these today is that the challenges will be more likely to be overcome if, consistent with the mutual ethos that underpins COBA and its members, the mutual sector works cooperatively together to address them.

Concluding remarks

I opened by setting out two necessary – but not sufficient – preconditions for long-term success: sound lending standards and adequate capital.

Lending standards are important for the stability of the Australian banking system, and given the importance of housing-related lending, it should not be surprising that APRA supervisors are increasingly vigilant on the risks this lending presents. Put simply, if all our eggs are increasingly being placed in one basket, we need to make sure the basket isn’t dropped. ADIs that have continued to adopt sensible practices and prudent credit assessments should welcome this approach, as it strengthens their capacity to compete without being reckless. On the other hand, ADIs with more aggressive practices should fully expect to find APRA increasingly at their doorstep.

When it comes to capital, we will have more to say shortly. But my message today is that we will respond to all of the FSI’s recommendations as soon as we can, bearing in mind the need for a coordinated approach that factors in international work that is still in the pipeline. No one disputes the benefits of having an unquestionably strong banking sector, so where it makes sense to move ahead, we will get on with it. ADIs should adopt a similar approach in their capital planning: to the extent further capital accumulation is needed, there is little to be lost from starting early.

1 Seeking Strength in Adversity, AB+F Randstad Leaders Lecture Series, 7 November 2014

2 Reinforcing Sound Residential Mortgage Lending Practices, 9 December 2014

3 APG223, Residential Mortgage Lending, November 2014. See also Financial Stability Board, Sound Residential Mortgage Underwriting Practices, April 2012.

4 Estimated living expenses between the most conservative and the least conservative ADI varied by at least 30 per cent, and in some cases significantly more (depending on the borrower’s characteristics).

Risky Lending In A Low Interest Rate Competitive Environment

Regulators have been concerned about the quality of lending, and have been increasing their supervision, conscious of the potential impact on financial stability. However, a paper from the Bank for International Settlements  – Bank Competition and Credit Booms highlight that especially when interest rates are low, and competition intense, banks will naturally and logically drop underwriting standards. This observation is highly relevant to the Australian context, where competition for home loans in particular is leading to heavy discounting from already low rates, and potential lax underwriting. It suggests that lowering rates further will exacerbate the effect.

Greater bank competition and a lower risk-free rate raise the screening costs of lending, which can result in sharp increases in credit supply and deteriorations in average loan quality, which are inefficient for banks. Banks’ incentives to make risky loans can vary despite unchanged capital structure, thus highlighting the role of a risk-taking mechanism. This approach helps explain the existing mixed empirical results on the relationship between bank competition and financial stability. The model can be used to define a neutral interest rate in the context of financial cycles.

There is a growing recognition that the relationship between finance and growth may be unstable in practice. Past financial crises serve as painful reminders that increasing financial access by too much too fast is subject to diminishing returns at best, and can even lead to severe output losses when the financial sector is in disarray. Despite ample evidence for this perverse nonlinearity, there is less understanding about the exact mechanism by which excessive finance that is harmful for stability can arise as an equilibrium phenomenon. Similarly, the role of policy in navigating the trade-o between growth and financial stability, unlike that between growth and inflation, remains a relatively uncharted territory.

This paper proposes a simple model of bank lending decision, where a`credit boom’ could emerge as an equilibrium phenomenon. Two key forces interact to determine the equilibrium. First, banks have an incentive to screen out bad clients by restricting the amount of lending per contract, as riskier firms are known to seek larger loans despite a lower chance of success. Such screening entails costs to both banks and good firms, given that credits are being rationed to meet incentive compatibility conditions. This feature is essentially classic credit rationing.

The second force comes into play when banks enjoy some monopolistic power over their loan market, but can attempt to poach clients from another bank by offering cheaper loan contracts. Lowering prices of loans raises the screening costs, because it necessitates even greater credit rationing if banks were to screen out risky fi rms. When the degree of bank competition for borrowers is suciently intense, it becomes optimal for banks to stop screening and rush to dominate the market by off ering contracts with larger loans to all firms. This new pooling equilibrium is characterised by a low lending interest rate (relative to the average productivity of underlying projects), a larger loan size, and a higher probability of loan defaults.

A lower risk-free rate increases the banks’ incentives to lend by lowering the opportunity cost of funds. But how the credit market equilibrium responds to changes in the risk-free rate also depends on the market structure in which banks operate. In particular, when a bank can gain more market share for a given cut in lending rate, the degree of competiton tends to be higher in equilibrium for any level of risk-free rate. Credit booms are therefore more likely to occur when banks compete more aggressively and/or the risk-free rate is low. In this context, the notion of `fi nancial stability neutral’ monetary policy can be given an explicit de nition, namely that which will prevent a pooling equilibrium from occuring. At the same time, the presence of intense bank competition can limit the effectiveness of monetary policy in containing a credit boom and achieving the financial stability objective.

Housing Finance Regulation – Tweaked, Not Reformed

Fresh on the heels of the FSI report, the core thesis of which is that the Australian Banks are too big to fail, so capital buffers must be increased to protect Australia from potential risks in a down turn (a “mild” crash could lead to the loss of 900,000 jobs and a $1-2 trillion or more cost to the economy), it was interesting to see the publication yesterday by APRA of the guidelines for mortgage lending, and ASIC’s targetting interest only loans. This action is coordinated via the Council of Financial Regulators (CFR). This body is the conductor of the regulatory orchestra, and has only had an independant website since 2013.  It is the coordinating body for Australia’s main financial regulatory agencies. It is a non-statutory body whose role is to contribute to the efficiency and effectiveness of financial regulation and to promote stability of the Australian financial system. The Reserve Bank of Australia (RBA) chairs the Council and members include the Australian Prudential Regulation Authority (APRA), the Australian Securities and Investments Commission (ASIC), and The Treasury. The CFR meets in person quarterly or more often if circumstances require it. The meetings are chaired by the RBA Governor, with secretariat support provided by the RBA. In the CFR, members share information, discuss regulatory issues and, if the need arises, coordinate responses to potential threats to financial stability. The CFR also advises Government on the adequacy of Australia’s financial regulatory arrangements.

Whilst FSI recommended beefing up ASIC, and introducing a formal regulatory review body, it did not fundamentally disrupt the current arrangements. Interestingly, CFR is a direct interface between the “independent” RBA and Government.

So, lets consider the announcements yesterday. None of the measures are pure macroprudential, but APRA is reinforcing lending standards by introducing potential supervisory triggers (which if breached may lead to more capital requirements, or other steps) using an affordability floor of 7% or more (meaning if product interest rates fell further, banks could not assume a fall in serviceability requirements) and at least an assumed rise in rates of 2% from current loan product rates. In addition, any lender growing their investment lending book by more than 10% p.a. will be subject to additional focus (though APRA makes the point this is not a hard limit). These guidelines relate to new business, and does not directly impact loans already on book (though refinancing is an interesting question, will existing borrowers who refinance be subject to new lending assessment criteria?) ASIC is focussing on interest-only loans, which are growing fast, and are often related to investment lending.

The banks currently have different policies with regards to serviceability buffers. Analysts are looking at Westpac in the light of these announcements, because it grew its investment housing lending book fast, uses 180 basis points serviceability buffer and an interest rate floor of 6.8%. Investment property loans make up ~45% of WBC’s housing loan portfolio (compared with the majors average of ~36%), and has grown at ~12% year on year this financial year (compared with the average across the majors of ~10%). WBC made some interesting comments in their recent investor presentation relating to investment loans, highlighting that investors tended to have higher incomes than owner occupied loans.

WBCInvestorDec2014Other banks have different underwriting formulations with buffers of between 1.5% and 2.25% buffers. ASIC has of course also stressed that lenders must consider borrowers ability to repay and take account other expenditure. There is evidence of the “quiet word from the regulator” working as recently we have noted some slowing investment lending at WBC (currently they would be below the 10% threshold) and amongst some other lenders too. However, some of the smaller lenders may be impacted by APRA guidance, given stronger recent growth.

What does this all mean. First, we see now what APRA meant in their earlier remarks “collecting additional information, counselling the more aggressive lenders, and seeking assurances from Boards of our lenders that they are actively monitoring lending standards. We’re about to finalise guidance on what we see as sound mortgage lending practice”. Second, we do not think this will materially slow down housing investment lending, and this is probably what the RBA wants, given its belief consumer spending should replace mining investment as a source of growth.  The regulators are trying to manage potential risks in the system, by targetting higher risk lending whilst letting housing lending continue to run. Third, it leaves open the door to macroprudential later if needed. Lastly, existing borrowers may be loathe to churn if they are now required to meet additional buffers. This may slow refinancing, and increase longevity of loans in portfolio (and loans held longer are more profitable for the banks).


ASIC Updates Responsible Lending Guidance

ASIC has updated its guidance for credit licensees on their responsible lending obligations.

Credit licensees cannot rely solely on benchmark living expense figures rather than taking separate steps to inquire into borrowers’ actual living expenses.

The updated guidance reflects:

  • a recent Federal Court decision that is relevant to all credit licensees regarding their responsible lending obligations
  • changes to statutory restrictions on charges for small amount credit contracts, and
  • clarification of existing guidance, and removal of some material that we consider to be repetitive or no longer necessary.

On 26 August 2014, the Federal Court handed down its first decision on the responsible lending obligations: ASIC v The Cash Store (in liquidation) [2014] FCA 926 (refer: 14-220MR).

The Federal Court ruled that The Cash Store Pty Ltd (in liquidation) and loan funder Assistive Finance Australia Pty Ltd had failed to comply with their responsible lending obligations in relation to their customers, the majority of whom were on low incomes or in receipt of Centrelink benefits.

The Federal Court’s decision makes it clear credit licensees must, at a minimum, inquire about the consumer’s current income and living expenses to comply with the responsible lending obligations. Further inquiries may be needed depending on the circumstances of the particular consumer.

ASIC has updated Regulatory Guide 209 Credit licensing: Responsible lending conduct (RG 209) to incorporate the general findings of the Federal Court on the responsible lending obligations for credit licensees.