I recorded this show with Nucleus Wealth as we explore the tips and traps of Lenders Mortgage Insurance. Just remember folks, its protects the bank, not the borrower!
Digital Finance Analytics (DFA) Blog
"Intelligent Insight"

I recorded this show with Nucleus Wealth as we explore the tips and traps of Lenders Mortgage Insurance. Just remember folks, its protects the bank, not the borrower!
Genworth, the Lenders Mortgage Insurer released their third quarter results today. Their statutory net profit after tax (NPAT) in 3Q19 was $25.1 million (3Q18: $19.6 million) and their underlying NPAT2 of $26.5 million (3Q18: $20.4 million).
Genworth said 3Q19 financial performance was “solid” with gross written premium up 24.4% from growth in our traditional lenders mortgage insurance (LMI), driven by increasing volumes in high loan to value lending by our lender customers.
The Delinquency Rate increased from 0.55% in 3Q18 to 0.60% in 3Q19. This was driven primarily by an increase in delinquency rates across most states (particularly in Western Australia, New South Wales and Queensland).
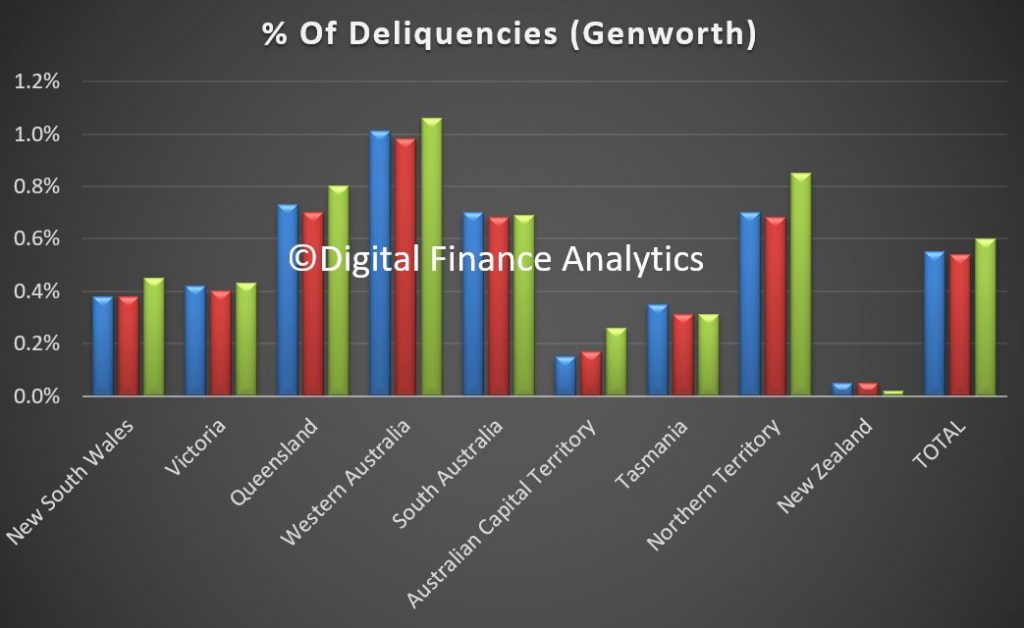
The increase also reflects the continued extended ageing of delinquencies due to slower loss management processing by lenders first called out in FY18. Encouragingly, signs of faster processing by some lenders has emerged this quarter. The Delinquency Rate remained flat between 2Q19 and 3Q19.
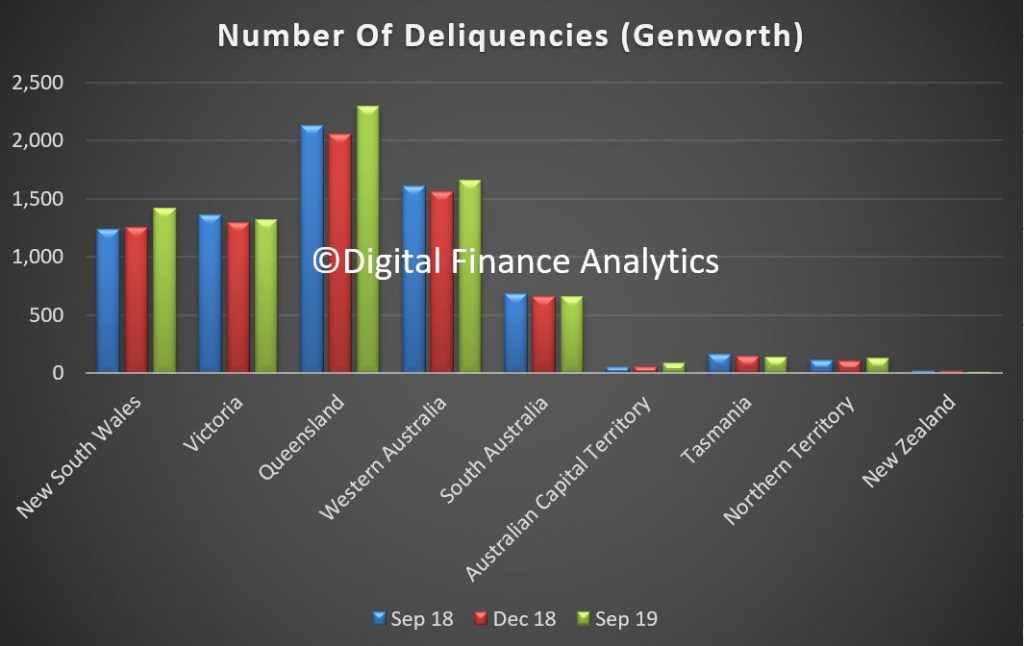
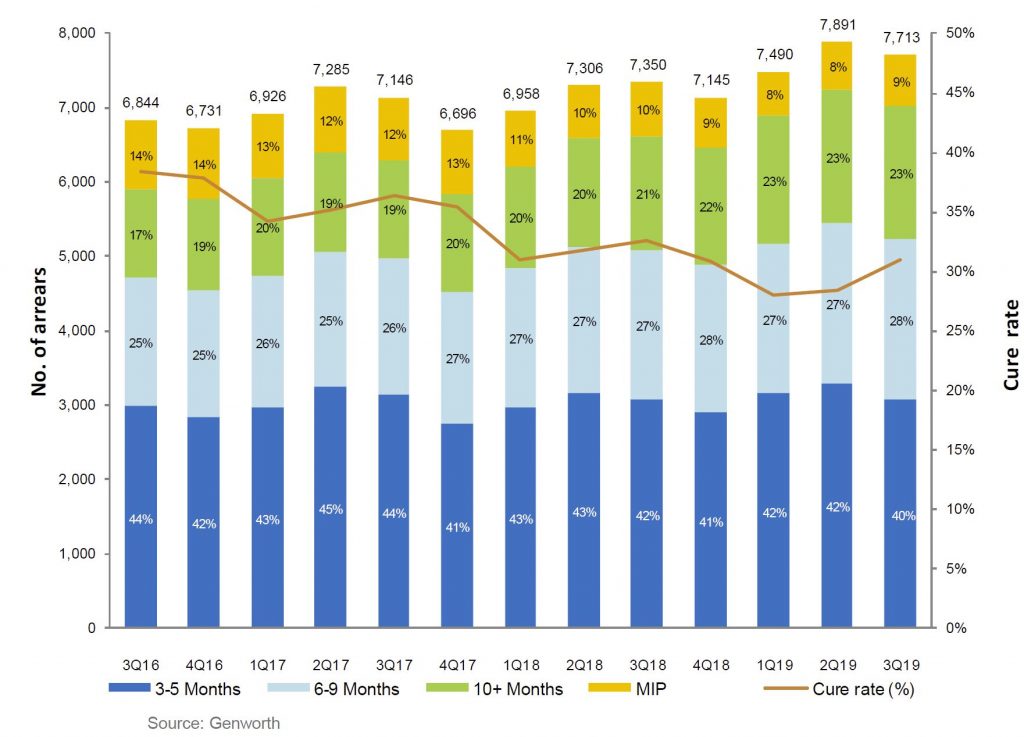
New Delinquencies was down slightly (3Q19: 2,622 versus 3Q18: 2,742) and in line with favourable trends usually experienced in the third quarter as new delinquencies reduced from 2,853 in 2Q19. Cures improved from 2,378 in 3Q18 to 2,439 in 3Q19 as lender customers started to emphasise remediation of aging delinquencies. However the cure rate is still lower than back in 2017.
The number of Paid Claims was up (3Q19: 361 versus 3Q18: 320) although the average paid per claim decreased from $115,700 in 3Q18 to $97,900 in 3Q19. This decrease is a result of the stabilisation of mining regions. However, the average paid per claim remains elevated as challenging market conditions remain across areas such as Perth and its specific sub-regions.

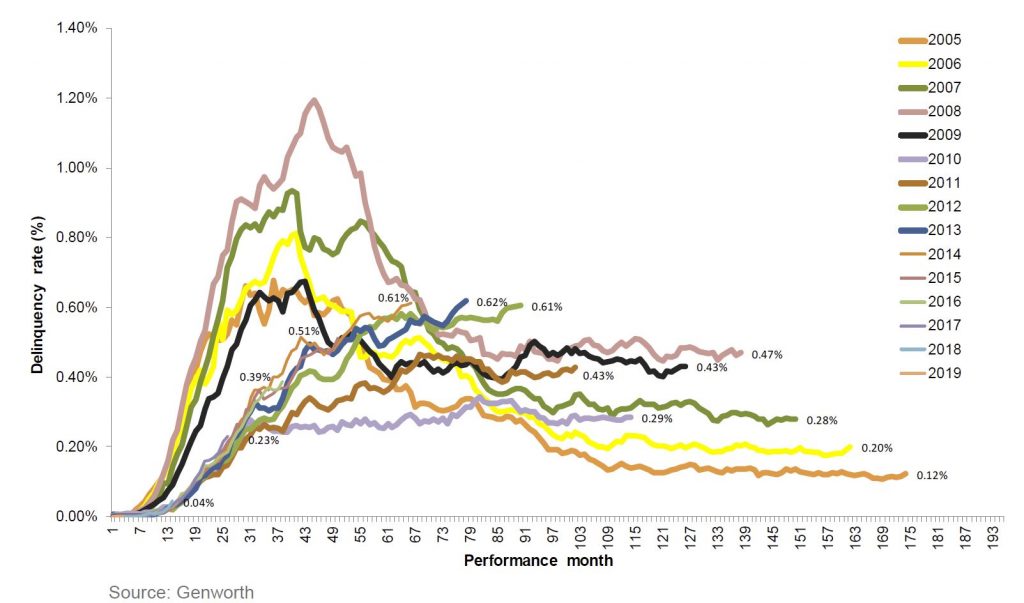
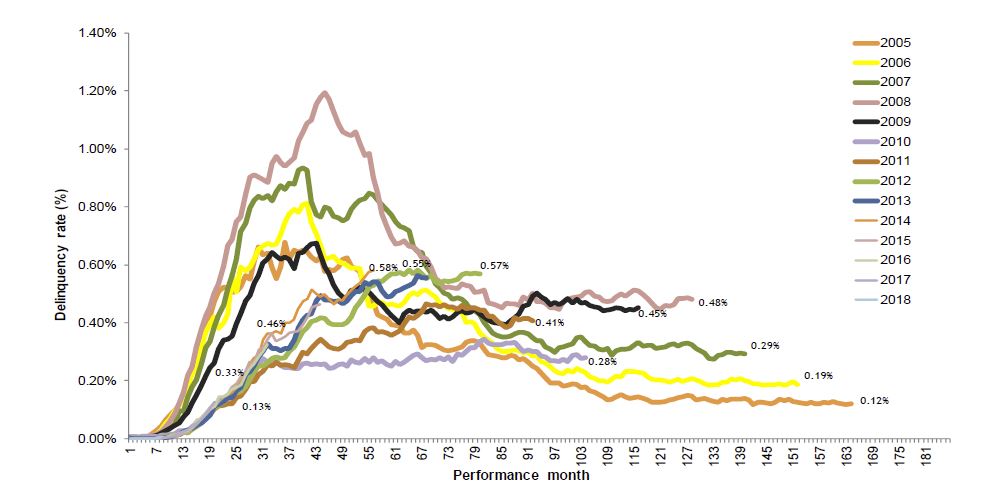
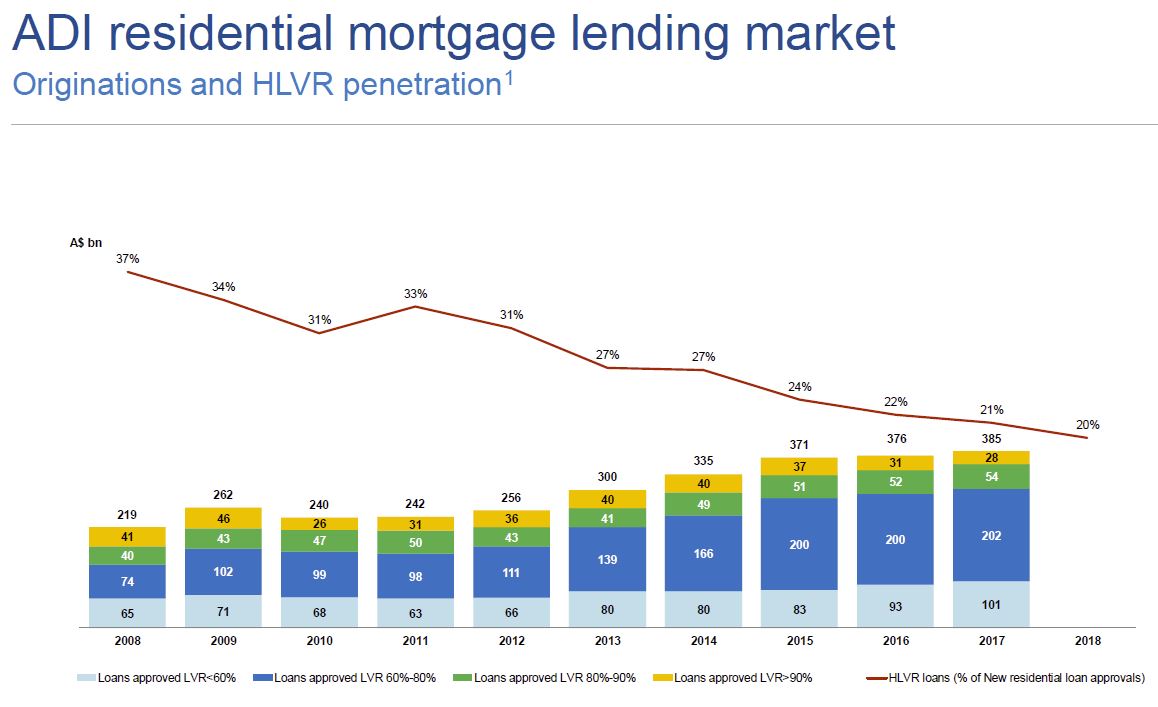
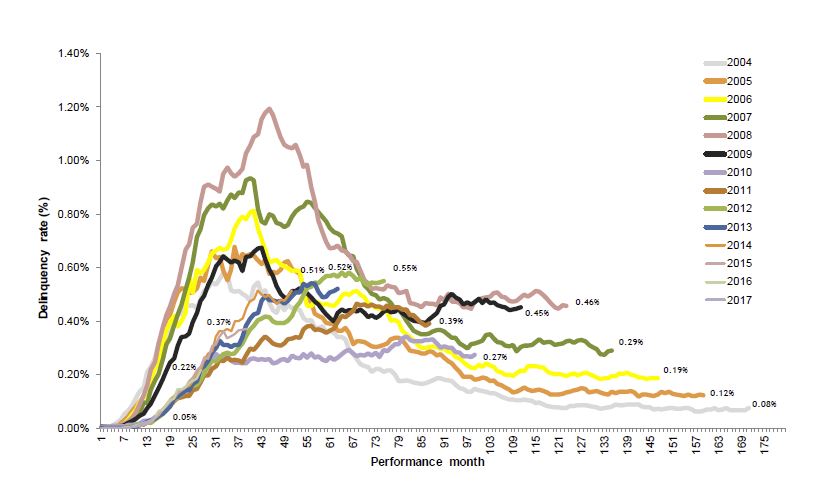
The aging also highlights the length of time it takes to get into difficulty, see the peak in loans written back in 2013-14.
Portfolio delinquency performance remained relatively steady quarter on quarter, following seasonal trends. Despite the overall stability, impacts from ageing delinquencies continue, but early signs of faster loss mitigation processing by lenders are emerging.
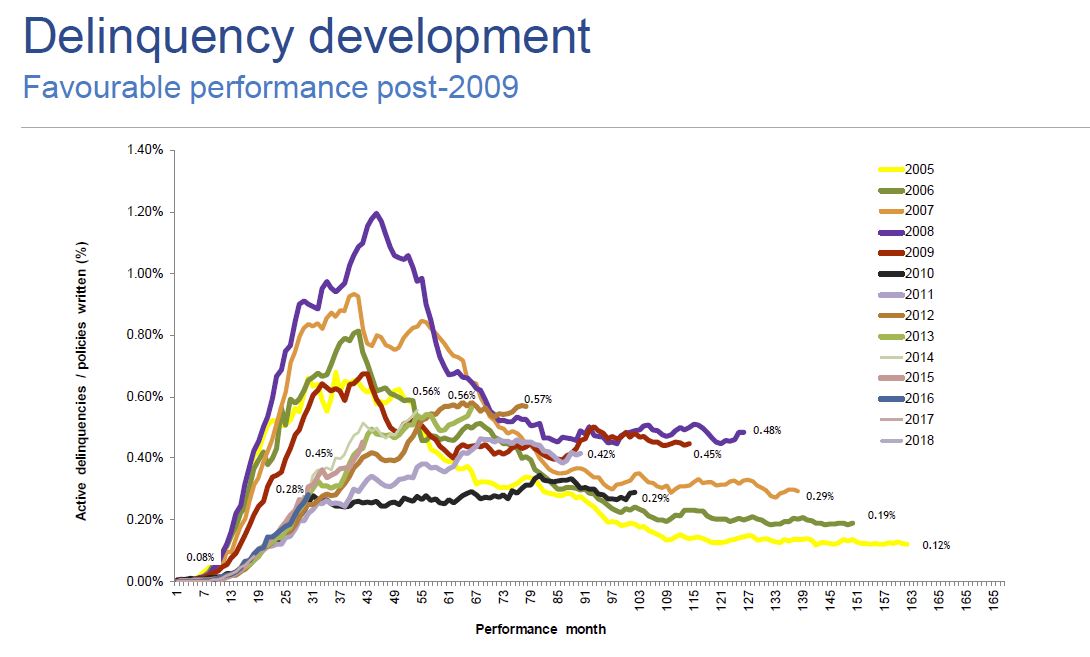
2006 and prior book years performances were affected by higher proportion of low doc lending which reduced significantly in 2009 following policy changes and decommissioning of the low docs product in the latter part of 2009.
Historical performance of 2008 09 book year was affected by the economic downturn experienced across Australia and heightened stress experienced among self employed borrowers, particularly in Queensland, which has been exacerbated by recent natural disasters.
2010 12 book year delinquencies at lower levels driven by stronger credit policies
Deterioration in 2013 14 book years reflect downturn in mining regions resulting in ongoing economic and housing market challenges.
But the most obvious issue ahead is the rising levels of delinquency in NSW. This will be one to watch in coming quarters, alongside a potential rise in the proportion of high loan to value loans being written now (thanks to the APRA loosening).
Genworth reported their 1H19 results today. As the most transparent Lenders Mortgage Insurer in Australia it provides an important, if myopic sense of what is happening at the mortgage portfolio coalface. And pressure is still building.

They reported a NPAT of $88.1 million includes after tax unrealised gain of $45.4 million on investment portfolio (1H18: after tax unrealised loss of $8.4 million), and an underlying NPAT 1 of $43.1 million includes after tax realised gain of $5.8 million (1H18: $9.1 million).
Their loss ratio was 54.1% (1H18: 53.3%) in line with the Company’s FY19
guidance reflecting they say a seasonal uptick in delinquencies historically experienced in the first half of the year.
Delinquencies were up, by 6 basis points, with WA leading the way at 11 basis points, followed by NSW and QLD. This is consistent with DFA mortgage stress analysis.
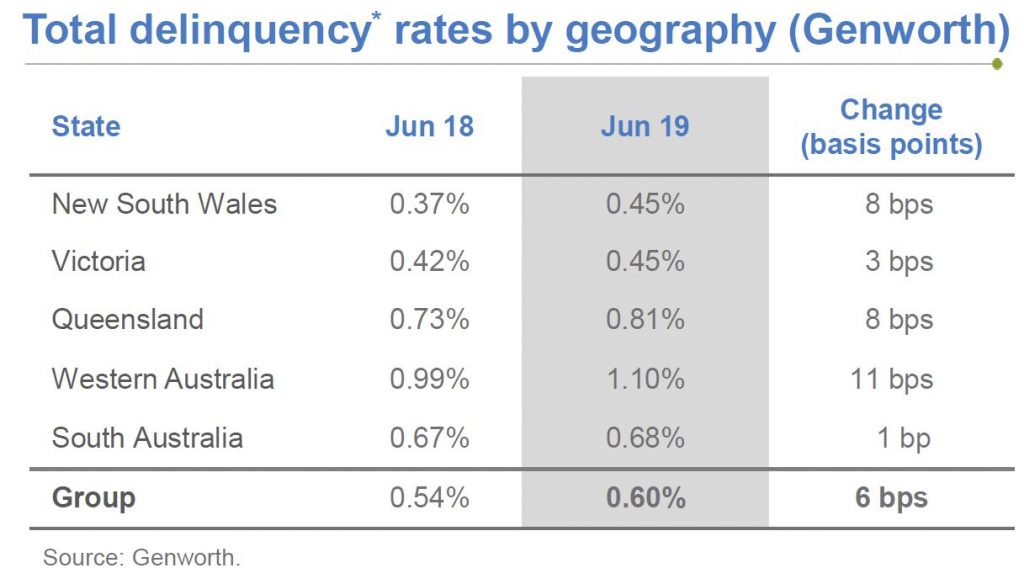
They said that overall portfolio delinquency performance deteriorated marginally quarter on quarter, in-line with seasonal expectations, but also impacted by ageing delinquency portfolios as a result of slower loss mitigation processes by lenders.
This is code for lenders choosing NOT to press stressed borrowers to foreclose, in my view.
Their 2006 and prior book years performances were affected by higher proportion of low doc lending which reduced significantly in 2009 following policy changes and decommissioning of the low docs product in the latter part of 2009
Historical performance of 2008-09 book year was affected by the economic downturn experienced across Australia and heightened stress experienced among self-employed borrowers, particularly in Queensland, which has been exacerbated by recent natural disasters.
2010-12 book year delinquencies at lower levels driven by stronger credit policies
Deterioration in 2013-14 book years reflect downturn in mining regions resulting in ongoing economic and housing market challenges
They announced a new product offering – a regular monthly premium LMI to lenders as an alternative to the current upfront single premium product. This may lower the sticker shock on premiums for LMI.
Their outlook is predicated on metropolitan housing market conditions stabilising, but Perth is likely to continue to experience challenging market conditions. They think unemployment levels will remain reasonably stable throughout 1H19 though with continued excess capacity in the labour market ahead.
Genworth still has a strong capital base with total assets as at 30 June 2019 at $3,648.2 million. The 1.6% increase is due to share buy-backs, unrealised gains in investments and changes in accounting.
Total liabilities as at 30 June 2019 were $1,925.9 million, which is a 3.9%
increase of $73.1 million from 31 December 2018.
Since listing in 2014, Genworth has paid out 100% of after tax profits by way of ordinary and special dividends to shareholders.
So LMI remains a tricky business, with new competitors, internal bank alternatives, and the Government 95% scheme coming next year, so no surprise that some rating agencies have recently downgraded.
Lenders Mortgage Insurer Genworth reported their 3Q18 earnings today with a statutory net profit after tax (NPAT) of $19.6 million and underlying NPAT of $20.4 million for the third quarter ended 30 September 2018 (3Q18). It is an important bellwether for the mortgage industry, and confirms recent softening. Whilst they have a strong capital position, their net investment returns were also down a little.
The Delinquency Rate (number of delinquencies divided by policies in force but excluding excess of loss insurance) increased from 0.50% in 3Q17 to 0.55% in 3Q18 (1H18: 0.54%). They called out “the continued trends of softening cure rates from a moderating housing market, tightening credit standards and increases in mortgage interest rates. This has resulted in a more subdued seasonal uplift than has historically been experienced by our business”. As a result, loss ratio guidance was revised higher to 50-55% from 40-50% guidance range previously.
Gross Written Premium increased in 3Q18 reflecting growth in their traditional Lenders Mortgage Insurance (LMI) flow business.
 New business volume (excluding excess of loss insurance), as measured by New Insurance Written (NIW), decreased 7.3% to $5.1 billion in 3Q18 compared with $5.5 billion in 3Q17. NIW in 3Q17 included $0.8 billion of
bulk portfolio business versus no bulk portfolio business in 3Q18. Excluding the bulk portfolio business written in 3Q17, flow business NIW increased 8.5% in 3Q18.
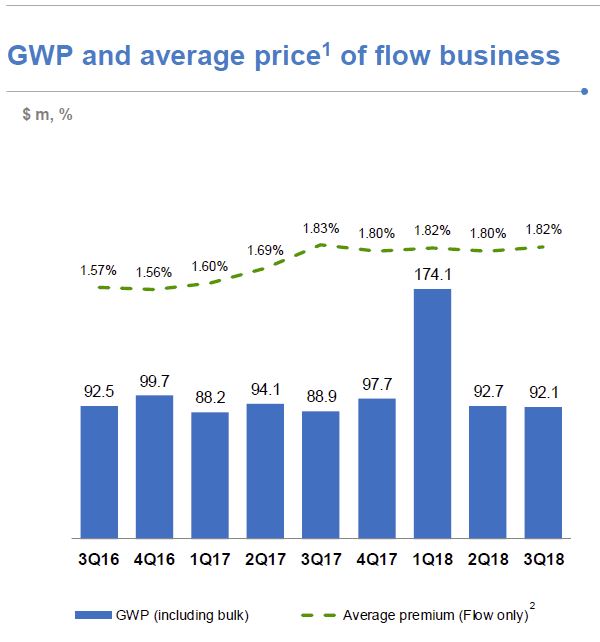
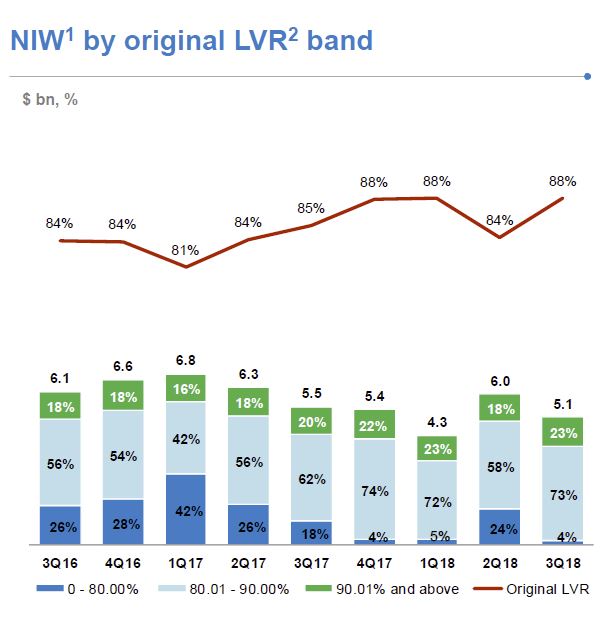 Gross Written Premium (GWP) increased 3.6% to $92.1 million in 3Q18 (3Q17: $88.9 million). This does not include any excess of loss business written by Genworth’s Bermudan entity and reflects the greater proportion of traditional LMI flow business written by Genworth lender-customers.
Net Earned Premium (NEP) decreased 32.0% from $100.1 million in 3Q17 to $68.1 million in 3Q18. This includes the adverse $24.8 million impact of the 2017 Earnings Curve Review, and lower earned premium from current and
prior book years. Excluding the 2017 Earnings Curve Review impact, NEP would have declined 7.2% in 3Q18.
The adverse impact on NEP of the 2017 Earnings Curve Review has been reducing quarter on quarter since it took effect on 1 October 2017. Whilst the 2017 Earnings Curve Review has the effect of lengthening the time-period over which premium is earned, it does not affect the quantum of revenue that will be earned.
Genworth’s Unearned Premium Reserve as at 30 September 2018 was $1.2 billion.
The Delinquency Rate (number of delinquencies divided by policies in force but excluding excess of loss insurance) increased from 0.50% in 3Q17 to 0.55% in 3Q18 (1H18: 0.54%). This was driven by two factors. Firstly, there was a decrease in policies in force following completion of the lapsed policy initiative undertaken by the Company in 2Q18. The second factor was the increase in delinquency rates year-on-year across all States (in particular Western Australia, New South Wales and to a lesser extent South Australia). In terms of number of delinquencies, Western Australia and New South Wales experienced the largest increase with Queensland and Victoria experiencing a decrease in number of delinquencies.
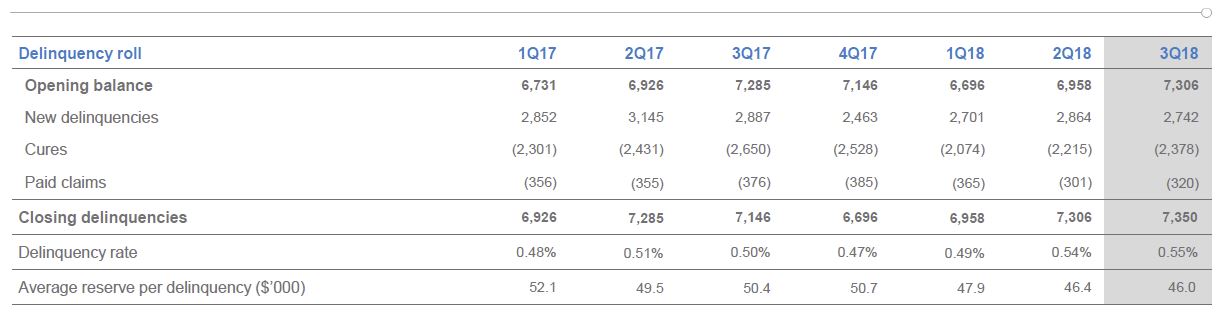 New delinquencies were down in the quarter (3Q18: 2,742 versus 3Q17: 2,887) with mining regions showing signs of improvement. In non-mining regions, the softening in cure rates experienced in 1Q18 and 2Q18 continued in 3Q18 with the traditional seasonal uplift in the third quarter being more subdued than prior years.
 Net Claims Incurred for the quarter were down 3.2% (3Q18: $35.8 million versus 3Q17: $37.0 million). The Loss Ratio in 3Q18 was 52.6% up from 37.0% in 3Q17, reflecting the impact of lower NEP due to the 2017 Earnings Curve Review. Excluding the impact of the 2017 Earnings Curve Review the loss ratio would have been 38.6%.
The Expense Ratio in 3Q18 was 32.5% compared with 29.7% in 3Q17, reflecting the lower NEP.
Investment Income of $21.5 million in 3Q18 was up 38% on the prior corresponding period (3Q17: $15.6 million). The 3Q18 Investment Income included a pre-tax mark-to-market unrealised loss of $1.2 million ($0.8 million after-tax) versus a pre-tax mark-to-market unrealised loss of $12.0 million ($8.4 million after-tax) in 3Q17.
As at 30 September 2018 the value of Genworth’s investment portfolio was $3.2 billion, more than 90% of which is held in cash and highly rated fixed interest securities and $169 million of which is invested in Australian equities in line with the Company’s low volatility strategy. After adjusting for mark-to-market movements the 3Q18 investment return was 2.80% p.a. marginally down from 2.88% in 3Q17.
S&P Global Ratings has maintained its low risk insurance industry and country risk assessment (IICRA) for Australia’s mortgage insurance sector, awarding the second strongest rating on a six point scale.

According to a release from the ratings agency, “In our opinion, product risks for mortgage insurers remain elevated, reflecting the recent history of sustained house price appreciation across the Australian housing market.
“House prices in Australia’s major cities of Melbourne and Sydney have declined in the past 12 months, easing some risk attributes. We expect the house price declines in Australia’s largest cities to be orderly, while risks associated with slow wage growth and relatively high debt to income levels remain,” the statement continued.
Responding to the results, QBE chief executive officer Phil White says the low risk is due to the Australian market’s high diversification.
Speaking to Australian Broker, he said the diversification in borrower profiles, geographic distribution of mortgages, and the range of banks with LMI in the marketplace enhances strength.
“Diversification is one of the fundamental things that underpins Australia. The second part is how LMI was designed to meet the needs of our market. The regulatory regime here is extremely good and that is underpinned also by a very disciplined underwriting environment.
“I’m not too worried about some of the scare mongering there might be around the forecast for house prices or the economy more broadly. LMI has been designed to suit the Australian market and the future for it right now is quite positive,” he continued.
However, Martin North, principal of Digital Finance Analytics, says the current environment is “risk on” and, noting rising delinquencies in WA and other areas, those risks are set to rise.
“Generally it is risk on for the insurers and the majors. The banks that have released their financial results this reporting season are showing slightly higher 90 day plus delinquency rates and that was also true in the most recent Moody’s report. It’s not a huge increase but the trend is definitely up.”
Drawing on independently collated data, North says 30.4% of owner occupied borrowing households are finding it difficult to manage repayments currently. This equates to 970,000 households, of which more than 23,000 are in severe stress.
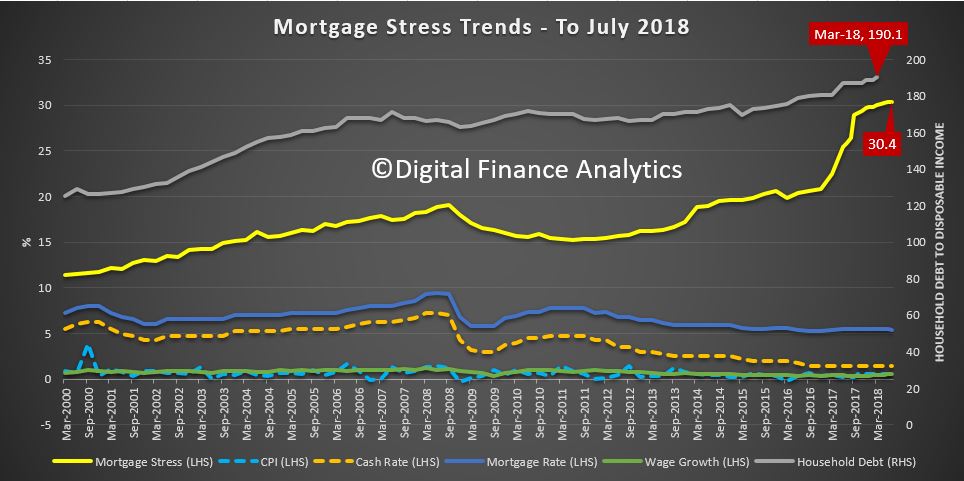
“They’re making the payments but it’s difficult and this is the highest that number has ever been,” he commented.
In contrast to S&P’s outlook, North concluded, “Mortgage rates will rise slightly because of international funding pressures. Of course the US will put its rate up once or twice more this year and that will flow through. It’s risk on rather than risk off and I think we need to watch this very closely.”
We discuss LMI in the light of the recent Productivity Commission Report.
Please consider supporting our work via Patreon ;
Please share this post to help to spread the word about the state of things….

We suspect that when Genworth went public a few years ago, they did not necessarily consider the extra scrutiny such a listing warrants, especially in a home lending sector which is now under more pressure. This pressure is reflected in their 1H18 results and is a bellwether for the wider housing sector. Actually I think they are doing much right, given the market context but its a tough gig.
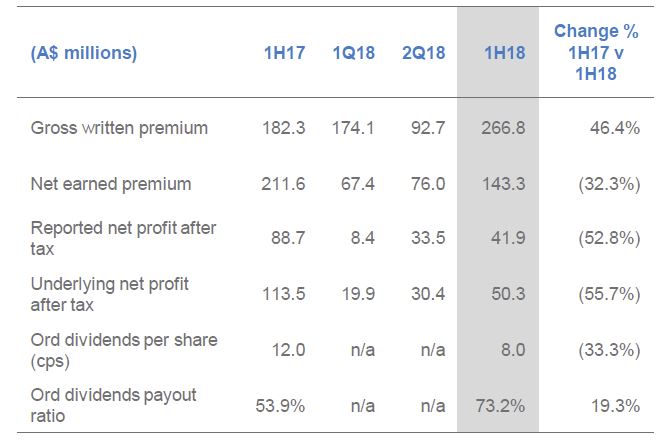
The Group reported a 2018 statutory interim net profit after tax of $41.9 million, down 52.7% from $88.7 million in the prior corresponding period mainly driven by the adverse impact from the change in earnings curve conducted in 2017 which resulted lower earned premium.
On 1 August 2018, the Directors declared a 100% ordinary franked dividend of 8.0 cents per share totalling $36,817,000 and a 100% franked special dividend for 4.0 cents per share totalling $18,409,000.
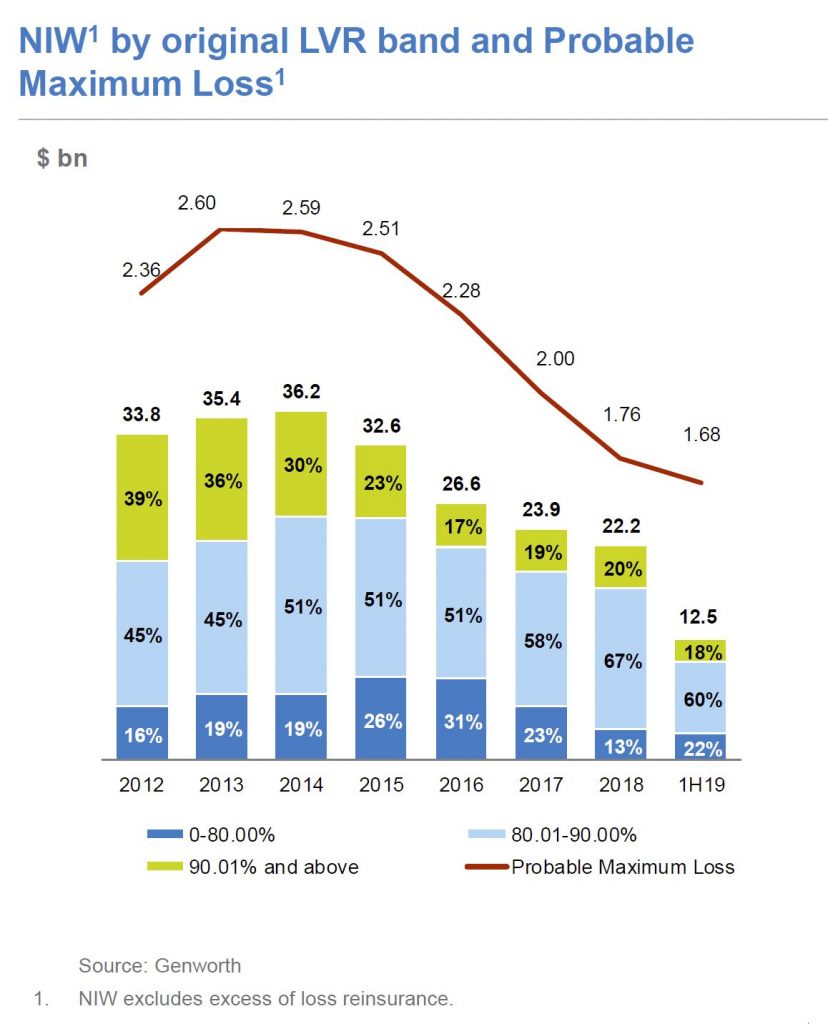
 New business volume, as measured by New Insurance Written (NIW), decreased 21.4% to $10.3 billion in 1H18 compared with $13.1 billion in 1H17. NIW in 1H18 included $1.1 billion of bulk portfolio business versus $2.1 billion of bulk portfolio business in 1H17. NIW excludes the Company’s excess of loss reinsurance and the new business written via Genworth’s Bermudan entity.
The decline in NIW in 1H18 compared to 1H17 reflects the $1.0 billion reduction in bulk portfolio business and the fact that 1H17 included business written pursuant to an agreement with the Company’s then second largest customer. This agreement terminated in April 2017 and represented $2.5 billion of NIW in 1H17.
Gross Written Premium (GWP) increased 46.4% to $266.8 million in 1H18 (1H17: $182.3 million). This includes the new business written via Genworth’s Bermudan entity and the new Micro Markets LMI business. As disclosed at the time of the Company’s 1Q18 Results announcement Genworth has retained $170.2 million of risk and placed the remainder with a consortium of global reinsurers through its Bermudan entity. Net of the premium to the consortium of global reinsurers, Genworth’s GWP increased 12.0% in 1H18 as a result of this transaction. For reporting purposes this risk is not reflected in NIW. In terms of the traditional LMI business, volumes were down 6% from 1H17 following termination of the Company’s then second largest customer contract in April 2017. This was partially offset by a higher LVR mix which resulted in a higher average price for written premiums.
The expense ratio increased to 32.9% from 25.9% in the prior corresponding period mainly reflecting lower net earned premium in the current period. The reported loss ratio increased from 34.8% at 30 June 2017 to 53.3% at 30 June 2018 reflecting primarily lower net earned premium in the current period.
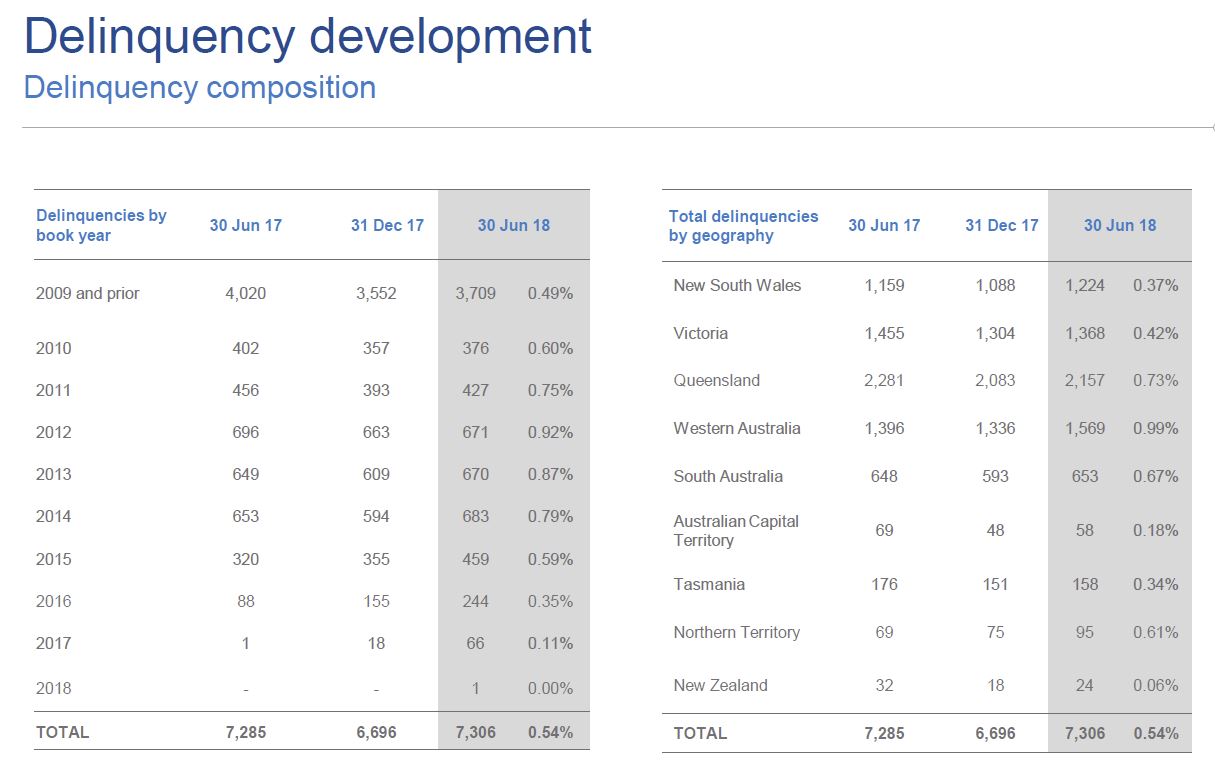 The Delinquency Rate (number of delinquencies divided by policies in force but excluding excess of loss insurance) increased from 0.51% in 1H17 to 0.54% in 1H18. This was driven by two factors. Firstly, there was a decrease in the policies in force following completion of the Lapsed Policy Initiative. The second (lesser) factor impacting the delinquency rate has been an increase in the number of delinquencies in Western Australia, New South Wales and to a lesser extent South Australia. This was partially offset by a decrease in delinquencies in Victoria and Queensland. New delinquencies were down in the half (1H18: 5,565 versus 1H17: 5,997). Delinquencies in mining areas are showing signs of improving. In non-mining regions there are indications of a softening in cure rates. These are being closely monitored to ascertain any developing adverse trends. WA continues as primary contributor to deterioration in 2013-14 vintages due to ongoing economic and housing market challenges following the downturn in the mining sector.
 The market capitalisation of the Company as at 30 June 2018 was $1.2 billion based on the closing share price of $2.57.
The Group’s regulatory capital at 30 June 2018 was 1.90 times the Prescribed Capital Amount (“PCA”) and the Common Equity Tier 1 (“CET1”) ratio was 1.71. Regulatory capital exceeds the Group’s targets and reflected a strong capital position.
In early 2017 Genworth commenced a Strategic Program of Work designed to enable it to effectively compete in a market of evolving borrower and lender expectations, resulting from technological advances and regulatory change.
As part of its Strategic Program of Work the Company announced in 1Q18 that it had entered into agreements with lender customers to provide new product offerings that are complementary to its traditional lenders mortgage insurance (LMI). These new offerings included a bespoke risk management solution via a newly established Bermudan insurance entity, micro markets LMI and excess of loss cover.
In 2Q18 the Company continued the momentum of its Strategic Program of Work. Over the past 12 months Genworth has worked with a technology partner to develop a new automated underwriting decision engine (Auto Decision Engine) which will be launched later this year. This initiative will deliver operational efficiencies and provide the business with greater underwriting risk management insights.
Also of note is Genworth’s investment in Tictoc Online Pty Limited (Tic:Toc). Tic:Toc is a fintech in the online origination space. In addition to a small equity stake in Tic:Toc, Genworth has been appointed the exclusive provider of LMI on Tic:Toc’s digital loan platform. Tic:Toc’s digital loan platform operates both as a direct-to-consumer platform and as a partner platform.
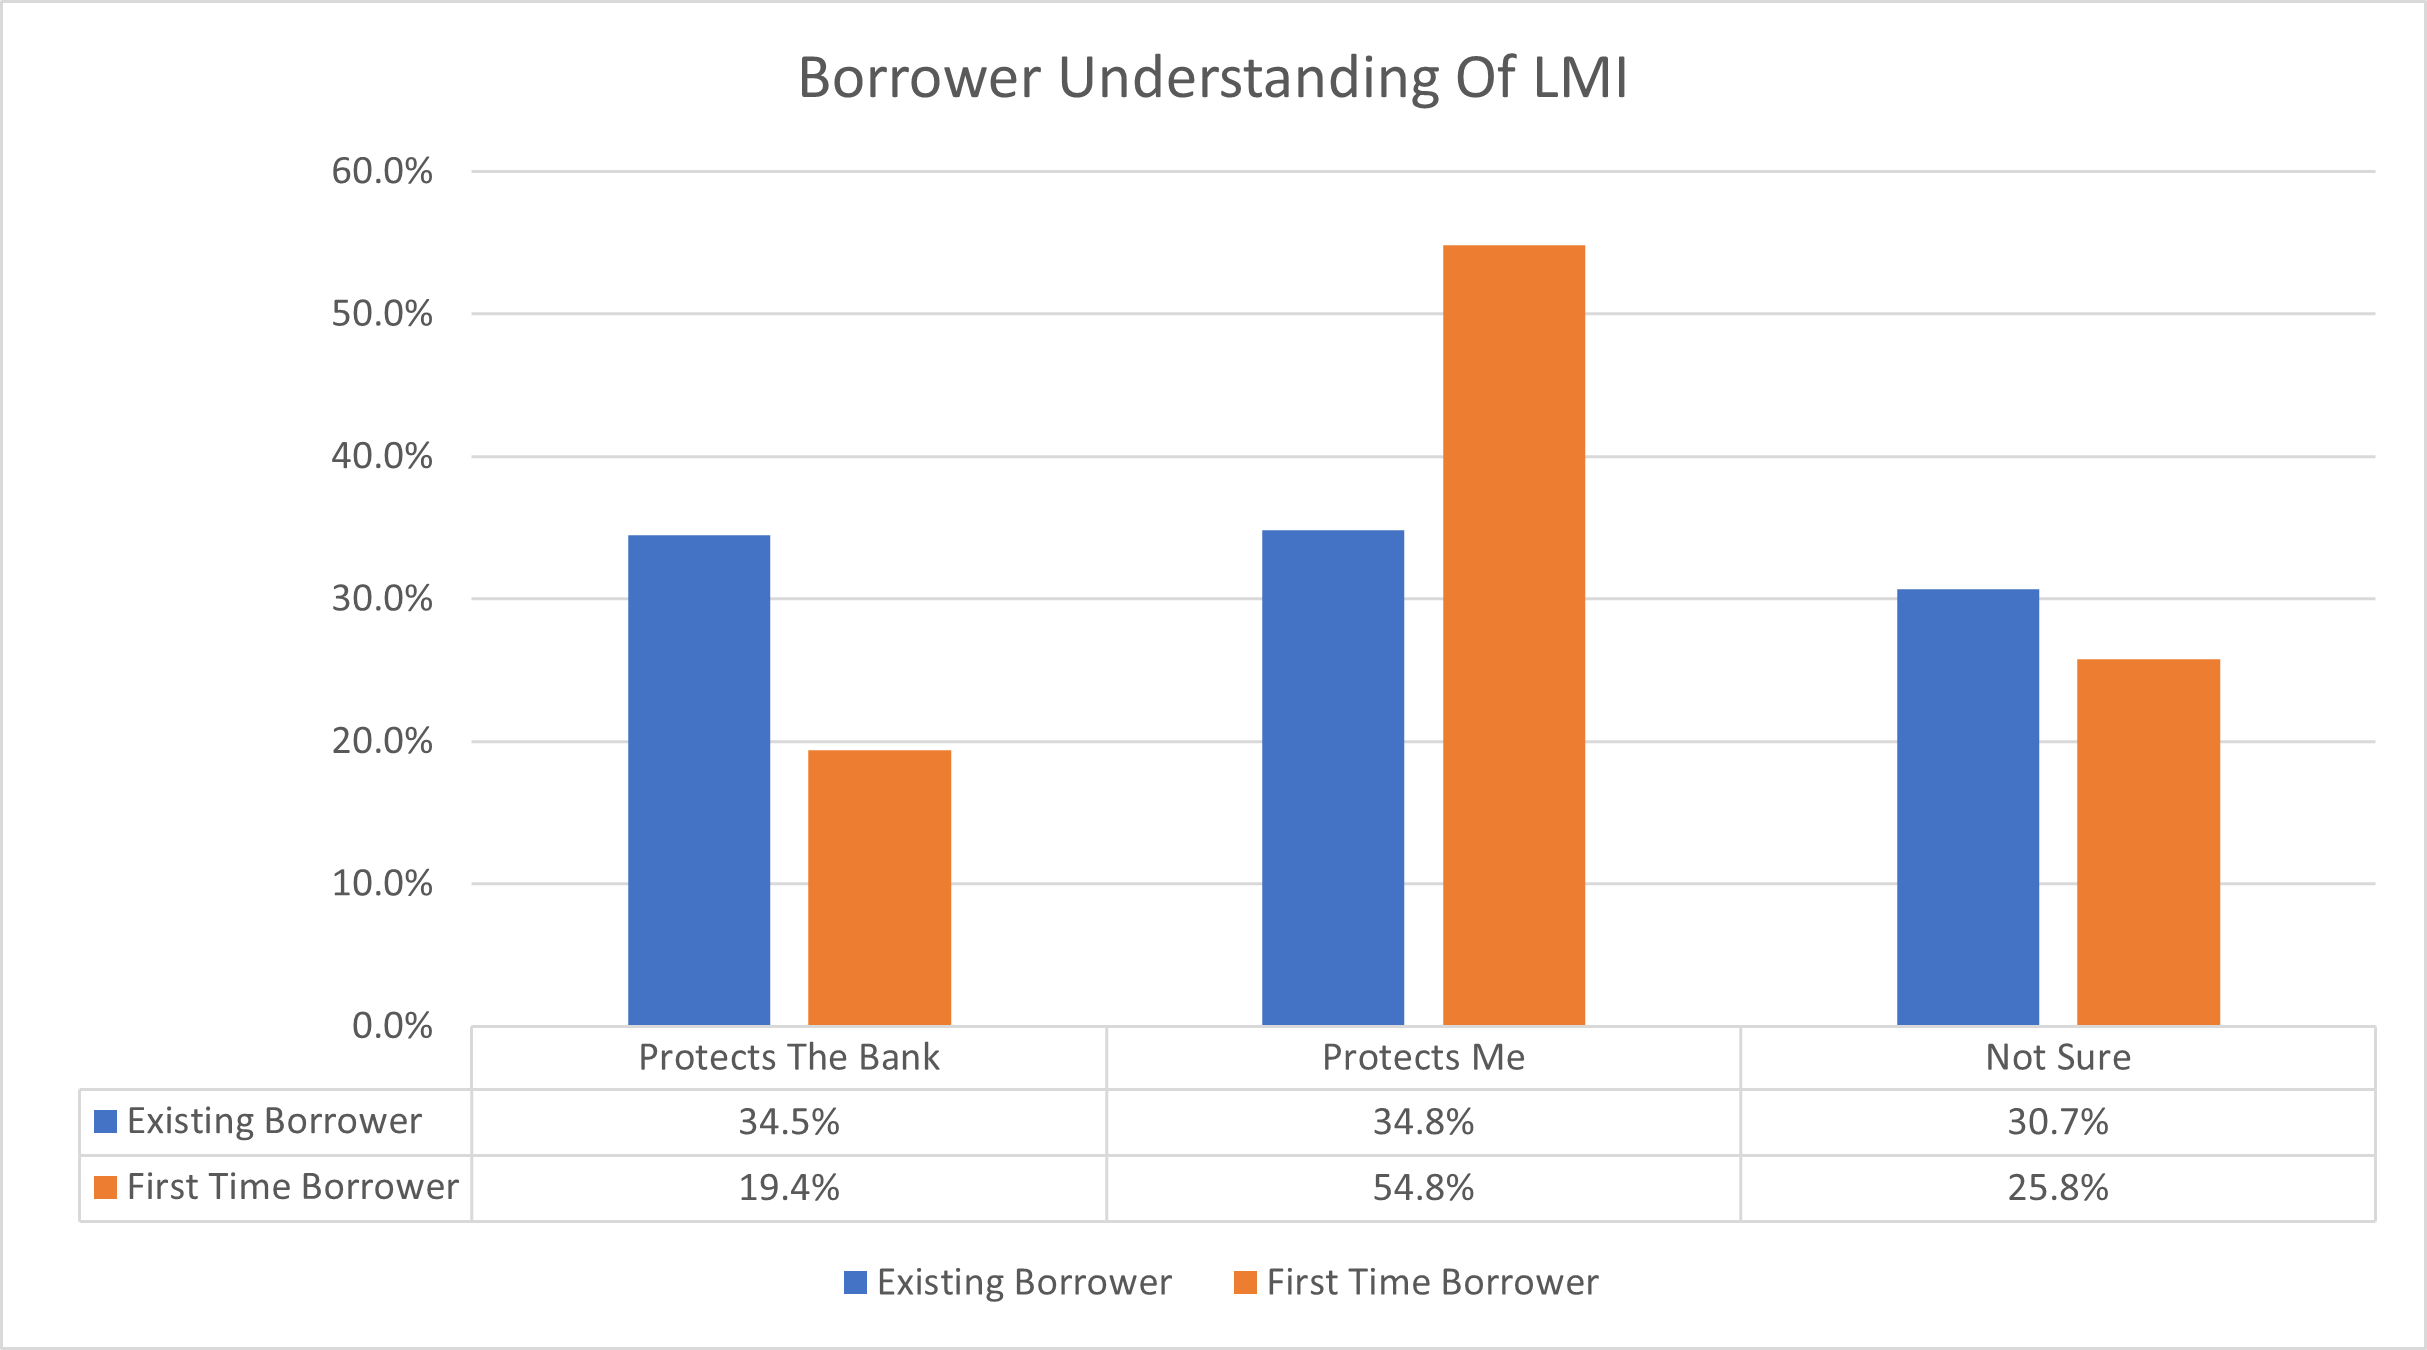
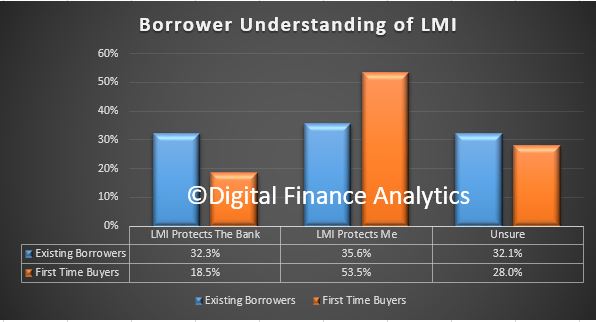
More than two in five prospective home buyers have admitted to not understanding Lenders Mortgage Insurance (LMI), according to new data.
This chimes with our research on the topic of LMI from our own surveys. In fact the confusion varies by type of buyer, and who is protected. First Time Buyers are a particular concern. See our previous post “Is Lenders Mortgage Insurance a Good Thing“.
Mortgage Choice and CoreData’s new Evolving Great Australian Dream 2018 whitepaper found 42.1% of respondents said they were not sure what LMI was, yet a third (32%) said they would need to pay it in order to get into the property market.
“Our data found that a majority of home buyers are in the dark when it comes to Lenders Mortgage Insurance and what it entails,” Mortgage Choice Chief Executive Officer Susan Mitchell said.
“According to our survey, only 32.1% of prospective buyers accurately stated that LMI is designed to protect the lender if a borrower can’t repay their mortgage.
“Another 8.2% of respondents thought LMI protected the borrower, while 17.6% believed it protected both the borrower and the lender,” said Ms Mitchell.
The research found that 44.8% of women did not to understand what LMI was, compared to 37.35% of men.
Buyers aged 29 and under (47.3%) were the most likely not to know what LMI was, while the 50 to 59 age group (40.75) had the highest proportion of buyers who knew what LMI was.
On a state by state comparison, Victoria (46%) had the highest proportion of buyers who did not know what LMI was, followed by Queensland (40%) and Western Australia (39.6%). NSW buyers topped the states when it came to correctly defining LMI at 34.6%.
Ms Mitchell said it was concerning that such a large proportion of Australians had either a limited or no understanding of LMI and that mortgage brokers can play an educational role for borrowers.
“For many first home buyers, LMI is likely to be a cost they have to pay to get into the property market, particularly if they do not have a deposit that is at least 20% of the purchase price,” she said.
“The reality is that saving for a home deposit is a major challenge for first home buyers and this has been the result of strong price growth over the last few years.
“According to CoreLogic, the median dwelling value in Australia is $554,605, and for a first home buyer to avoid LMI, they would need to save $110,921 for a 20% deposit and they would still need to have additional funds to cover costs such as legal fees and stamp duty.
“That is quite large sum to save and it only increases if a buyer is looking in cities such as Sydney and Melbourne.
“While LMI on the surface seems like a fee to be avoided, it does have the benefit of helping a buyer purchase a home with a smaller deposit, thereby allowing them to get onto the property ladder sooner rather than later.
“A buyer can choose to delay their property purchase to save a sufficient deposit, but the reality is property prices have risen consistently and the longer they delay, the more likely they are to miss an opportunity.
“Ultimately, in the long run, LMI is a fairly small expense in the overall cost of purchasing a home.”
Ms Mitchell said first home buyers could avoid LMI altogether if they were able to receive some sort of financial boost or a have a guarantor on their loan.
“First home buyers can avoid LMI by having a parent or family member go guarantor on their home loan, which then allows them to purchase without a 20% deposit” she said.
“In the case of the latter, it is important to note that lenders may require that any monetary gift must be held in an account for at least three months before home loan approval. Also, a lender may still require a borrower to demonstrate that they have 5% genuine savings.”
Ms Mitchell said it was important for first home buyers to have a good understanding of the purchase process.
“If you’re a first home buyer, you should speak to a mortgage broker who can guide you through the process of purchasing a property, from getting the best rate as part of the home loan application, through to settlement.
“They can explain the various options and costs involved, including LMI, thereby ensuring that you can confidently achieve your goal of home ownership,” concluded Ms Mitchell.
“As property prices continue to relax there has never been a better time for first home buyers to purchase. Therefore, it’s essential they have a clear understanding of LMI so that they know how it affects their ability to get into the market.”
Lenders Mortgage Insurance is a tough gig, because they tend to get the higher risk loans, written at higher loan to value ratios. So, perhaps no surprise that in the current environment, of tougher lending conditions, and high debt, we continue to see a drop in new business and a rise in delinquencies. Significantly, there was a rise in NSW delinquencies, the most populous state, with the biggest loans! “In non-mining regions there are indications of a softening in cure rates, in particular in NSW and Western Australia. These are being closely monitored to ascertain any developing adverse trends”.
Genworth Mortgage Insurance Australia Limited has reported statutory net profit after tax (NPAT) of $8.4 million and underlying NPAT of $19.9 million for the quarter ended 31 March 2018 (1Q18). This is down 70.9% on prior corresponding period (though 1Q17 underlying NPAT included a $20.8 million realised gain resulting from a re-balancing their investment portfolio).
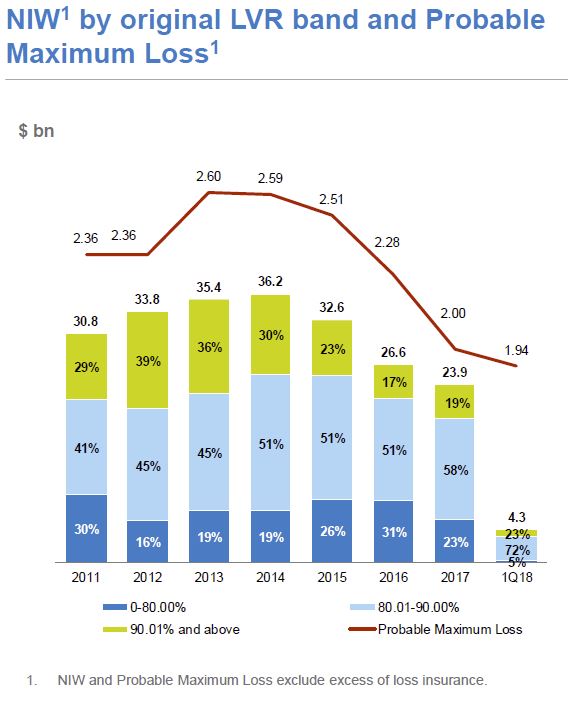
New business volume, as measured by New Insurance Written (NIW), decreased 36.8% to $4.3 billion in 1Q18 compared with $6.8 billion in 1Q17.
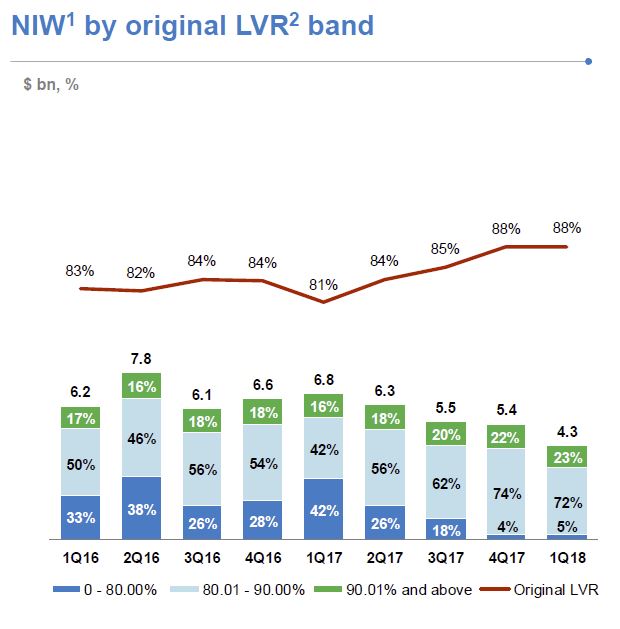 NIW excludes excess of loss insurance and the new business written via Genworth’s Bermudan entity. NIW reflects the fact that: i) there were no bulk portfolio transactions in 1Q18 (1Q17 included $1.3 billion of bulk portfolio business); and ii) 1Q17 included business written pursuant to an agreement with the Company’s then second largest customer. This agreement terminated in April 2017 and represented $1.6 billion of NIW in 1Q17.
 Gross Written Premium (GWP) increased 97.4% to $174.1 million in 1Q18 (1Q17: $88.2 million). This includes the new business written via Genworth’s Bermudan entity and the new Micro Markets LMI business. Genworth has retained $170.2 million of risk and placed the remainder with a consortium of global reinsurers through its Bermudan entity. Net of the premium to the consortium of global reinsurers, Genworth’s GWP increased 26.5% in 1Q18. For reporting purposes this risk is not reflected in NIW. In terms of the traditional LMI business written during the quarter, the lower volumes were partially offset by the higher LVR mix resulting in a modest increase in the average price of the flow business.
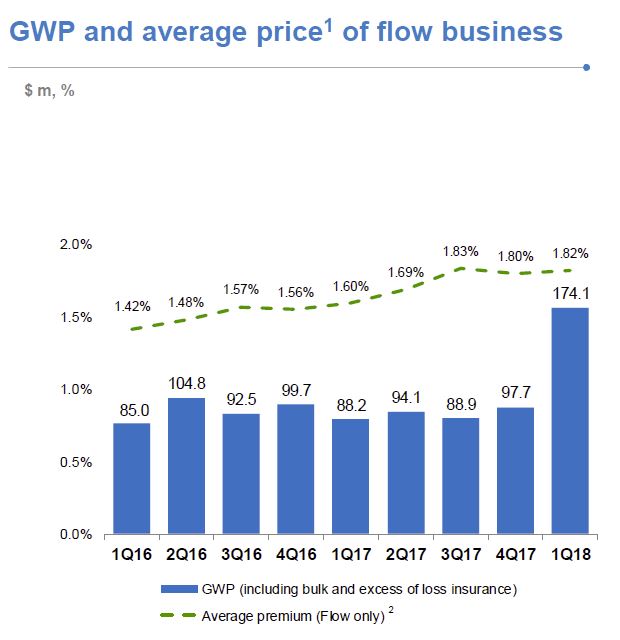 Net Earned Premium (NEP) decreased 37.5% from $107.9 million in 1Q17 to $67.4 million in 1Q18. This reflects the $32.3 million impact of the 2017 Earnings Curve Review and lower earned premium from current and prior book years. Excluding the 2017 Earnings Curve Review impact, NEP would have declined 7.6%. The 2017 Earnings Curve Review took effect from 1 October 2017 and has the effect of lengthening the period of time over which premium is earned. It does not however affect the quantum of revenue that will be earned over time. The unearned premium reserve as at 31 March 2018 was $1.2 billion.
The delinquency rate increased slightly from 0.48% in 1Q17 to 0.49% in 1Q18, driven by Western Australia and New South Wales (NSW).
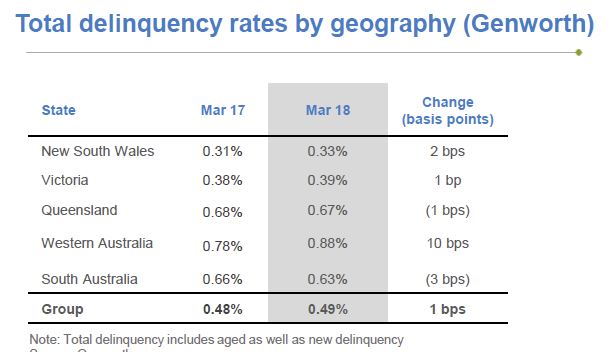 South Australia and Queensland experienced lower delinquency rates, whilst the delinquency rate in Victoria increased marginally. All states experienced a decline in new delinquencies, with the exception, of Western Australia. Delinquencies in mining areas are showing signs of improving. In non-mining regions there are indications of a softening in cure rates, in particular in NSW and Western Australia. These are being closely monitored to ascertain any developing adverse trends.
 Net Claims incurred was stable during the quarter at $37.7 million (1Q17: $37.6 million). The loss ratio in 1Q18 was 55.9%, up from 34.8% in 1Q17, reflecting the impact of lower NEP due to the 2017 Earnings Curve Review. Excluding the impact of the 2017 Earnings Curve Review the 1Q18 loss ratio would have been 37.8%.
 The expense ratio in 1Q18 was 33.5% compared with 25.2% in 1Q17, reflecting the lower NEP and expenditure on the Strategic Program of Work.
Investment income of $7.8 million in 1Q18 included a pre-tax mark-to-market loss of $16.4 million ($11.5 million after-tax). In the first quarter of 2017, the portfolio was restructured to reduce interest rate risk exposure, resulting in pre-tax realised gains of $29.7 million ($20.8 million after tax). This gain was included in the underlying NPAT reported in 1Q17. As at 31 March 2018 the value of Genworth’s investment portfolio was $3,285.4 million, more than 83% of which is held in cash and highly rated fixed interest securities. The Company had $216.9 million invested in Australian equities as at 31 March 2018. Whilst volatility in equity markets contributed to unrealised losses in 1Q18, the equity portfolio has delivered a return of 8.9% p.a. (pre-tax) since inception in 2016.
They continue to be focused on an optimal capital structure to maintain the Board’s targeted Prescribed Capital Amount (PCA) of 1.32 to 1.44 times. So they announced an on-market share buy-back of up to a value of $100 million, subject to shareholder approval at the Annual General Meeting 10 May 2018.
The public hearings which the Productivity Commission has been running in relationship to Competition in Financial Services covered a wide range of issues.
 One which has surfaced is the Lenders Mortgage Insurance (LMI) sector. With 20% of borrowing households required to take LMI, and just two external providers (Genworth and QBE LMI), the Commission has explored the dynamics of the industry. They called it “an unusual market”, where there is little competitive pricing nor competition in its traditional form. Is the market for LMI functioning they asked? Could consumers effectively be paying twice?
On one hand, potential borrowers are required to pay a premium for insurance which protects the bank above a certain loan to value hurdle. That cost is often added to the loan taken, and the prospective borrower has no ability to seek alternatives from a pricing point of view.
Banks who use external LMI’s appear not to tender competitively.
On the other hand, ANZ, for example has an internal LMI equivalent, and said it would be concerned about the concentration risk of placing insurance with just one of the two external players, as the bank has more ability to spread the risks. The Commission probed into whether pricing of loans might be better in this case, though but the bank said there were many other factors driving pricing.
All highly relevant given the recent APRA suggestion that IRB banks might get benefit from lower capital for LMI’s loans, whereas today there is little capital benefit.
This will be an interesting discussion to watch as it develops towards the release of the final report.
They had already noted that consumers should expect to receive a refund on their premium if they they repay the loan.
