LVR Limits And Home Prices

The Reserve Bank New Zealand has released a paper “Loan-to-Value Ratio Restrictions and House Prices”. 

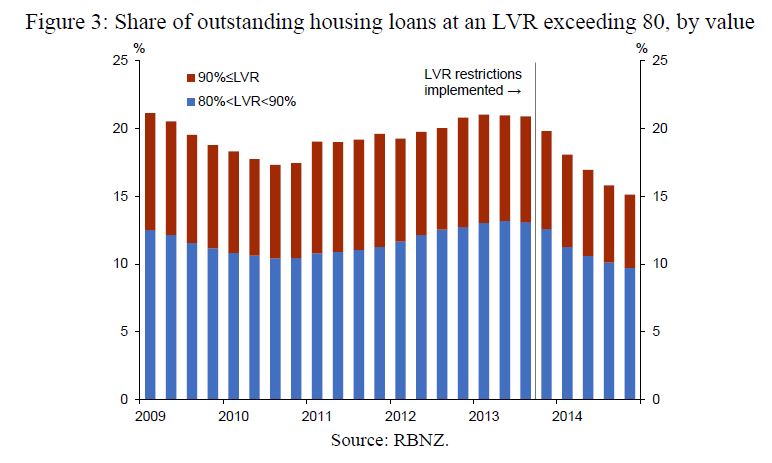
Their analysis shows that LVR limits do have an impact on home prices. But the relationship is not linear, and needs to be binding to have significant impact.

This paper contributes to the international policy debate on the effect of macroprudential policy on housing-market dynamics. We use detailed New Zealand housing market data to evaluate the effect of loan-to-value ratio (LVR) restrictions on house prices. The main challenge in identifying these effects is that housing markets are affected by a range factors over and above LVR policy. For example, New Zealand experienced a raft of policy changes and macroeconomic shocks during the periods in which LVR policy changes were implemented. Many of these shocks and policies are likely to have affected the housing market. For example, when the first LVR policy was implemented, retail interest rates were rising alongside an increasing expectation for monetary policy tightening, while the New Zealand Treasury was adjusting housing-related policies at the time of the second LVR policy. This paper uses the exemption for new builds from the LVR restrictions as a natural experiment to identify the effect of LVR policy.

We find that, over the one year window around the new home exemption, the first LVR policy (referred to as ‘LVR 1’) had a 3 percent moderating effect on house prices, and this moderating effect is broadly similar across both Auckland and the rest of New Zealand.

Interestingly, our estimates show that LVR 2 (which tightened restrictions on Auckland properties and loosened restrictions elsewhere) did not significantly stop Auckland house prices from rising. By contrast, house prices in the rest of New Zealand (RONZ) increased by 3 percent due to the relative loosening of the LVR restriction. In LVR 3, the RBNZ further tightened the LVR restrictions on property investors nationwide. The moderating effect of LVR 3 was clearly seen in Auckland with a 2.7 percent reduction in house prices. This LVR 3 effect is both statistically and economically significant, as during the same period the average house price increased by 5.8 percent.

Overall, we estimate that the LVR policies reduced house price pressures by almost 50 percent. However, the effect of LVR policy is highly non-linear. When it becomes binding, LVR policy can be very effective in curbing housing prices.

Getting Deep and Dirty On Mortgage Risk

We have been busy adding in new functionality to our Core Market Model, which is our proprietary tool, drawing data from our surveys and other public and private data sources to model and analyse household finances.

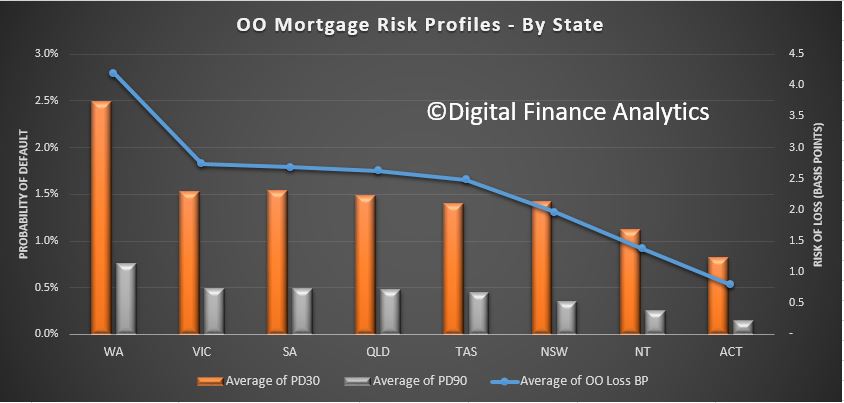
We measure mortgage stress on a cash flow basis – the October data will be out next week – and we also overlay economic data at a post code level to estimate the 30-day risk of default (PD30). But now we have added in 90-day default estimates (PD90) and the potential value which might be written off, measured in basis points against the mortgage portfolio. We also calibrated these measures against lender portfolios.

So today we walk though some of the findings, and once again demonstrate that granular analysis can provide a rich understanding of the real risks in the portfolio. Risks though are not where you may expect them!

First we look risks by by state. This chart plots the PD30 and PD90 and the average loss in basis points. WA leads the way with the highest measurement, then followed by VIC, SA and QLD. The ACT is the least risky area.

So, looking at WA as an example, we estimate the 30-day probability of  default in the next 12 months will be 2.5%, 90-day default will be 0.75% and the risk of loss is around 4 basis points. This is about twice the current national portfolio loss, which is sitting circa 2 basis points.

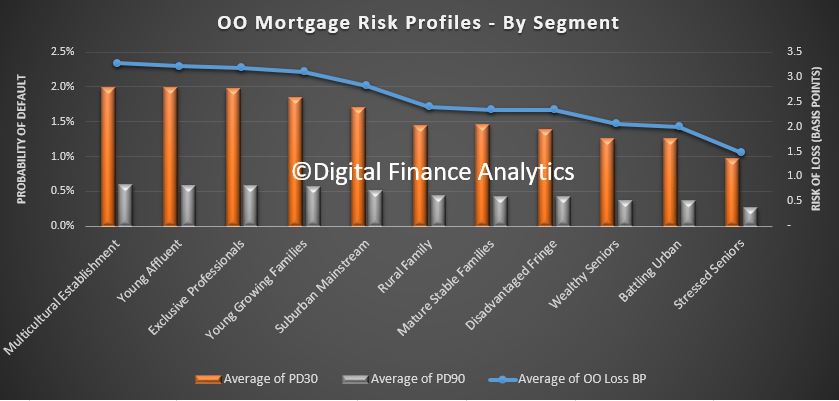
Turning to our master household segmentation, we find that our Multicultural Establishment segment has the highest basis point risk of loss, at around 3 basis points, followed by Young Affluent, Exclusive Professionals and Young Growing Families. This immediately shows that risk and affluence are not totally connected. In fact our lower income groups, are some of the least risky. The PD30 and PD90 follows this trend too.

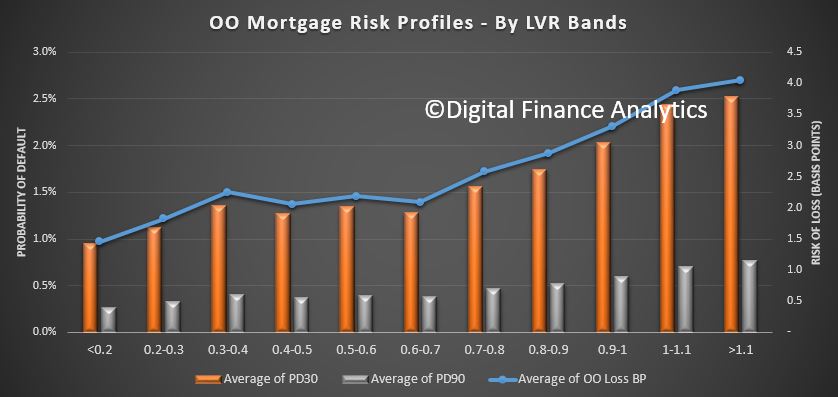
The Loan to Value bands show some correlation to risk, although the slope of the curve is not that aggressive, indicating that LVR as a risk proxy is not that strong. This is because in a rising market, LVRs will rise automatically, irrespective of serviceability.

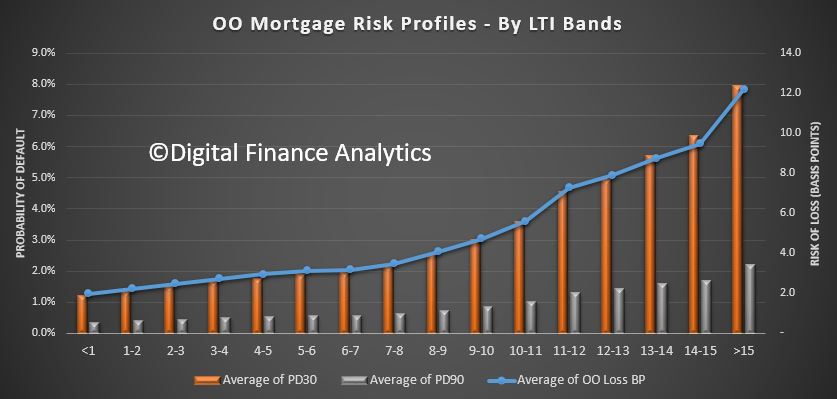
A more sensitive measure of risk is Loan To Income (which APRA mentioned yesterday for the first time!). Here we see a significant rise in risk as LTI rises. Above 6 times income the risk starts to rise, moving from around 3 basis points, to 6 basis points at an LTI of 10, and 12 basis points at an LTI of 15+. So rightly LTI should be regarded as the leading risk indicator, yet many lenders are yet to incorporate this in their models. It is better because in the current flat income environment, income ratios are key.

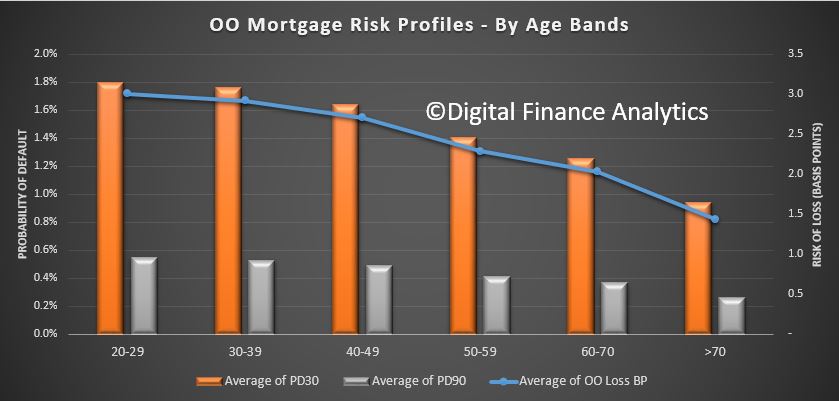
Age is a risk indicator too, with households below 40 showing a higher risk of loss (3 basis points) compared with those over 50 (2.25). Even those into retirement will still represent some level of risk.

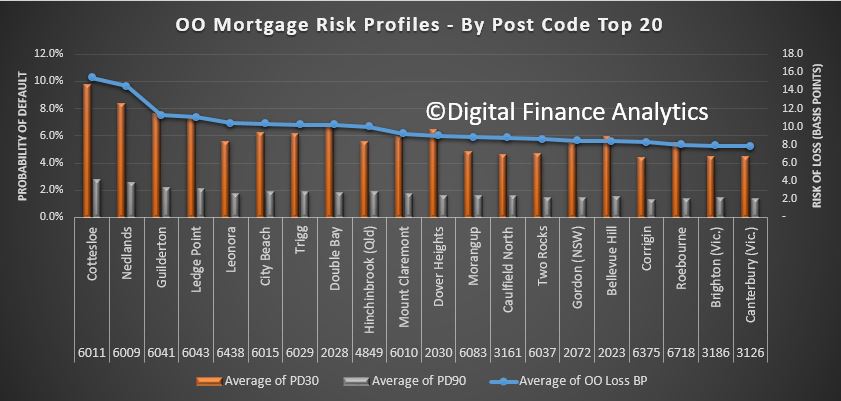
Finally, and here it gets really interesting, we can drill down into post codes. We plotted the top 20 most risky post codes across the country from a basis points loss perspective. What we found is that in the top 20 there is a high representation of more affluent post codes, especially in WA, with Cottlesloe, Nedlands and City Beach all registering. We also find places like Double Bay and Dover Heights in Sydney, Hinchenbrook  in QLD and Caulfield in VIC appearing. These are, on a more traditional risk view, not areas which would be considered higher risk, but when we take the size of the loans and cash flows into account, they currently carry a higher risk profile from an absolute loss perspective.

So, we believe the time has come for more sophisticated, data driven analysis of mortgage risks. And risks are not where you might think they are!

Understanding Household Income, Wealth and Property Footprints

Today we commence the first in a new series of posts which examines household wealth, income, property and mortgage footprints. We will look at the latest trends in LVR and LTI; highly relevant given the tightening standards being applied in other countries, including Norway and New Zealand. We will be using data from our rolling household surveys, up to 9th September 2016.

Today we paint some initial pictures to contextualize our subsequent more detailed analysis, which will flow eventually into the next edition of the Property Imperative, due out in October 2016.

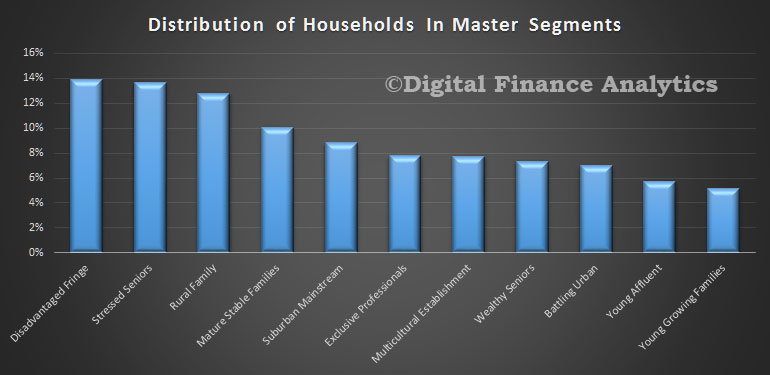
To start the analysis we look at the relative distribution of our master household segments. You can read about our segmentation approach here.

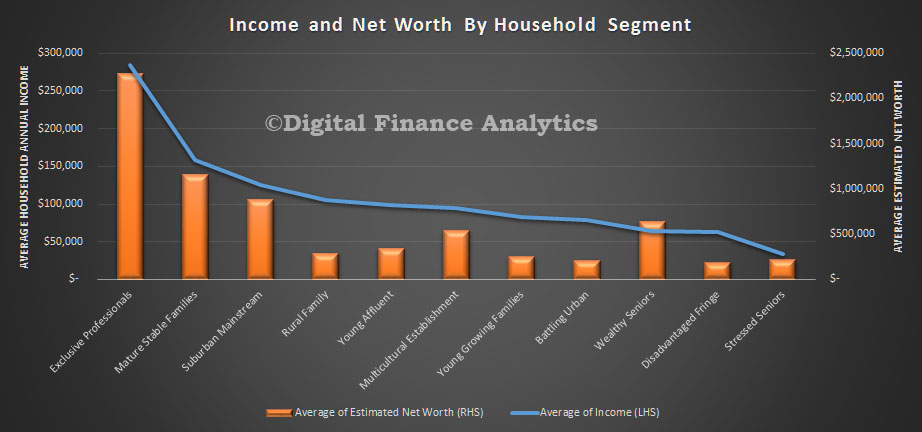
segment-distNext we show the relative household income and net worth by our master segments. The average household across Australia has an estimated annual income of $103,500 and an average net worth (assets less debts) of $600,600; the bulk of which is property related.

segments-income-and-wealthThere are wide variations across the segments. The most wealthy segment has an average annual income of more than eight times the least wealthy, and more than ten times the relative net worth.

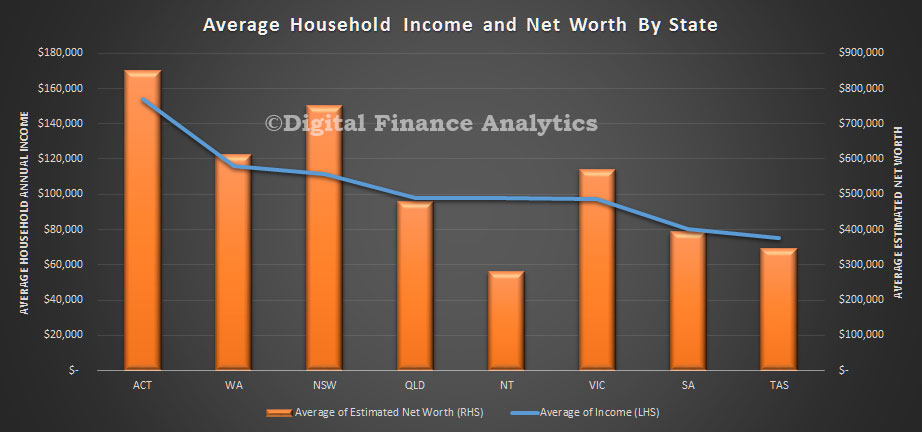
Across the states, the ACT has the highest average income and net worth, whilst TAS has the lowest income (half the income), and NT the lowest net worth (third the net worth).

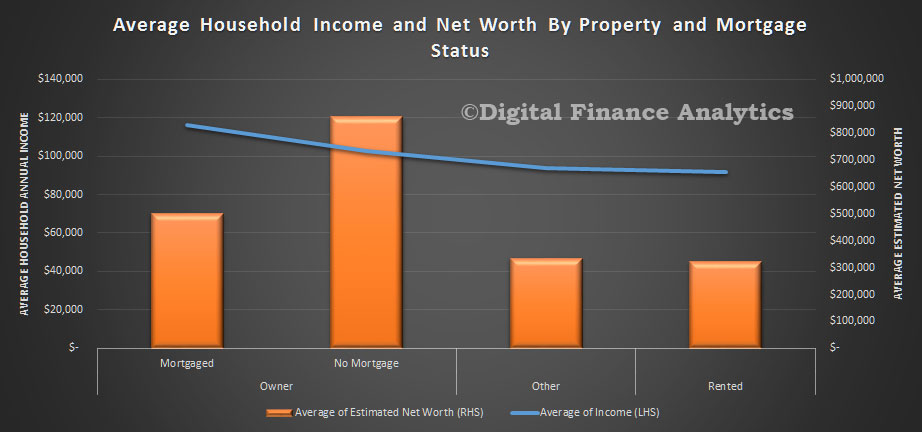
states-income-and-wealthProperty owners are better placed, with significantly higher incomes and net worth, compared with those renting or in other living arrangements. Those with a mortgage have higher incomes, but lower net worth relative to those who own their property outright.

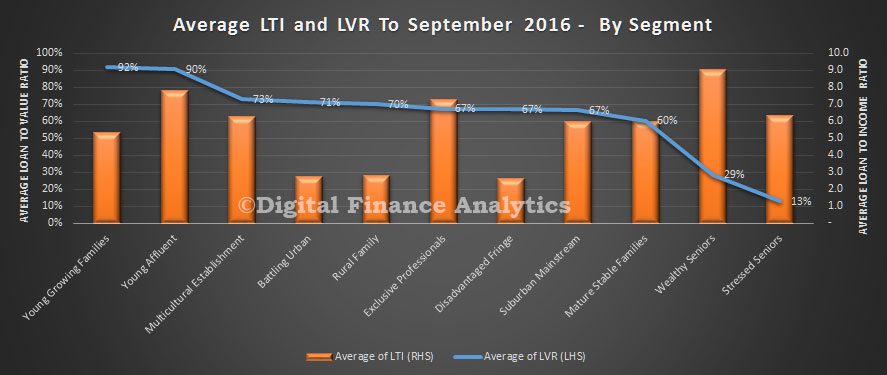
propertys-income-and-wealthThe loan to value (LVR) and loan to income (LTI) ratios vary by segment.

lti-and-lvr-by-segmentYoung growing families, many of whom are first time buyers, have the higher LVR’s whilst young affluent have the higher LTI’s (along with some older borrowers). Bearing in mind incomes are relatively static, those with higher LTI’s are more leveraged, and would be exposed if rates were to rise.

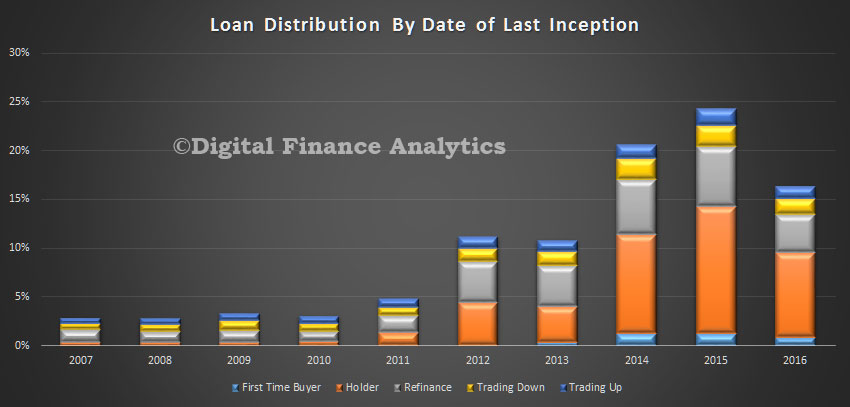
Finally, we see that many loans have been turned over, or refinanced relatively recently, so the average duration of a mortgage is under 4 years.

inceptionThere is a relatively small proportion of much older dated loans which we have excluded from the chart above. Nearly a quarter of all loans churned in 2015, and 2016 shows the year to date count.

Next time we will look at LTI and LVR data in more detail.

Macroprudential, Capital and LVR Controls

A newly released IMF working paper examines the impact of macroprudential controls, including lifting capital ratios, and reducing allowable loan to value (LVR) ratios. They find that first, monetary policy and macroprudential policies related to bank capital are likely to be transmitted through the same channels in the banking system as they both affect the cost of loans. So, they should be expected to reinforce each other. Second, capital buffers or liquidity ratios targeting specific sectoral exposures are likely to be effective in slowing down credit growth in the mortgage market. Third, macro-prudential instruments affecting the cost of capital or the liquidity position could usefully be complemented by instruments related to non-price dimensions of mortgage loans such as limits on LTVs. The evidence also suggests that tightening of LTVs is more effective in slowing down credit growth and house price  appreciation when monetary policy is too loose.

The design of a macro-prudential framework and its interaction with monetary policy has been at the forefront of the policy agenda since the global financial crisis. However, most advanced economies (AEs) have little experience using macroprudential policies, while there is, by contrast, more evidence about macro-prudential instruments aimed at moderating the volatility of capital flows in emerging markets. As a result, relatively little is known empirically about macroprudential instruments’ effectiveness in mitigating systemic risks in these countries, about their channels of transmission, and about how these instruments would interact with monetary policy.

Many countries publish bank lending surveys that provide very useful information on how banks modify the price and non-price terms of loans to the private sector, and on the drivers of these lending conditions. Some of the terms of loans (such as actual loan-to-value ratios (LTVs)) or some of the drivers of the lending standards (such as the cost of bank capital or the liquidity position of a bank) are directly related to macro-prudential instruments considered to be key in the policy toolkit of many jurisdictions. In this paper, we make use of the European Central Bank Lending Survey to develop a methodology and estimate empirically the likely effectiveness of some of these macro-prudential policies, their channel of transmissions and their interactions with monetary policy.

There is thus far little knowledge about how (policy driven) changes in the cost of bank capital (which could be the result of the implementation of a countercyclical capital buffer, of time contingent or sectoral risk weights, or more generally of bank specific changes in the capital adequacy ratio) or in the bank liquidity position would be transmitted to credit supply. Specifically, would such policy actions be transmitted through non-price factors (such as LTVs, collateral requirements, or maturity) or through price factors (such as price margins or fees)? There is also relatively little knowledge about whether limits on LTVs could significantly slow down house price appreciation and/or mortgage loan growth. Should measures affecting capitalization be complemented by non-price measures constraining lending standards? Can some of these macro-prudential policies be effective during housing booms when traditional monetary policy is typically too loose? Assessing such interactions and the transmission channel of macro-prudential instruments, with a specific focus on the real estate market, is important, as shocks to the real estate market have been a key source of systemic risk during the recent financial crisis.

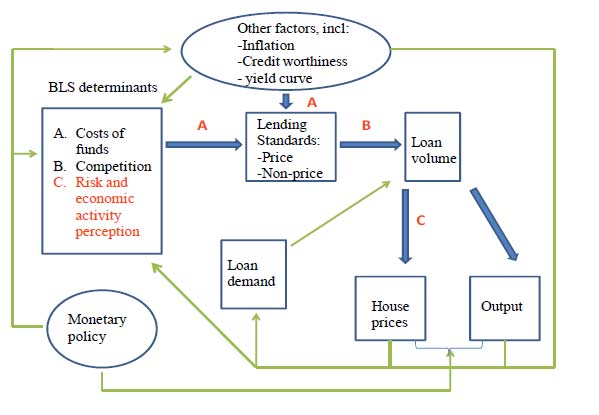
The Euro-system Bank Lending Survey (BLS) contains information on overall changes in lending standards, or net tightening of lending standards and changes in lending standards related to non-price factors (LTVs, collateral requirements, maturity), price factors (such as margins) and factors contributing to the changes in lending standards, including balance sheet characteristics (such as capital and liquidity ratios) which can be mapped to specific macroprudential targets set by national regulators. However, identification of the impact of macro-prudential policies requires addressing specific challenges. The BLS does not require banks to specify the exact nature of the shocks that cause a change in lending standards or in the cost of capital, even though it provides information on perceptions of risks, economic activity, and competition pressures, and their contribution to the change. Hence, our approach is potentially subject to omitted variable bias, reverse causality and measurement bias (as expectations about house prices and credit growth may be mis-measured). Moreover, our observable variables (lending standard, and the contribution of balance sheet factors to lending standard) are not policy variables, which in our case are unobserved shocks affecting our observables. To address these issues, we develop methodologies relying upon instrumental variables and GMM estimators; our study also includes various control variables such as growth prospects, financial conditions, perception of risks and monetary policy cycle. Still, a potential advantage of our approach is that we would be able to capture the impact of the announcement of macro-prudential measures on lending standards, even before the actual implementation of the policy.

IMF-Macro-Modelling-Jan-2016Our main findings are the following. First, our estimates suggest that measures that increase the cost of bank capital are effective in slowing down credit growth and house price appreciation. Second, changes in LTV also impact credit growth and house price appreciation but their impact tends to be more moderate. Third, macro-prudential policies affecting the cost of capital are transmitted mainly through price margins, with very little impact on LTV ratios or other non-price characteristics of mortgage loans. The evidence also suggests that tightening of LTVs is more effective in slowing down credit growth and house price appreciation when monetary policy is too loose.

Note: IMF Working Papers describe research in progress by the author(s) and are published to elicit comments and to encourage debate. The views expressed in IMF Working Papers are those of the author(s) and do not necessarily represent the views of the IMF, its Executive Board, or IMF management.

LVR Data By Lender Type

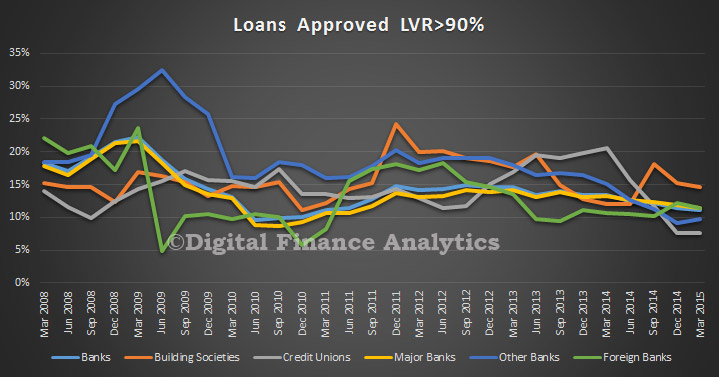
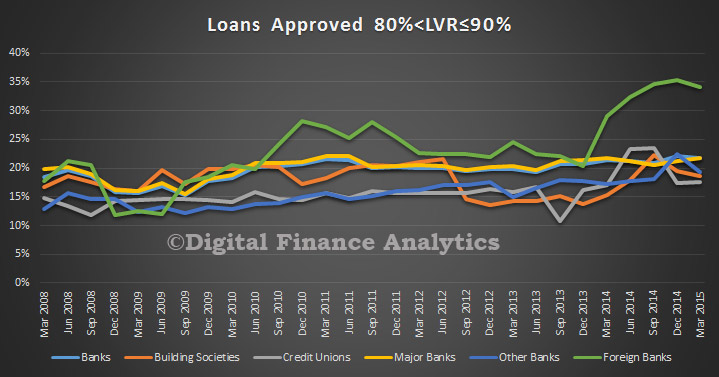
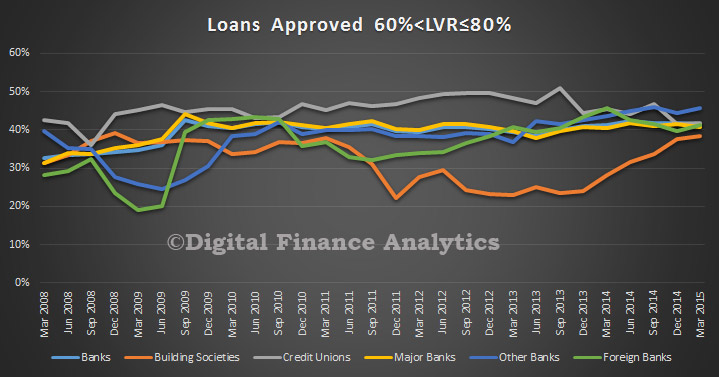
Continuing our analysis of the latest APRA data, we are looking at the LVR mix by type of lender by analysis of the relative ratio of LVR over time, (understanding that some lender categories are relatively small). APRA splits out the ADI data into sub categories, including Major Banks, Other Banks (excludes the Majors), Building Societies, Credit Unions and Foreign Banks. There are some interesting trend variations across these.

In the above 90% LVR category, we see a general drift down, Credit Unions took a dive last year, whilst Building Societies have the highest share of new 90%+ LVR loans, though we see this falling a little now. The Major Banks sit in the middle of the pack. Note that in 2009, Other Banks were writing more than 30% of their loans in this category, today its below 10%.

APRALVRByType90+May2015In the 80-90% LVR range, the Foreign banks, and Other Banks (ie not the big four) showed an uptick, though this may now be reversing. Building Societies and Credit Unions are below the Major Banks.

APRALVRByType90May2015In the 60-80% range, we see the Building Society mix rising in this band, whilst the others have been relatively static.

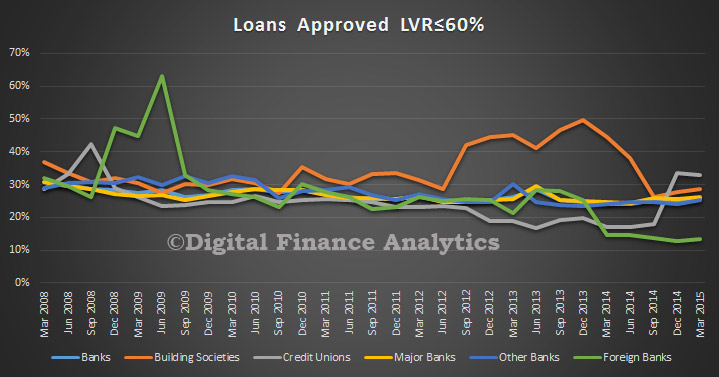
APRALVRByType80May2015Finally, the loans below 60% LVR. Here the Building Society have drop a few points, as they move into the higher LVR bands, though that may be reversing a little now. Foreign Banks share in this band dropped recently, after a spike in 2009.

APRALVRByType60May2015