

/
RSS Feed
Digital Finance Analytics (DFA) Blog
"Intelligent Insight"

We discuss the latest data and its implications
NAB has made a change to its home lending policy amid concerns over the rising household debt to income ratio and as APRA zeroes in on loan serviceability.

From Friday, 16 February, the loan to income ratio used in its home lending credit assessment has been changed from 8 to 7.
“Regulatory bodies have raised concerns about Australia’s household debt-to-income ratio, which has risen significantly over the past decade,” said NAB in a note to brokers.
It said it is committed to ensuring its customers can meet their home loan repayments now and into the future.
With the new change, loan applications with an LTI ratio of 7 or less will proceed as normal and will be subject to standard lending criteria, according to the note.
For an application with an LTI ratio of more than 7, the bank will automatically decline or refer it depending on the income structure, i.e. pay as you go or self-employed.
NAB said its serviceability calculator will be updated to reflect these changes.
The bank introduced an LTI ratio calculation for all home loan applications last year. It was also last year when it started declining interest-only loans for customers with high LTI ratios.
As Australian Broker reported in July 2017, the bank extended the use of LTI calculation to determine the credit decision outcome for all interest-only home loan applications.
NAB said then that tougher serviceability assessments for interest-only loans would help strengthen its lending policies.
The bank’s latest change to its credit policy comes after after ANZ and Westpac made changes to their assessment and approval of borrowers.
Westpac recently introduced strict tests of residential property borrowers’ current and future capacities to repay their loans, to identify scenarios that might affect their ability to service their debts.
From 26 February, brokers who make changes to a loan application that has been submitted to Westpac will have to resubmit it.
Similarly, ANZ added “a higher level of approval for some discretions” used in its home loan policy for assessing serviceability. It was also reported to be clipping the discretion of its frontline mortgage assessors.
Stricter assessment of borrowers’ ability to repay their loans will likely become the norm now that APRA is focusing on serviceability in its proposal that targets higher-risk residential mortgage lending.
The prudential regulator released a discussion paper on 14 February proposing changes to authorised deposit-taking institutions’ capital framework and addressing what it calls systemic concentration of ADI portfolios in residential mortgages.
The Reserve Bank New Zeland has today published the Response to submissions on the Consultation Paper: Serviceability Restrictions as a Potential Macroprudential Tool in New Zealand.
 Given the current slowdown in the housing market, the Reserve Bank considers a serviceability restriction would not be appropriate at present, but could still have a role to play in the future. In particular, the Reserve Bank does not believe DTI restrictions should be deployed in the current housing market environment and considers that the key longer term solution to housing market imbalances is to facilitate growth in housing supply in areas that need it.
In the meantime, they will continue to work with banks to improve the data being received on DTIs. The Reserve Bank is aware that system issues mean data from some banks includes overstated DTI ratios for some customers, and would like this to be gradually improved. The Reserve Bank may also provide further guidance around technical areas such as treatment of guarantees.
This is significant because many of the responses were from lenders who also operate in Australia, so we get a read on their arguments, ahead of the expected APRA paper on mortgage risk. Good DTI data is a problem, but one which could and should be sorted.
This is interesting also, given the broader use of DTI in other jurisdictions (such as the UK) and the view expressed by IMF that DTI should be the macroprudential tool of choice.
Falling back to supply side issues squibs the core demand issues, in our view.
The NZ Reserve Bank received 25 submissions. A majority of submissions that expressed a clear view were against serviceability restrictions being added to the Reserve Bank’s toolkit. On the other hand, there were supportive submissions, and some submissions which went further and suggested serviceability instruments such as a debt-to-income ratio (DTI) restriction should be immediately deployed (not just added to the macroprudential toolkit set out in the MoU as the Reserve Bank had proposed).
Many submissions stated that loan-to-value ratio (LVR) restrictions are currently having a significant effect on the housing market and mortgage lending. Others said with mortgage rates rising recently and the housing market softening, DTI restrictions are not needed now.
Submitters expressed a range of views on whether house prices are currently overvalued. Some submissions stated that supply is the best way to correct imbalances and that LVR or serviceability restrictions cannot permanently solve housing market imbalances.
A number of submissions noted that banks’ own serviceability policies have tightened recently. Some noted that New Zealand consumer law (Credit Contracts and Consumer Finance Act 2003 (CCFA) and the related Responsible Lending Code (RLC)) requires lenders to undertake serviceability assessments. Some banks with Australian parents submitted that they are subject to the Australian Prudential Regulation Authority’s (APRA) prudential practice guide on residential mortgage lending, APG 223.2 Both the RLC and APG 223 require lenders to take the risk of rising interest rates into account when deciding if lending will be affordable.
Most of these points were consistent with the Reserve Bank’s views in the consultation paper. In particular, the Reserve Bank does not believe DTI restrictions should be deployed in the current housing market environment, and considers that the key longer term solution to housing market imbalances is to facilitate growth in housing supply in areas that need it.
We also acknowledged in the consultation paper that banks already undertake serviceability assessments and allow for the risk of rising interest rates. However, the Reserve Bank remains of the view that individual bank lending decisions may fail to take account of their impact on systemic risk during periods of intense competition for mortgage loans, and that there can be a role for limits on banks’ serviceability practices during these periods.
One of the most powerful tools to assess risk in a mortgage portfolio is dynamic loan to income ratios (LTI). Whilst Loan to Value (LVR) has traditionally been seen as a simple lead indicator of risk, in a rising priced market, risks are hidden, while in a falling market risks suddenly reappear. In any case LVR is about the equity buffer which protects the bank, not necessarily the household, and then only once default occurs.
Among advanced economies, loan to income ratios have started to take their place as the more accurate indicator of potential risk because they look at the household cash flow, and ongoing ability to service the loan. There has been reluctance in Australia to want to get to grips with LTI, but APRA’s recent comment suggests this may, and rightly change.
The point though is LTI at loan origination, just as LVR at origination, does not tell the full story. To be effective LTI should be dynamically adjusted, so as income changes, risk does too. This should then be back-ended into the banks’ risk and capital models.
The Digital Finance Analytics Core Market Model includes dynamic LTI. Currently we estimate that more than 20% of owner occupied mortgage loans on book have a dynamic LTI of more than 4 times income.
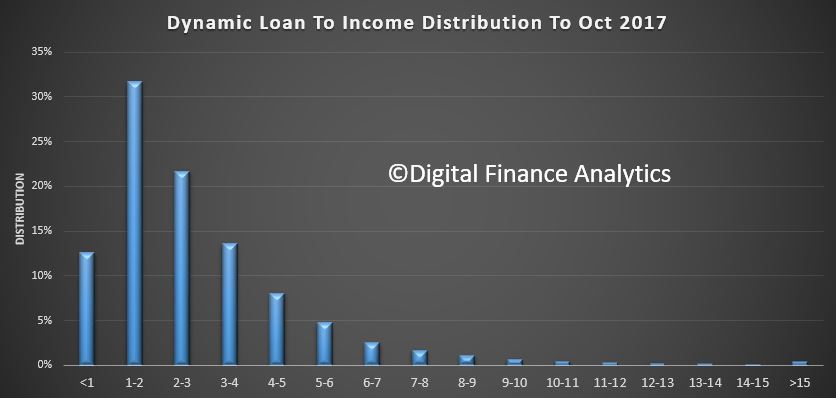 Some LTI’s are above 10 times income, though a relatively small number, they are at significantly higher risk.
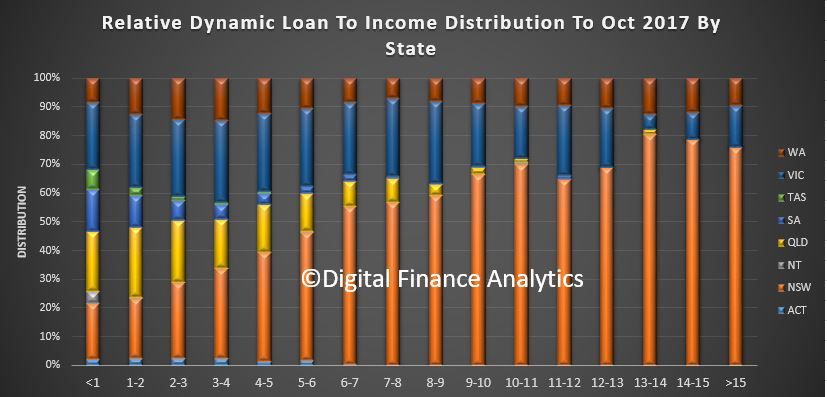
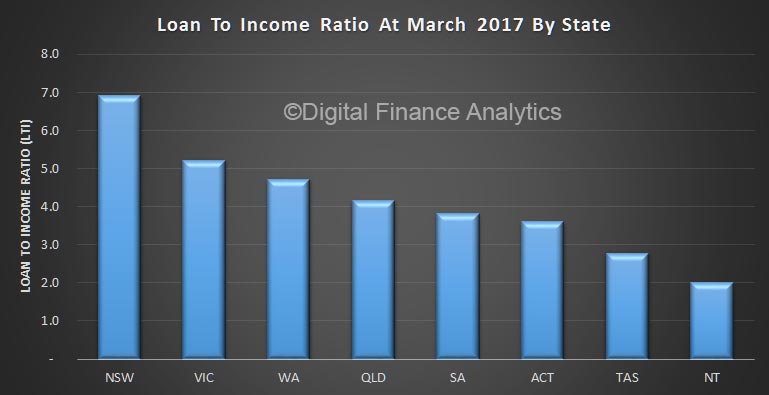
Looking at the data by state, we see that by far the highest count of high LTI loans resides in NSW (mainly in Greater Sydney), then VIC and WA.
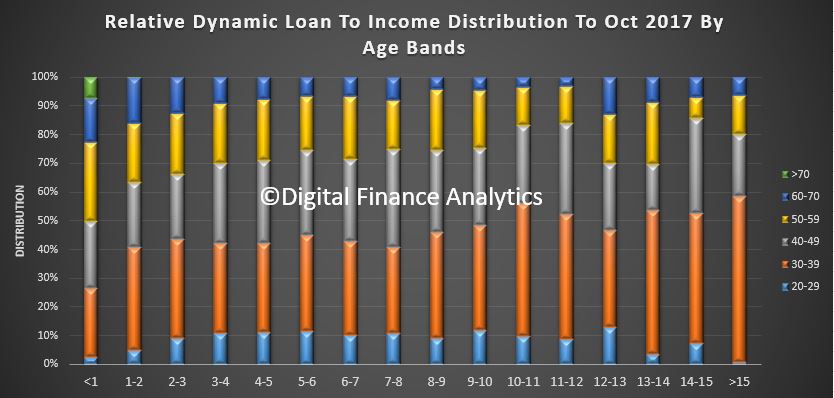
 Younger households have a relatively larger distribution of higher LTI loans.
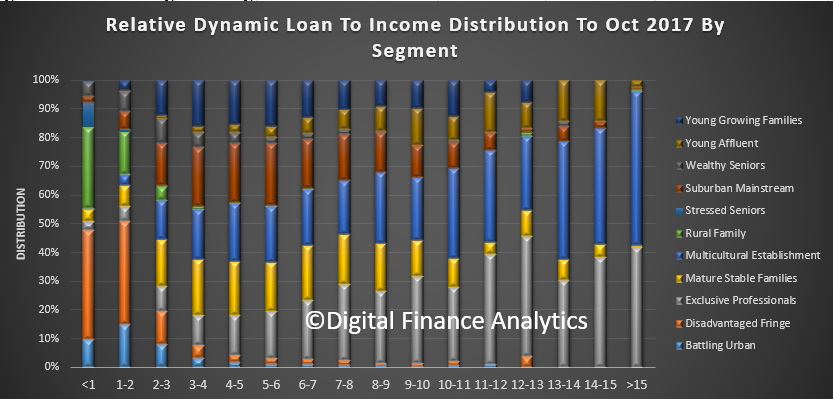
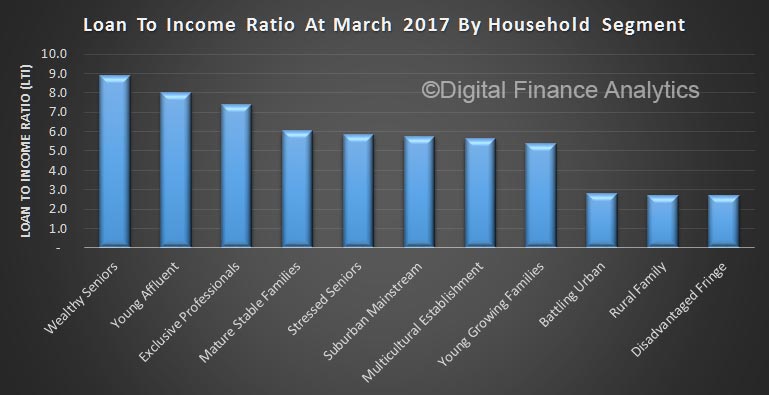
 Reading across our core segmentation, we see that Young Affluent, Exclusive Professionals and Multi Cultural Establishment are the three groups more likely to have a high dynamic LTI. We also see a number of Young Growing Families in the upper bands too.
 Many lenders also hold the transaction account for their mortgage borrowers, so it is perfectly feasible to build an algorithm which calculates estimated income dynamically from their transaction history, and use this to estimate a dynamic LTI. This would give greater insight into the real portfolio risks, compared with the blunt instrument of LVR. It is less misleading that LTI or LVR at origination.
Indeed, perhaps lenders should be running annual health checks on their mortgage portfolios, using LTI as the key discriminator. This is a leading indicator of down stream risks.
It also assists in assessing the true portfolio risks, because currently if households are in difficulty, it is in the banks’ interests to close out the loan quickly, to release equity to repay the loan and reduce the number of “bad loans” on book. One simple reason why losses are so low on a portfolio basis around 2 basis points, is that in a rising market, equity gains more than cover the loans. But that could change if home prices stall or reverse.
Dynamic LTI is a tool to assess risks earlier in the cycle.
We have been busy adding in new functionality to our Core Market Model, which is our proprietary tool, drawing data from our surveys and other public and private data sources to model and analyse household finances.
We measure mortgage stress on a cash flow basis – the October data will be out next week – and we also overlay economic data at a post code level to estimate the 30-day risk of default (PD30). But now we have added in 90-day default estimates (PD90) and the potential value which might be written off, measured in basis points against the mortgage portfolio. We also calibrated these measures against lender portfolios.
So today we walk though some of the findings, and once again demonstrate that granular analysis can provide a rich understanding of the real risks in the portfolio. Risks though are not where you may expect them!
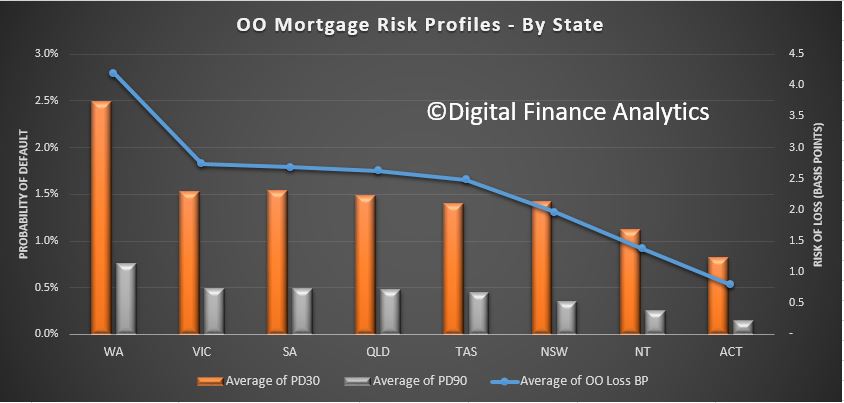
First we look risks by by state. This chart plots the PD30 and PD90 and the average loss in basis points. WA leads the way with the highest measurement, then followed by VIC, SA and QLD. The ACT is the least risky area.
So, looking at WA as an example, we estimate the 30-day probability of default in the next 12 months will be 2.5%, 90-day default will be 0.75% and the risk of loss is around 4 basis points. This is about twice the current national portfolio loss, which is sitting circa 2 basis points.
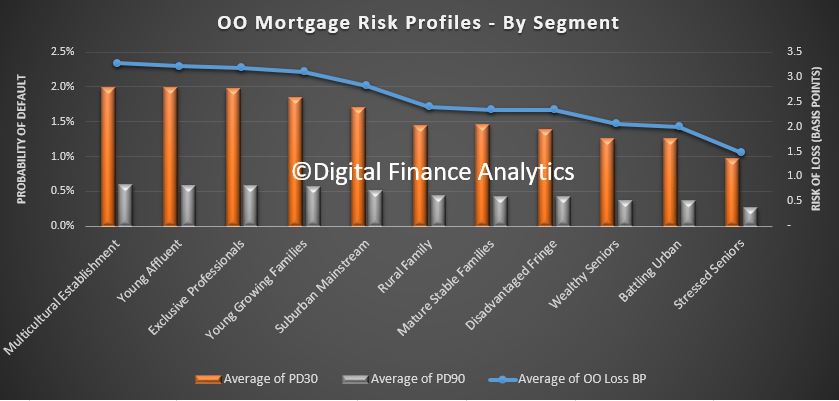
 Turning to our master household segmentation, we find that our Multicultural Establishment segment has the highest basis point risk of loss, at around 3 basis points, followed by Young Affluent, Exclusive Professionals and Young Growing Families. This immediately shows that risk and affluence are not totally connected. In fact our lower income groups, are some of the least risky. The PD30 and PD90 follows this trend too.
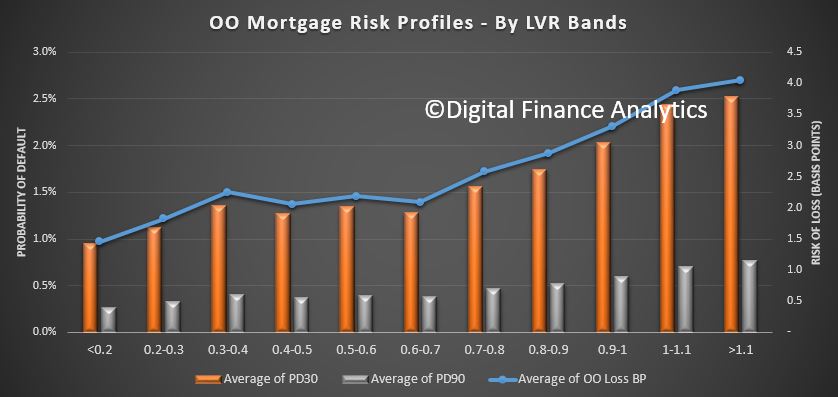
 The Loan to Value bands show some correlation to risk, although the slope of the curve is not that aggressive, indicating that LVR as a risk proxy is not that strong. This is because in a rising market, LVRs will rise automatically, irrespective of serviceability.
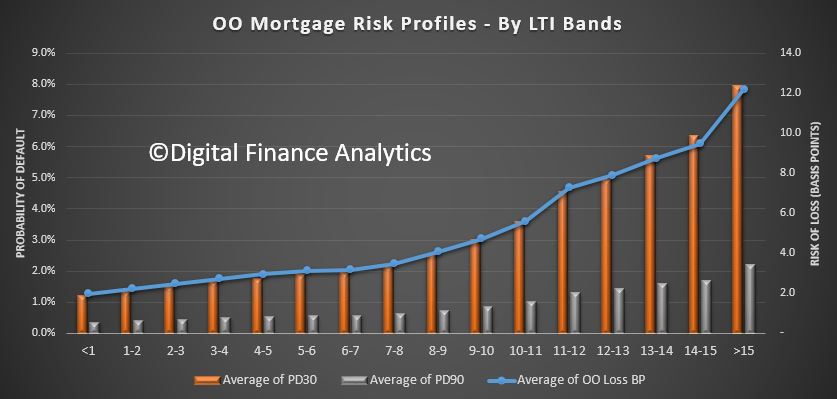
 A more sensitive measure of risk is Loan To Income (which APRA mentioned yesterday for the first time!). Here we see a significant rise in risk as LTI rises. Above 6 times income the risk starts to rise, moving from around 3 basis points, to 6 basis points at an LTI of 10, and 12 basis points at an LTI of 15+. So rightly LTI should be regarded as the leading risk indicator, yet many lenders are yet to incorporate this in their models. It is better because in the current flat income environment, income ratios are key.
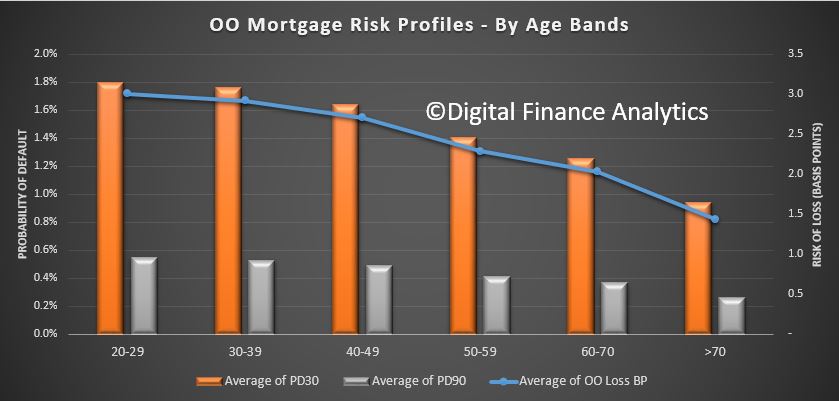
 Age is a risk indicator too, with households below 40 showing a higher risk of loss (3 basis points) compared with those over 50 (2.25). Even those into retirement will still represent some level of risk.
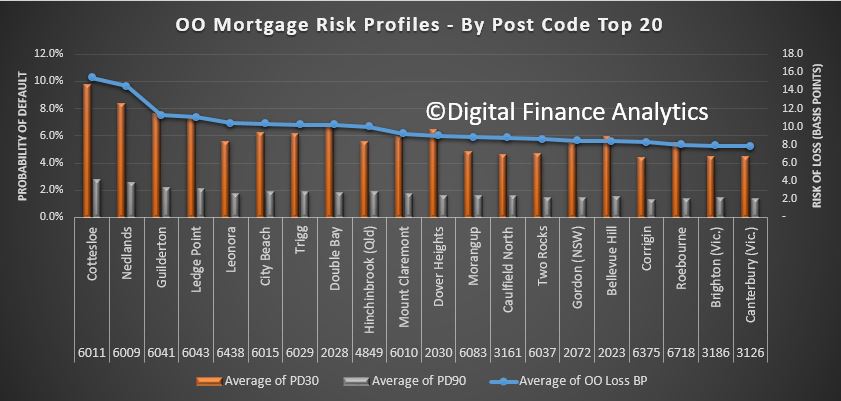
 Finally, and here it gets really interesting, we can drill down into post codes. We plotted the top 20 most risky post codes across the country from a basis points loss perspective. What we found is that in the top 20 there is a high representation of more affluent post codes, especially in WA, with Cottlesloe, Nedlands and City Beach all registering. We also find places like Double Bay and Dover Heights in Sydney, Hinchenbrook in QLD and Caulfield in VIC appearing. These are, on a more traditional risk view, not areas which would be considered higher risk, but when we take the size of the loans and cash flows into account, they currently carry a higher risk profile from an absolute loss perspective.
 So, we believe the time has come for more sophisticated, data driven analysis of mortgage risks. And risks are not where you might think they are!
We know that household debt has never been higher in Australia, but I do not think the true impact of this, especially in a rising interest, low income growth environment is truly understood. We have to look beyond mortgage debt.
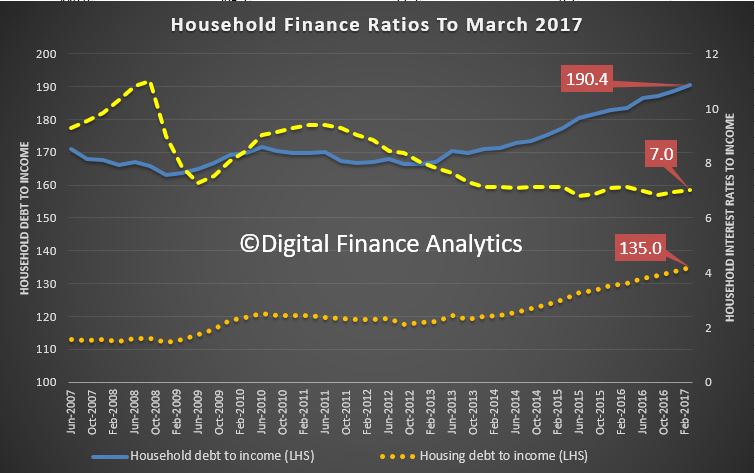
The latest RBA E2 – Households Finances – Selected Ratios shows that the ratio of household debt to annualised household disposable income , rose to 190.4, the ratio of housing debt to annualised household disposable income rose to 135, and worryingly the ratio of interest payments on housing debt to quarterly household disposable income has risen to 7.0, thanks to the out of cycle rate hikes and flat or falling incomes. Of course failing cash rates helped households out, but the lending standards were not adjusted until too late.
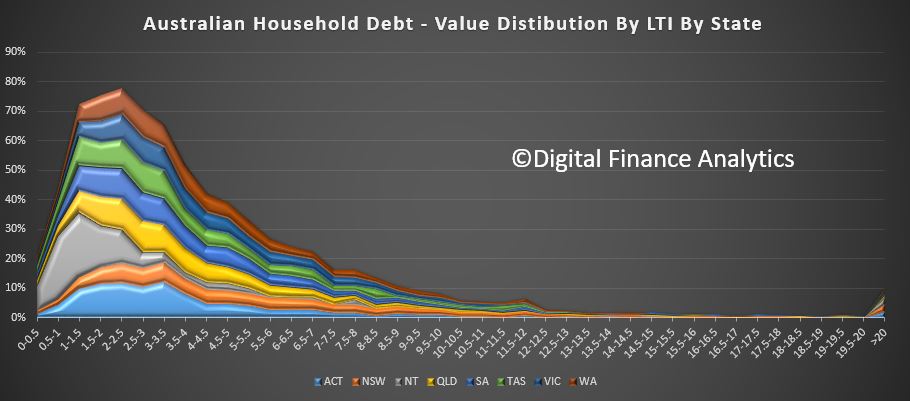
 But, here is the really scary picture of total debt value held mapped by debt to gross income ratio (DTI), aka Loan-to-Income (LTI). DTI or LTI is a good measure of potential risk in the system.

This first chart shows the distribution of debt value – of all types, including mortgagee, (owner occupied and investment), personal loans, credit cards, SACC borrowing, and all other loans – relative to gross income in debt-to-income bands. We are using date from our household surveys. It also shows the distribution of households, with more than half having low, or no debt, but with a long tail of highly indebted households.
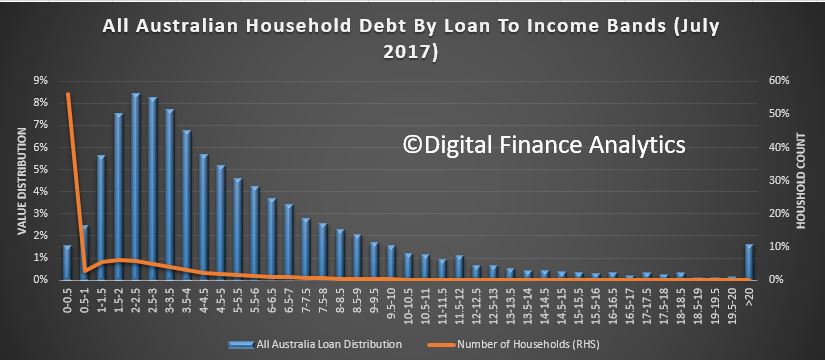 Across Australia, more than 45% of all household debt (not just households with mortgages, but those mortgage free or renting) sit with households who have an LTI of more than 4.5 times annual income. I used 4.5 times because this is the ratio the Bank of England uses, and they say that higher LTI’s are more risky.
The second chart shows the relative distribution across the states and territories.
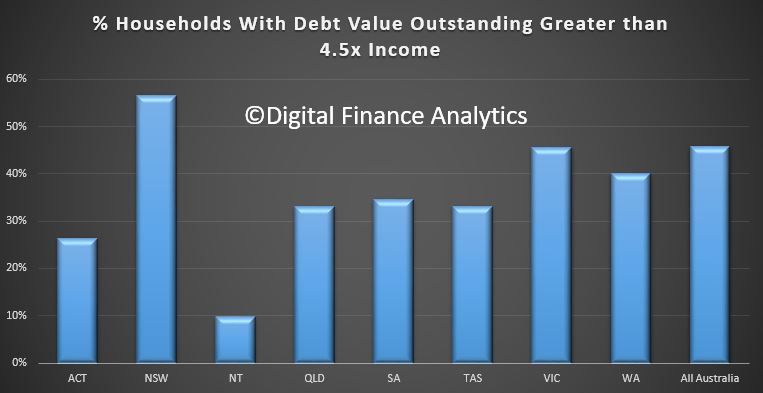
 The third chart shows the proportion of households in each state and territory with a DTI of more than 4.5 times. NSW holds the record, with more than half of all households above this, compared with 26% in ACT and 9% in NT.
 This is a big deal, especially in a rising interest rate environment. It means households have little wriggle room, and granted many will be holding paper profits in property which has risen significantly in recent years, this does not help with servicing ongoing debt repayments.
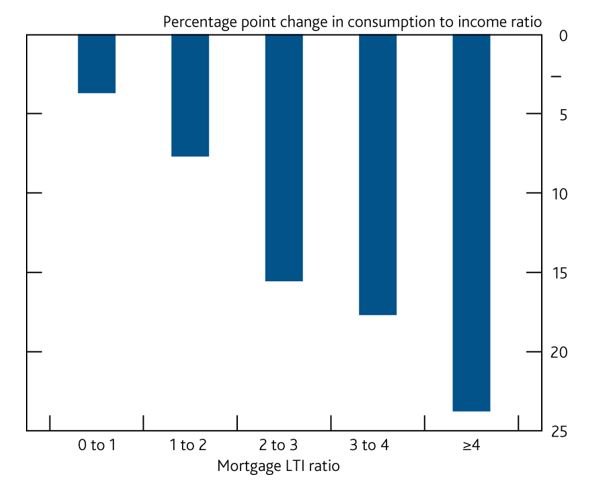
The effect of the debt burden is to reduce the ability of households to spend, and in effect it is a drag anchor on future economic growth.
The traditional argument that “most debt is held by those who can afford it” is partly true, but bigger debts require bigger incomes to service them, and the leveraged effect in a rising interest rate environment is profound.
NAB has said that they will “start automatically rejecting customers who want to borrow a high multiple of their income and only pay interest on their home loan, amid concerns over the growing risks created by rising household indebtedness.

From this Saturday, the bank will decline any customer applying for an interest-only loan who has a high loan-to-income ratio – an approach that banking sources said was not used by other lenders in the mortgage market”, according to the SMH.
While NAB already calculates loan-to-income ratios when assessing loans, it has not previously used the metric to determine whether a customer gets a loan, and such a blanket approach is understood to be unusual in the industry.
We have maintained for some time that LTI is an important measure. It should be use more widely in Australia, as it is a better indicator of risk than LVR (especially in a rising market).
The Bank of England released their June 2017 Financial Stability Report. They announced a number of measures which together tighten controls on the banks, in response to growing risks in the system from strong lending momentum. They confirmed the need to act, ahead of any impending crisis, by thinking about “tail risks” in the system.
They reintroduced a counter-cyclical capital buffer, which was removed after the Brexit vote.
They are concerned about systemic risks from high loan-to-income mortgage lending, and said lenders should use a 3% serviceability buffer from their standard variable rate and also confirmed the limit on lending with a LTI of 4.5 times will be an ongoing feature of the market.
Mortgage lending at high loan to income ratios is increasing and the spreads and fees on mortgage lending have fallen. If lenders were to weaken underwriting standards to maintain mortgage growth, the FPC’s measures would limit growth in the number of highly indebted households. This would have material benefits for economic and financial stability by mitigating the further cutbacks in spending that highly indebted households make in downturns.
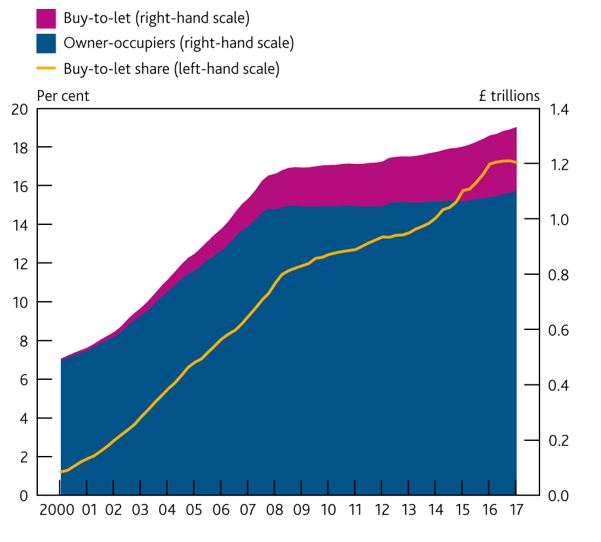
Here are a some of the interesting slides. The proportion of investor loans in the UK sits at around 17% of all loans, compared with 35% in Australia – yet the UK authorities are concerned at this level and have taken a number of steps to reduce momentum in this sector of the market.
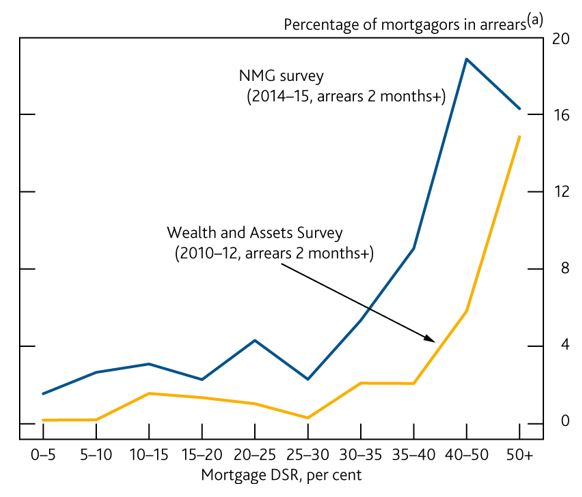
 Higher DSR households are much more likely to default, the UK are tracking this, yet in Australia there is no reporting on DSR by the regulators. We are relying on LVR, which is a poor measure of risk, as it depends on property values.
 Likewise, they also show that Loan to Income (LTI) is important in that higher LTI households have less disposable income, and in a crisis are more at risk; plus their inability to spend has a depressive impact on economic growth. Once again, they track this, and have policy on the limit of mortgages above 4.5 times. In Australia, there is no regular flow of information on LTI, no policy on this, and yet we face significant economic slow-down as highly leveraged households cut their spending.
 You can watch the presentation.
The Financial Policy Committee (FPC) aims to ensure the UK financial system is resilient to the wide range of risks it faces.
The FPC assesses the overall risks from the domestic environment to be at a standard level: most financial stability indicators are neither particularly elevated nor subdued.
As is often the case in a standard environment, there are pockets of risk that warrant vigilance. Consumer credit has increased rapidly. Lending conditions in the mortgage market are becoming easier. Lenders may be placing undue weight on the recent performance of loans in benign conditions.
Exit negotiations between the United Kingdom and the European Union have begun. There are a range of possible outcomes for, and paths to, the United Kingdom’s withdrawal from the EU.
Some possible global risks have not crystallised, though financial vulnerabilities in China remain pronounced.
Measures of market volatility and the valuation of some assets — such as corporate bonds and UK commercial real estate — do not appear to reflect fully the downside risks that are implied by very low long-term interest rates.
To ensure that the financial system has the resilience it needs, the FPC is:
- Increasing the UK countercyclical capital buffer rate to 0.5%, from 0%. Absent a material change in the outlook, and consistent with its stated policy for a standard risk environment and of moving gradually, the FPC expects to increase the rate to 1% at its November meeting.
- Bringing forward the assessment of stressed losses on consumer credit lending in the Bank’s 2017 annual stress test. This will inform the FPC’s assessment at its next meeting of any additional resilience required in aggregate against this lending. The FPC further supports the intentions of the Prudential Regulation Authority and Financial Conduct Authority to publish, in July, their expectations of lenders in the consumer credit market.
- Clarifying its existing insurance measures in the mortgage market, designed to prevent excessive growth in the number of highly indebted households. This will promote consistency across lenders in their application of tests to assess whether new mortgage borrowers can afford repayments.
- Consistent with its previous commitment, restoring the level of resilience delivered by its leverage ratio standard to the level it delivered in July 2016 before the FPC excluded central bank reserves from the leverage ratioexposure measure. The FPC intends to set the minimum leverage requirement at 3.25% of non-reserve exposures, subject to consultation.
- Overseeing contingency planning to mitigate risks to financial stability as the United Kingdom withdraws from the European Union.
- Building on the programme of cyber resilience testing it instigated in 2013, by setting out the essential elements of the regulatory framework for maintaining cyber resilience. It will now monitor that each element is being fulfilled by the relevant UK authorities.
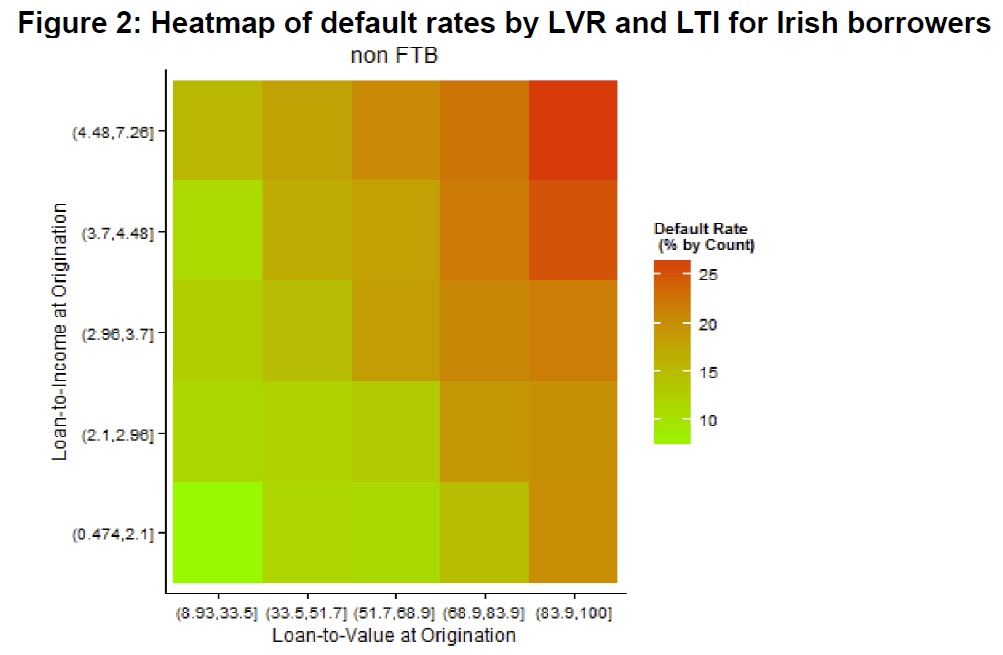
The NZ Reserve Bank has released its consultation paper on possible DTI restrictions. The 36+ page report is worth reading as it sets out the risks ensuring from high risk lending, leveraging experience from countries such as Ireland.
 Interestingly they build a cost benefit analysis, trading off a reduction in the costs of a housing and financial crisis with a reduction in the near-term level of economic activity as a result of the DTI initiative and the cost to some potential homebuyers of having to delay their house purchase.
Submissions on this Consultation Paper are due by 18 August 2017.
In 2013, the Reserve Bank introduced macroprudential policy measures in the form of loan to-value ratio (LVR) restrictions to mitigate the risks to financial system stability posed by a growing proportion of residential mortgage loans with high LVRs (i.e. low deposit or low equity loans). This increase in borrower leverage had gone hand-in-hand with significant increases in house prices, particularly in Auckland. The Reserve Bank’s concern was the possibility of a sharp fall in house prices, in adverse economic circumstances where some borrowers had trouble servicing loans. Such an event had the potential to undermine bank asset quality given the limited equity held by some borrowers.
The Reserve Bank believes LVR restrictions have been effective in reducing the risk to financial system stability that can arise due to a build-up of highly-leveraged housing loans on bank balance sheets. However, LVRs relate mainly to one dimension of housing loan risk. The other key component of risk relates to the borrower’s capacity to service a loan, one measure of which is the debt-to-income ratio (DTI). All else equal, high DTI ratios increase the probability of loan defaults in the event of a sharp rise in interest rates or a negative shock to borrowers’ incomes. As a rule, borrowers with high DTIs will have less ability to deal with these events than those who borrow at more moderate DTIs. Even if they avoid default, their actions (e.g. selling properties because they are having difficulty servicing their mortgage) can increase the risk and potential severity of a housing related economic crisis.
While the full macroprudential framework will be reviewed in 2018, the Reserve Bank has elected to consult the public prior to the review. This consultation concerns the potential value of a policy instrument that could be used to limit the extent to which banks are able to provide loans to borrowers that are a high multiple of the borrower’s income (a DTI limit). A number of other countries have introduced DTI limits in recent years, often in association with LVR restrictions. In 2013, the Bank and the Minister of Finance agreed that direct, cyclical controls of this sort would not be imposed without the tool being listed in the Memorandum of Understanding on Macroprudential Policy (the MoU). Hence, cyclical DTI limits will only be possible in the future if an amended MoU is agreed.
The purpose of this consultation is for the Reserve Bank, Treasury and the Minister of Finance to gather feedback from the public on the prospect of including DTI limits in the Reserve Bank’s macroprudential toolkit.
Throughout the remainder of the document we have listed a number of questions, but feedback can cover other relevant issues. Information provided will be used by the Reserve Bank and Treasury in discussing the potential amendment of the MoU with the Minister of Finance. We present evidence that a DTI limit would reduce credit growth during the upswing and reduce the risk of a significant rise in mortgage defaults during a subsequent severe economic downturn. A DTI limit could also reduce the severity of the decline in house prices and economic growth in that severe downturn (since fewer households would be forced to sharply constrain their consumption or sell their house, even if they avoided actual default). The strongest evidence that these channels could materially worsen an economic downturn tends to come from countries that have experienced a housing crisis in recent history (including the UK and Ireland). The Reserve Bank believes that the use of DTI limits in appropriate circumstances would contribute to financial system resilience in several ways:
– By reducing household financial distress in adverse economic circumstances, including those involving a sharp fall in house prices;
– by reducing the magnitude of the economic downturn, which would otherwise serve to weaken bank loan portfolios (including in sectors broader than just housing); and
– by helping to constrain the credit-asset price cycle in a manner that most other macroprudential tools would not, thereby assisting in alleviating the build-up in risk accompanying such cycles.The policy would not eliminate the need for lenders and borrowers to undertake their own due diligence in determining that the scale and terms of a mortgage are suitable for a particular borrower. The focus would be systemic: on reducing the risk of the overall mortgage and housing markets becoming dysfunctional in a severe downturn, rather than attempting to protect individual borrowers. The consultation paper notes that DTIs on loans to New Zealand borrowers have risen sharply over the past 30 or so years, with further increases evident since 2014. This partly
reflects the downward trend in interest rates over the period. However, interest rates may rise in the future. While the Reserve Bank is continuing to work with banks to improve this data, the available data also show that average DTIs in New Zealand are quite high on an international basis, as are New Zealand house prices relative to incomes.Other policies (such as boosting required capital buffers for banks, or tightening LVR restrictions further) could be used to target the risks created by high-DTI lending. The Bank does not rule out these alternative policies (indeed, we are currently undertaking a broader review of capital requirements in New Zealand) but consider that they would not target our concerns around mortgage lending as directly or effectively. For example, while higher capital buffers would provide banks with more capacity to withstand elevated housing loan defaults, they would do little to mitigate the feedback effects between falling house prices, forced sales and economic stress.
The Reserve Bank has stated that it would not employ a DTI limit today if the tool was already in the MoU (especially given recent evidence of a cooling in the housing market and borrower activity), it believes a DTI instrument could be the best tool to employ if house prices prove resurgent and if the resurgence is accompanied by further substantial volumes of high DTI lending by the banking system. The Reserve Bank considers that the current global environment, with low interest rates expected in many countries over the next few years, tends to exacerbate the risk of asset price cycles arising from ‘search for yield’ behaviour, making the potential value of a DTI tool greater.
The exact nature of any limit applied would depend on the circumstances and further policy development. However, the Reserve Bank’s current thinking is that the policy would take a similar form to LVR restrictions. This would involve the use of a “speed limit”, under which banks would still be permitted to undertake a proportion of loans at DTIs above the chosen threshold. By adopting a speed limit approach, rather than imposing strict limits on DTI ratios, there would be less risk of moral hazard issues arising from a particular ratio being seen as “officially safe”. Exemptions similar to those available within the LVR restriction policy would also be likely to apply.
We have updated our core market model with household survey data this week. One interesting dynamic is the LTI metrics across the portfolio. We calculate the dynamic LTI, based on current income and loan outstanding. This is not the same a Debt Servicing Ratio (DSR), and is less impacted by changes in mortgage rates. It is also a better measure of risk than Loan To Value (LVR)
LTI has started to become an important measure of how stretched households are. For example the Bank of England issued a recommendation to the PRA and the Financial Conduct Authority (FCA) advising that they should ‘ensure that mortgage lenders do not extend more than 15% of their total number of new residential mortgages at loan to income ratios at or greater than 4.5’.
In response, UK banks trimmed their offers. For example,
NatWest is lowering its loan-to-income ratio for some borrowers, which means they won’t be able to borrow as much to buy a home.
House buyers who stump up a deposit between 15 and 25 per cent will only be able to borrow up to 4.45 times their annual income, down from the previous maximum of 4.75 per cent.
The new multiple will apply to both single and joint earners.
The move suggests a rising number of borrowers are having to stretch themselves to be able to afford to buy a home as prices continue to rise.
Turning to Australia, we start with a state by state comparison. The AVERAGE loan in NSW is sitting at close to 7, ahead of Victoria at over 5, and the others lower. This highlights the stress within the system for property purchasers in Sydney, with affordability a major barrier.
 Across our household segments however, the three most exposed segments are the most affluent. Wealthy Seniors sits about 9, followed by Young Affluent at 8 and Exclusive Professionals at 7.5. On the other hand, Young Growing Families are at around 5.5 (still above the Bank of England threshold).
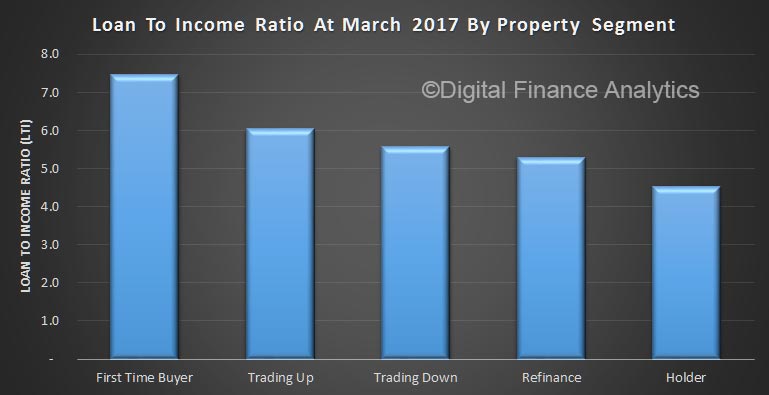
 Looking at type of buyer, First Time Buyers are sitting at 7.5%, with those trading up at 6%. Holders are sitting at 4.5%
 Finally, here is an average by age bands, and plotted against relative volumes of mortgages. Pressure is highest in the 60+ age groups, this is because incomes tend to fall as households move towards part-time or retirement, but these days more will still have a mortgage to manage.
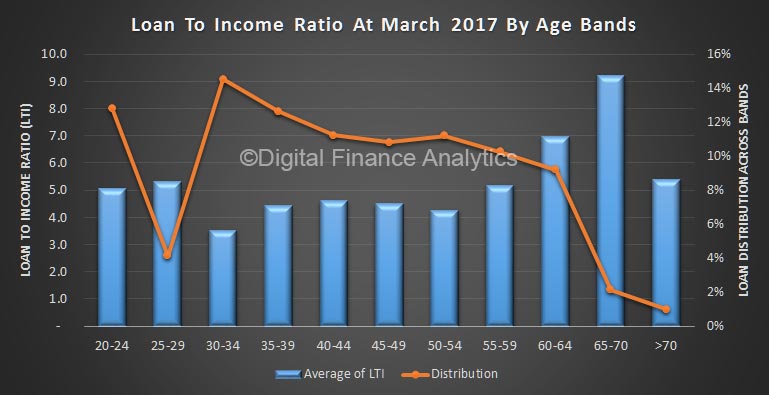 The dip in volumes in the 25-29 group is explained by many in this band choosing education, or starting a family, rather than home purchase, and the peak volume for purchase in after 30.
Overall LTI is a good indicator of affordability pressure, and the regulators could [should?] impose an LTI cap to slow lending growth, counter building affordability risks and rising housing debt.