ASIC Imposes Additional Licence Conditions on IOOF

ASIC has imposed additional licence conditions on the Australian financial services (AFS) licence of IOOF Investment Services Ltd (IISL) as part of an application by IISL to vary its licence.

IISL sought a variation to its licence to facilitate the transfer of managed investment scheme, investor directed portfolio services (IDPS) and advice activities from IOOF Investment Management Ltd (IIML) to IISL. The transfer is part of a reorganisation of the broader corporate group (IOOF Group).

In granting the licence variation, ASIC has decided to impose additional conditions relating to the governance, structure and compliance arrangements of IISL.

ASIC’s decision to impose additional licence conditions took into account concerns highlighted by the Financial Services Royal Commission about the real and continuing possibility of conflicts of interests in IOOF Group’s business structure, ASIC’s past supervisory experience of these entities and material supplied by IISL as part of its licence variation application. IISL agreed to the imposition of the additional licence conditions.

In summary, the additional conditions specifically cover:

  • governance – by requiring that IISL has a majority of independent directors with a breadth of skills and background relevant to the operation of managed investment schemes and IDPS platforms;
  • the establishment of an Office of the Responsible Entity (ORE) – that is adequately resourced and reports directly to the IISL board, with responsibility for:
    • oversight of IISL’s compliance with its AFS licence obligations;
    • ensuring IISL’s managed investment schemes are operated in the best interests of their members; and
    • overseeing the quality and pricing of services provided to IISL by all service providers (including related companies),
  • the appointment of an independent expert, approved by ASIC, to report on their assessment of the implementation of the additional licence conditions.

ASIC Commissioner Danielle Press said, ‘ASIC is serious about improving the quality of governance and conflicts management across the funds management sector and ensuring that investors’ best interests are the highest priority of fund managers.

‘ASIC will use its licensing power, including through the imposition of tailored licence conditions to address governance weaknesses, the risk of poor conduct or vulnerabilities to conflicts of interest in a licensee’s business model.’

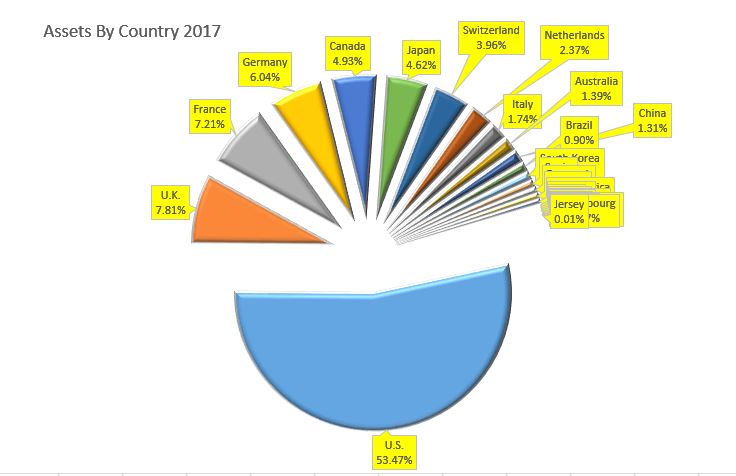
Top 20 Fund Managers By Country

Following this mornings data on the top 500 Fund Managers, which has passed US$80 trillion under management in 2016 (contained in the 2017 report) and which helps to explain the inflated asset prices of property and the stock market; it is worth looking at the country break down by percentage of funds under management, all stated in US$.

More than half of assets are held by managers in the USA, followed in descending order by UK, France, Germany, Canada and Japan. Australia has 1.39% of assets, but that may be overstated as this includes Macquarie who has more business off shore than on shore.

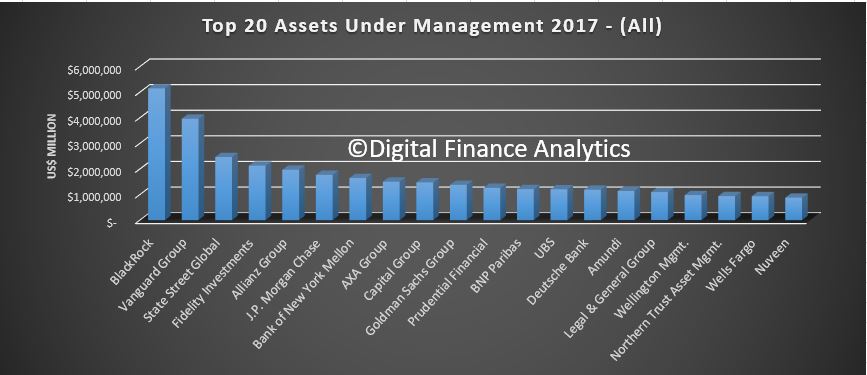
Here are the top 20 globally, by manager. Black Rock is by far the largest.

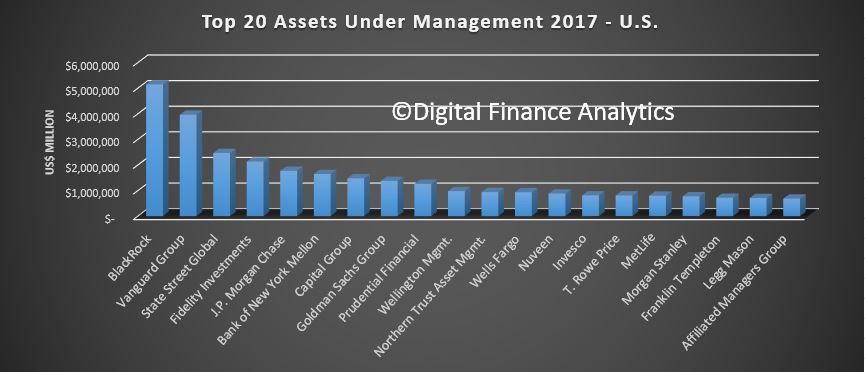
Here are the top 20 from the USA.

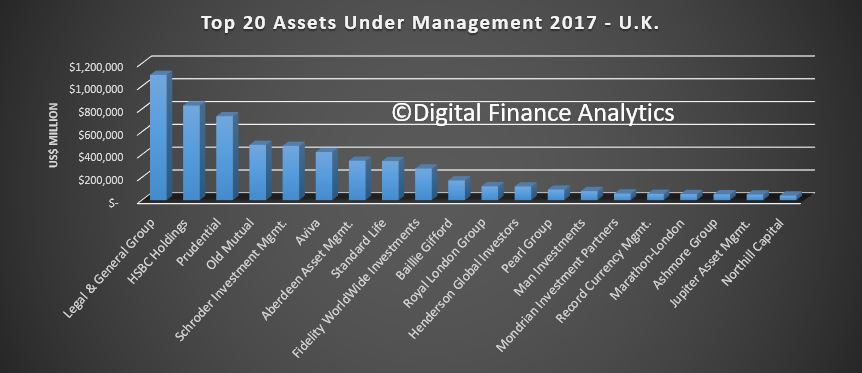
Here are the top 20 from the UK.

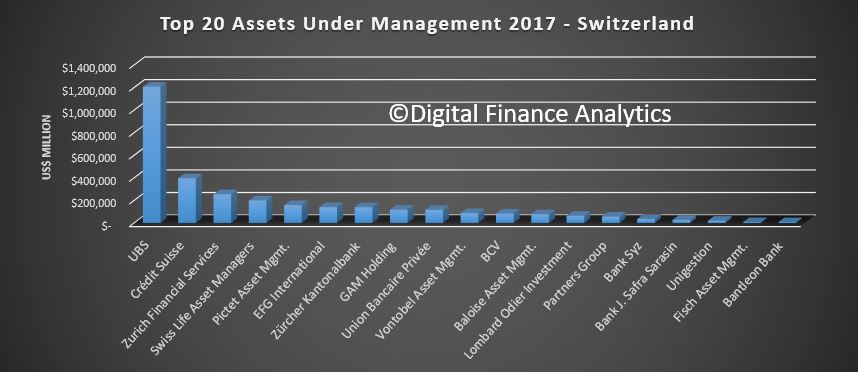
Switzerland is dominated by funds managed by UBS.

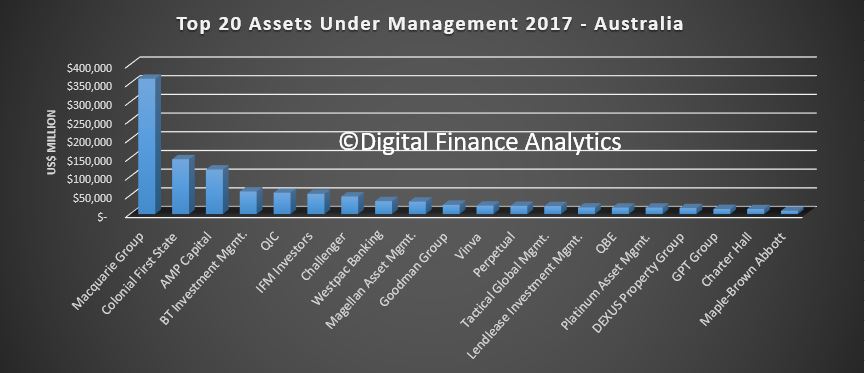
Here are the Australian top 20.

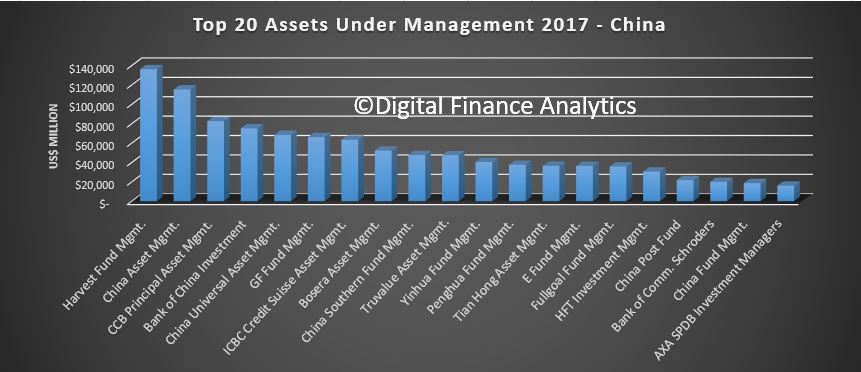
Finally, here is the China footprint – given the wealth accumulation there, I have little doubt they will be overtaking Australia, and moving well up the rankings in the years ahead.


Assets of world’s largest fund managers passes US$80 trillion for the first time

Total assets under management (AuM) of the world’s largest 500 managers grew to US$ 81.2 trillion in 2016, representing a rise of 5.8% on the previous year, according to latest figures from Willis Towers Watson’s Global 500 research.

Looking at the Australian players in the global list, Macquarie Group was in 52nd place with assets of US$362,511m, Colonial State was at 102 with US$147,154m, AMP Capital was at 120 with US$119,476m, BT Investment at 182 with US$60,699 and QIC at 193 with US$57,455m.

The research, which takes into account data up to the end of 2016, found that AuM for North American managers increased by 7.7% over the period and now stand at US$ 47.4 trillion, whilst assets managed by European managers, including the UK, increased by 2.8% to US$ 25.8 trillion. However, UK-based firms saw AuM decline for the second consecutive year, falling by 4.5% in 2016 to US$ 6.3 trillion.

Although the majority of total assets1 (78.4%) are still managed actively, its share has declined from 79.7% from end of last year as passive management continues to make inroads.

Luba Nikulina, global head of manager research at Willis Towers Watson, said: “It is encouraging to see a return to growth in total global assets, suggesting that managers are finding success in attracting investors towards innovative solutions to achieve superior risk-adjusted returns. Whilst passive assets remain significantly smaller than actively managed assets, the proportion of passively managed assets has grown from 16.5% to 21.6% over the last five years alone. We expect that this trend will continue to put downward pressure on traditional fee structures, particularly amongst active managers seeking to remain competitive and to maximise value to investors.”

The 20 largest asset managers experienced a 6.7% increase in AuM, which now stands at US$ 34.3 trillion, compared to US$ 26.0 trillion ten years ago and US$ 20.5 trillion in 2008. The share of total assets managed by this group of 20 largest managers increased for the third year in a row, rising from 41.9% in 2015 to 42.3% by the end of 2016. Despite this, the bottom 250 managers experienced a superior growth rate in assets managed, rising by 7.3% over the year.

As with previous years, equity and fixed income assets have continued to dominate, with a 78.7% share of total assets1 (44.3% equity, 34.4% fixed income), experiencing an increase of 3% combined during 2016. Continuing from the strong growth they experienced in 2015, assets1 in alternatives saw a 5.1% increase by the end of 2016, closely followed by equities at 4.1%.

Luba Nikulina said: “Alternatives continue to grow in popularity, with investors remaining under pressure to find effective means of diversification in an environment of lower expected returns from traditional asset classes. These strategies often come with greater complexity and require superior risk management. We see this as linked to the growth in assets managed by managers in the bottom half of our list, suggesting that investors favour smaller investment houses with specialist investment skills.”

“Our research has also highlighted awareness in sustainable investing, with 78% of the firms surveyed acknowledging a growing interest from their clients for these sorts of strategies as they continue to look for ways to add value for clients,” said Luba Nikulina.

Whilst BlackRock retains its position at the top of the manager rankings for the eighth consecutive year, further insight shows the main gainers, by rank, in the top 50 during the past five years include, Dimensional Fund Advisors (+31 [76 to 45]), Affiliated Managers Group (+20 [52 to 32]), Nuveen (+16 [36 to 20]), New York Life Investments (+15 [55 to 40]) and Schroder Investment Management, (+15 [59 to 44]).

The world’s largest money managers

Ranked by total assets under management, in U.S. millions, as of Dec. 31, 2016

Rank Manager Country Total assets
1 BlackRock U.S. $5,147,852
2 Vanguard Group U.S. $3,965,018
3 State Street Global U.S. $2,468,456
4 Fidelity Investments U.S. $2,130,798
5 Allianz Group Germany $1,971,211
6 J.P. Morgan Chase U.S. $1,770,867
7 Bank of New York Mellon U.S. $1,647,990
8 AXA Group France $1,505,537
9 Capital Group U.S. $1,478,523
10 Goldman Sachs Group U.S. $1,379,000
11 Prudential Financial U.S. $1,263,765
12 BNP Paribas France $1,215,482
13 UBS Switzerland $1,208,275
14 Deutsche Bank Germany $1,190,523
15 Amundi France $1,141,000
16 Legal & General Group U.K. $1,099,919
17 Wellington Mgmt. U.S. $979,210
18 Northern Trust Asset Mgmt. U.S. $942,452
19 Wells Fargo U.S. $936,900
20 Nuveen U.S. $881,748

Source: P&I/Willis Towers Watson World 500

Managed Funds Climb Higher, Again, To $2.8 Trillion

The ABS released their quarterly managed funds data to December 2016, which shows a significant hike in market value, to $2.8 trillion. The asset bubble continues.

At 31 December 2016, the managed funds industry had $2,841.8b funds under management, an increase of $61.4b (2%) on the September quarter 2016 figure of $2,780.4b.

The main valuation effects that occurred during the December quarter 2016 were as follows: the S&P/ASX 200 increased 4.2%; the price of foreign shares, as represented by the MSCI World Index excluding Australia, increased 1.5%; and the A$ depreciated 5.2% against the US$.

Superannuation funds held the largest share of assets.

At 31 December 2016, the consolidated assets of managed funds institutions were $2,237.9b, an increase of $49.2b (2%) on the September quarter 2016 figure of $2,188.7b.

The asset types that increased were shares, $22.9b (3%); overseas assets, $19.4b (4%); land, buildings and equipment, $1.9b (1%); units in trusts, $1.9b (1%); short term securities, $1.8b (1%); deposits, $1.6b (1%); bonds, etc., $1.3b (1%) and other non-financial assets, $0.7b (6%). These were partially offset by decreases in other financial assets, $2.0b (6%) and loans and placements, $0.4b (1%). Derivatives were flat.

At 31 December 2016, there were $498.3b of assets cross invested between managed funds institutions.

At 31 December 2016, the unconsolidated assets of superannuation (pension) funds increased $54.3b (3%), life insurance corporations increased $2.4b (1%), public offer (retail) unit trusts increased $0.3b (0%) and common funds increased $0.2b (2%). Cash management trusts decreased $0.6b (2%). Friendly societies were flat.


Managed Funds Industry Now Worth $2.8 Trillion

The ABS released the latest Managed Funds data to September 2016. The managed funds industry had $2,774.5b funds under management, an increase of $59.0b (2%) on the June quarter 2016 figure of $2,715.5b.

The main valuation effects that occurred during the September quarter 2016 were as follows: the S&P/ASX 200 increased 3.9%; the price of foreign shares, as represented by the MSCI World Index excluding Australia, increased 4.3%; and the A$ appreciated 2.7% against the US$.

At 30 September 2016, the consolidated assets of managed funds institutions were $2,182.8b, an increase of $45.3b (2%) on the June quarter 2016 figure of $2,137.5b.

assets-mf-sep-16

The asset types that increased were shares, $46.2b (8%); overseas assets, $41.2b (10%); bonds, etc., $10.5b (9%); deposits, $8.8b (3%); short term securities, $6.5b (6%); land, buildings and equipment, $3.0b (1%) and loans and placements, $0.8b (2%). These were partially offset by decreases in units in trusts, $65.2b (29%); other financial assets, $5.9b (14%); other non-financial assets, $0.4b (4%) and derivatives, $0.3b (7%).

At 30 September 2016, there were $490.0b of assets cross invested between managed funds institutions.

At 30 September 2016, the unconsolidated assets of superannuation (pension) funds increased $56.3b (3%), cash management trusts increased $1.5b (4%), public offer (retail) unit trusts increased $1.2b (0%), friendly societies increased $0.3b (4%) and common funds increased $0.2b (2%). Life insurance corporations decreased $69.7b (24%).


Value of Managed Funds Fell in June 2015 Quarter

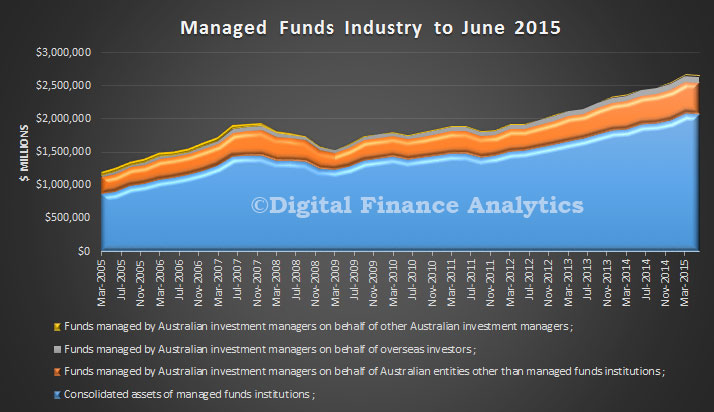
The ABS released their data on the managed funds industry. It shows the impact of recent falls in stocks, and exchange rate movements. At 30 June 2015, the managed funds industry had $2,622.2b funds under management, a decrease of $21.2b (1%) on the March quarter 2015 figure of $2,643.4b. The main valuation effects that occurred during the June quarter 2015 were as follows: the S&P/ASX 200 decreased 7.3%; the price of foreign shares, as represented by the MSCI World Index excluding Australia, decreased 0.1%; and the A$ appreciated 0.6% against the US$.

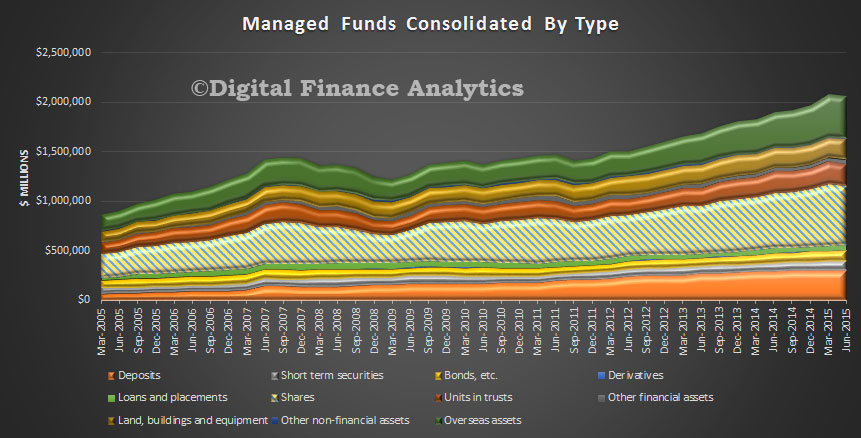
Managed-Funds-June-2015 At 30 June 2015, the consolidated assets of managed funds institutions were $2,059.9b, a decrease of $18.6b (1%) on the March quarter 2015 figure of $2,078.6b. The asset types that decreased were shares, $29.6b (5%); units in trusts, $4.0b (2%); overseas assets, $2.7b (1%); derivatives, $0.3b (10%) and other non-financial assets, $0.3b (2%). These were partially offset by increases in other financial assets, $7.2b (24%); land, buildings and equipment, $4.1b (2%); short term securities, $2.6b (3%); loans and placements, $2.4b (5%); deposits, $1.3b (0%) and bonds, etc., $0.6b (1%).

Managed-Funds-By-Type-June-2015At 30 June 2015, there were $534.3b of assets cross invested between managed funds institutions. At 30 June 2015, the unconsolidated assets of Superannuation (pension) funds decreased $25.8b (1%), life insurance corporations decreased $6.5b (2%); friendly societies decreased $0.1b (2%) and common funds decreased $0.1b (1%). Cash management trusts increased $1.4b (4%) and public offer (retail) unit trusts increased $1.0b (0%).