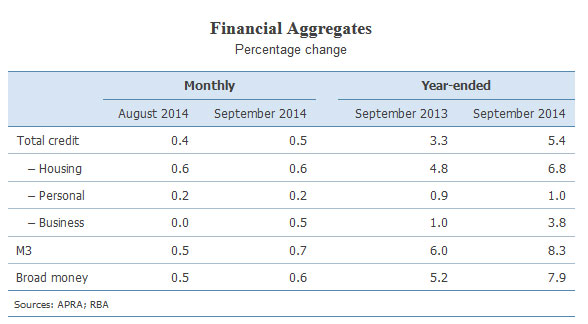
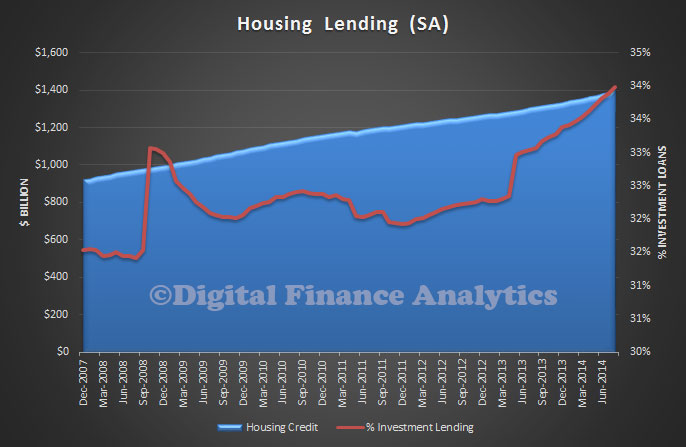
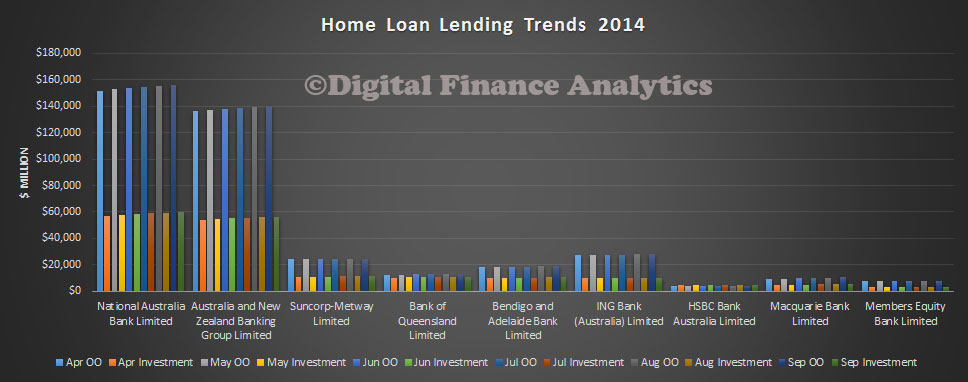
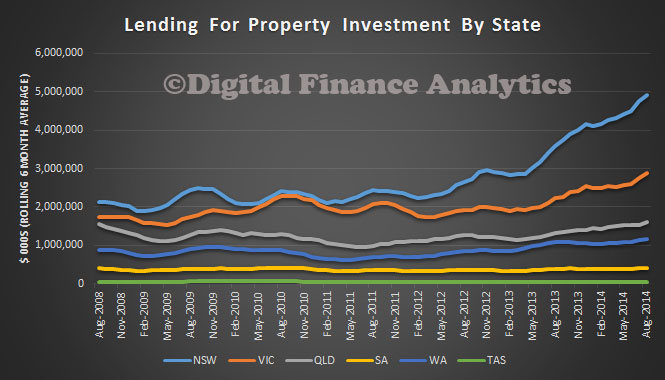
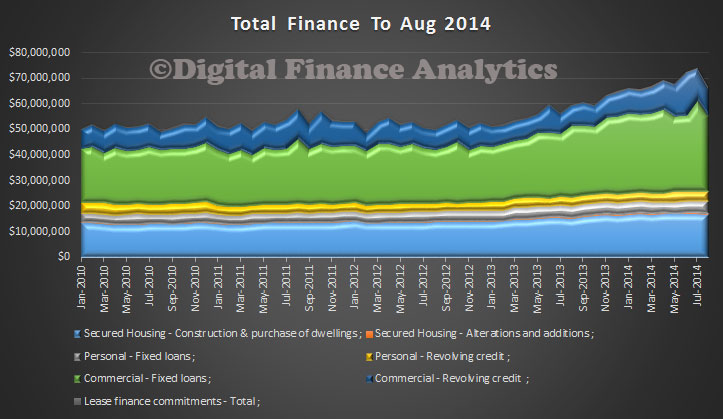
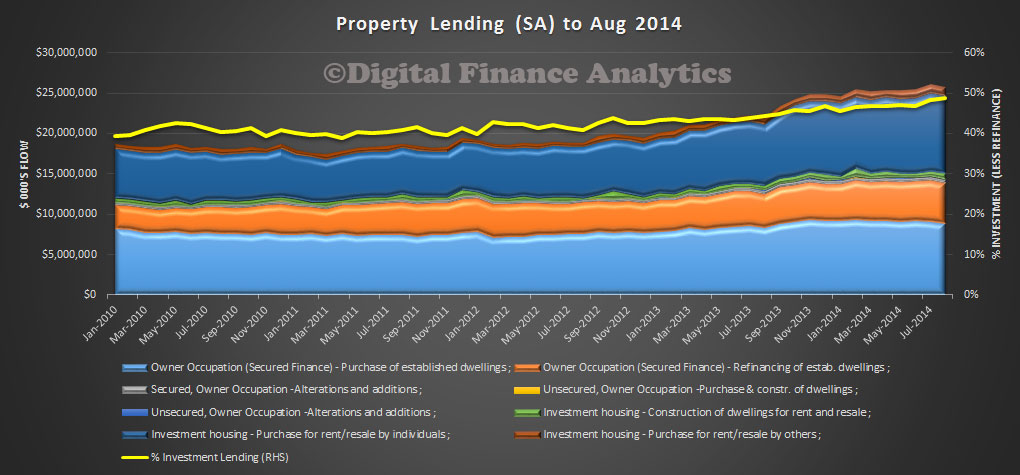
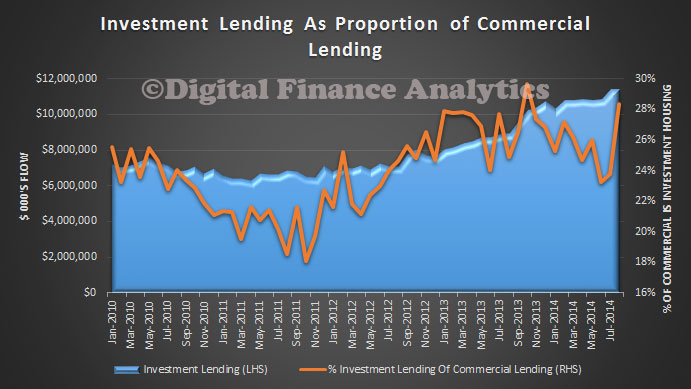
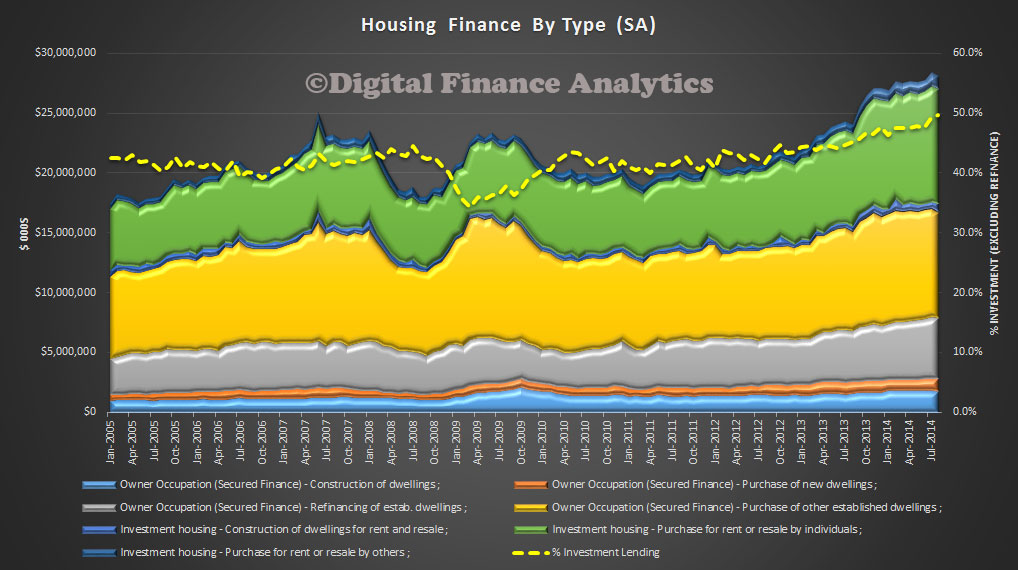
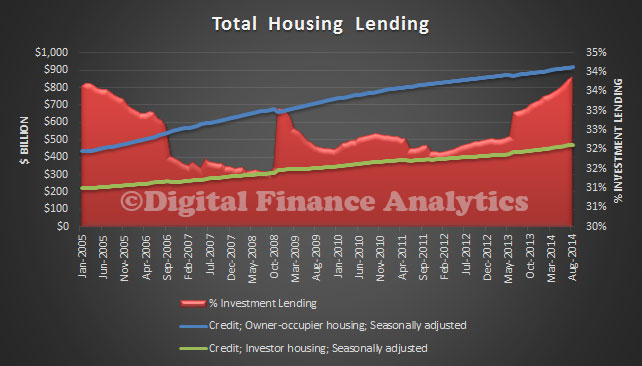
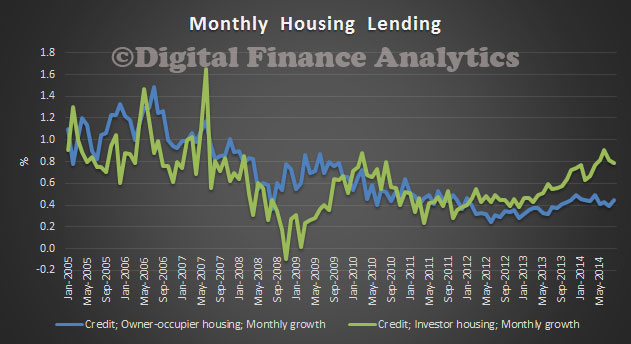
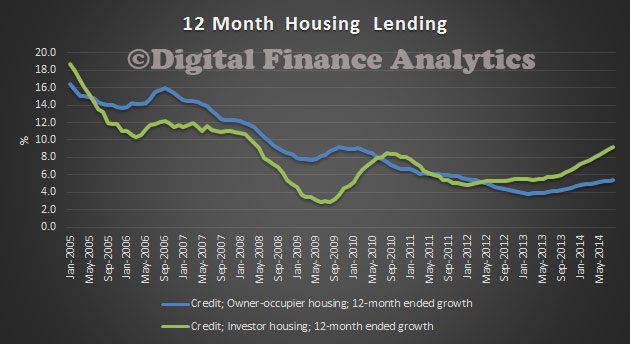
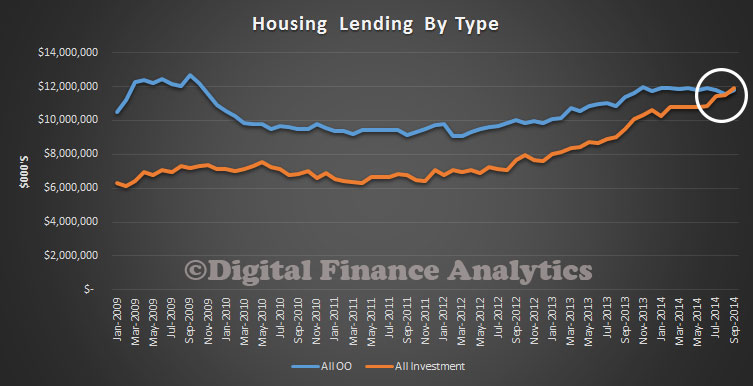
APRA published their monthly banking statistics for August 2014 today. The trend remains set, with investment lending running ahead of owner occupied lending. Further evidence that the RBA should react to the hot market. Total lending was up by $7.4 billion to a total of $1.28 trillion. Owner Occupied loans grew at 0.48% from last month, whilst investment loans grew at 0.78%. 65.4% of loans were for owner occupation, the rest investment. This data excludes the non-bank sector, which will be reported separately.
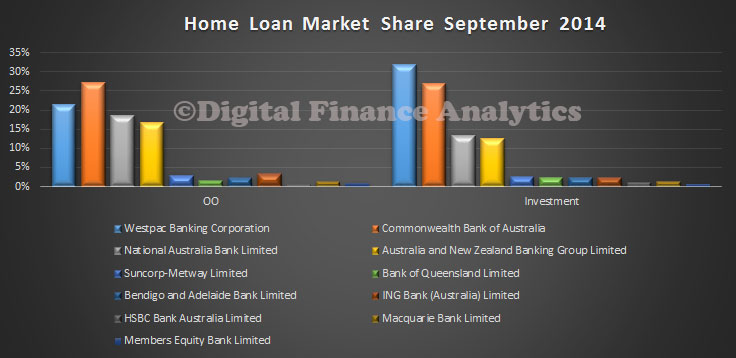
Looking at the bank specific data, Westpac leads the way on Investment Loans, with CBA continuing to grow its relative share of investment lending. Should the rules of the game change, thanks to RBA intervention, then WBC and CBA (the Sydney based banks) are likely to feel the heat more than the others. Competition amongst the big players is hot, with significant discounts and special offers available to lure prospective borrowers. Lending growth is still well behind property price rises in most centres.
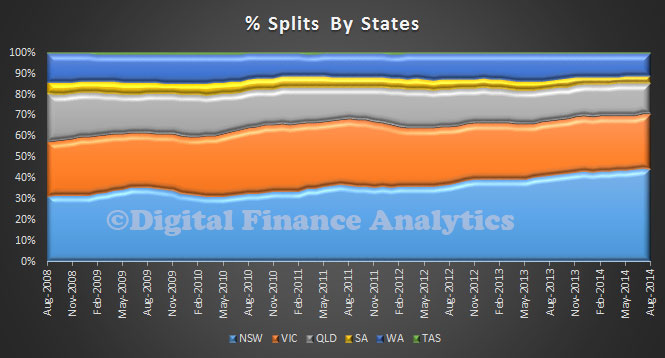
 In terms of relative market share, WBC has 32% of all Investment loans, and CBA 26.9%. On the Owner Occupied loans, CBA has 27.2% of the market and WBC 21.4%.
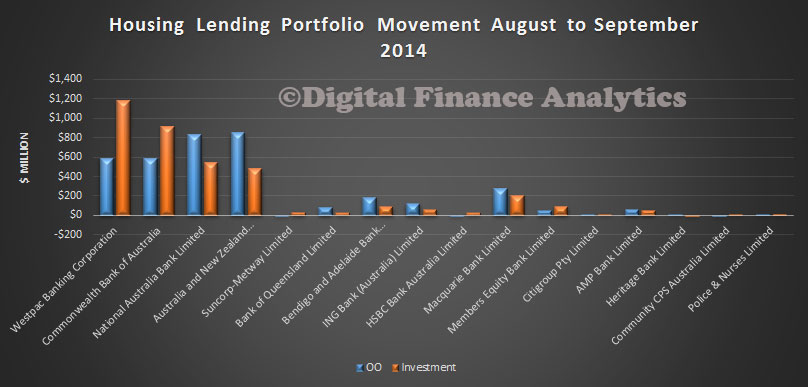
 Looking at portfolio movements, in the past month, WBC has been lending the most, note also Macquarie is active as it continues its strategy to grow its retail business.
 Another way to look at this growth pattern is by month on month percentage movements. Relatively, Macquarie is the most aggressive, followed by AMP bank.
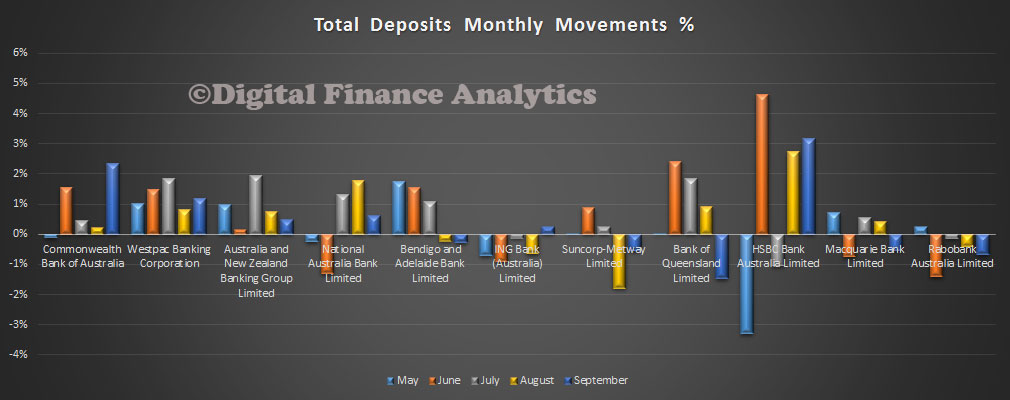
 Turning to the other data in the statistics, on the deposit side, balances grew by 0.75%, to $1.749 trillion. This is a slowing from the previous 1.02%, perhaps reflecting falls in average deposit rates relative to other investments.
 In terms of monthly movements, nab has been the most aggressive amongst the larger banks, together with HSBC from the smaller players. Relatively speaking, Suncorp, Rabobank and Bendigo went backwards.
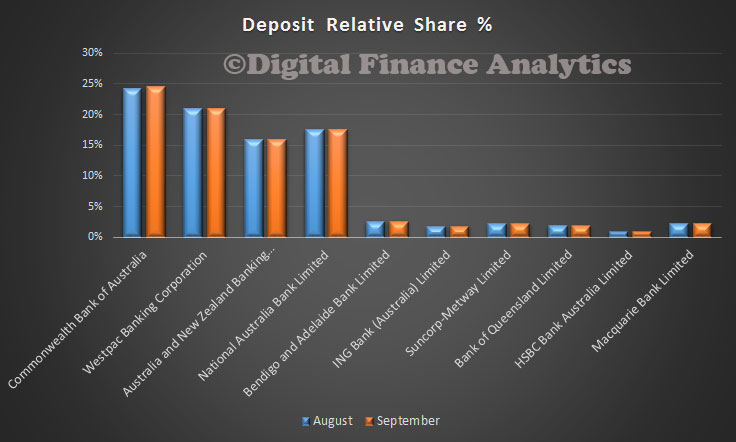
 Looking at relative shares, CBA has 24.2%, WBC 21.0% and nab 17.6%. This chart highlights the concentration in the big four, with a combined 78.4% of all deposits. With deposits backed by the government guarantee, these might be viewed as government back funds, and this helps to prop up the credit ratings of the major players. The Australian Government has guaranteed deposits up to $250,000 in Authorised Deposit-taking Institutions at the moment. There is a case to review this, and we wonder if the FSI report, due soon will mention it.
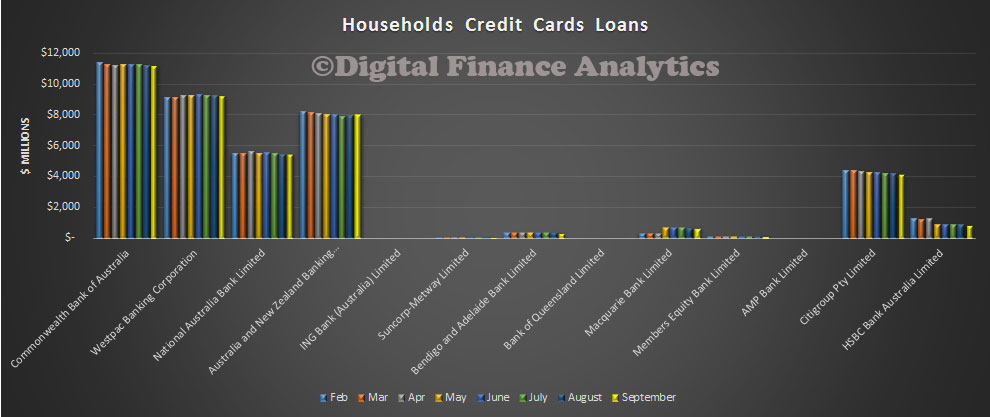
 Finally, Cards. The balances on cards are at $40 billion, just $130m up from last month.
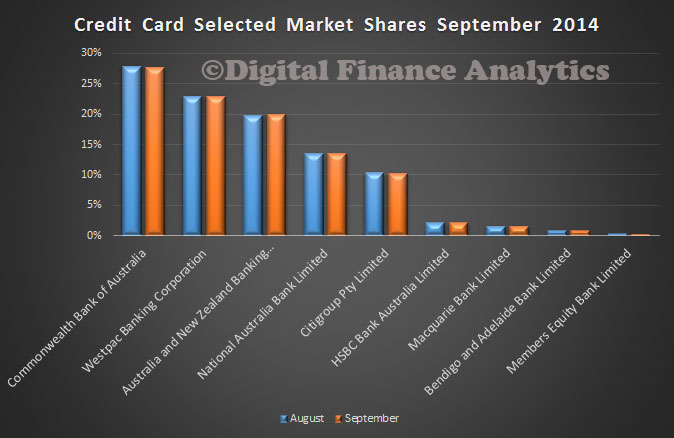
 CBA has 27.9% of the market, Westpac 22.9% and ANZ, 19.6%. The big four have combined 84%, and with Citigroup’s 10%, the five have close to 95%.
 So, in summary, deja vu. Hot investment lending, industry concentration, and large deposit balances guaranteed.

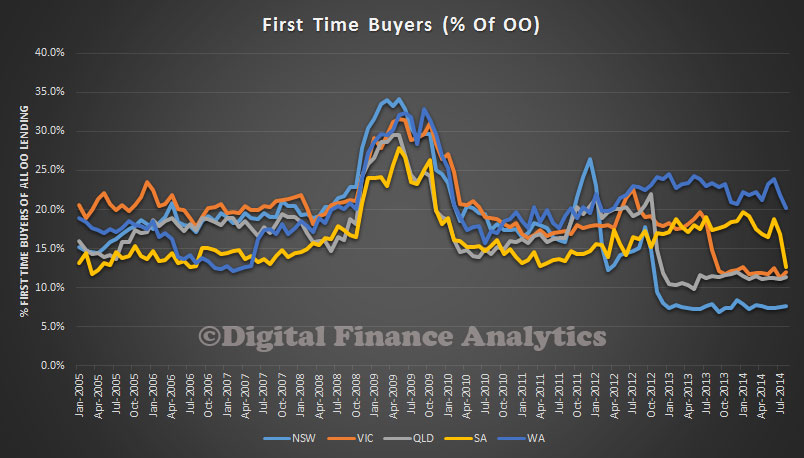
 In original terms, the number of first home buyer commitments as a percentage of total owner occupied housing finance commitments rose to 12.0% in September 2014 from 11.8% in August 2014. Still near the lowest on record.
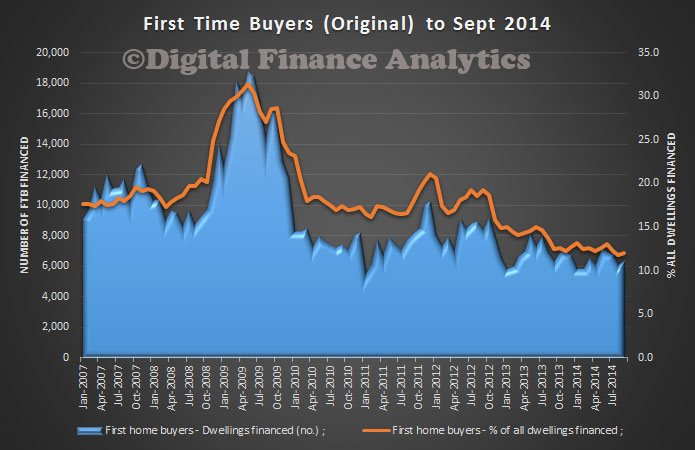 NSW first time buyers continues at the lowest levels, though with a slight uplift this month. WA data flatters the Australia-wide averages for first time buyer finance. It is not just a Sydney thing.
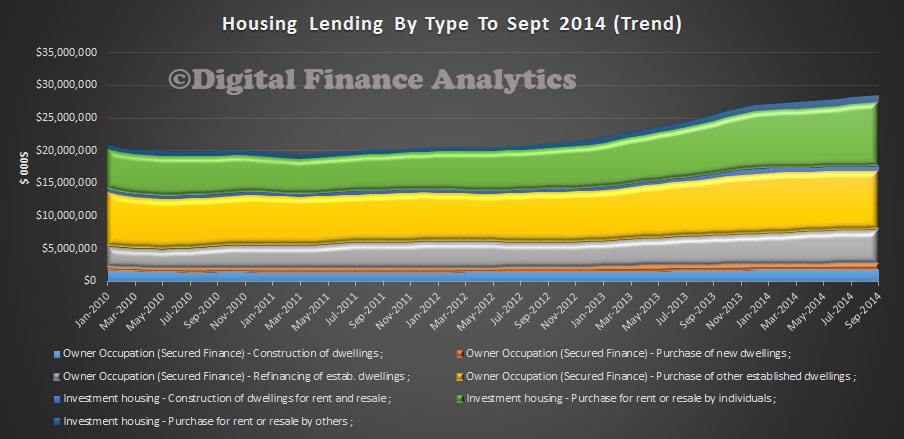
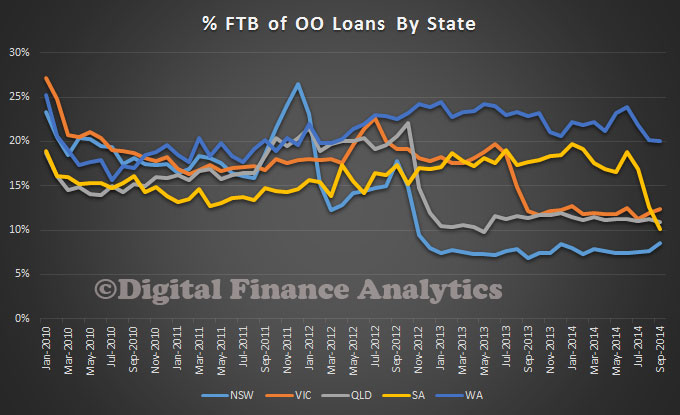 In trend terms, the number of commitments for owner occupied housing finance fell 0.2% in September 2014. In trend terms, the number of commitments for the purchase of established dwellings fell 0.3%, while the number of commitments for the purchase of new dwellings rose 1.2% and the number of commitments for the construction of dwellings rose 0.2%.