Housing Lending Up Again In July to $1.382 Trillion

Today is a big data day, with the monthly banking statistics from APRA and the financial aggregates from the RBA for July. Total credit grew by 0.4% in July, with Housing lifting by 0.5%, Personal Credit at 0.2% and Business Lending at 0.3%. In the last year, overall credit rose 5.1%, Housing 6.5%, Personal Credit 0.8% and Business 3.4%.

Looking in more detail at home lending, we see that overall lending was up to $1.382 billion, from $1,375  billion in June. Owner Occupied Lending rose by $3.5 billion and Investor Lending rose by 3.6 billion. This equates to an annual rise of 4.8% for Owner Occupied loans and 8.5% for Investment loans.

HousingLendingJuly2104The proportion of Investment loans from ADI’s rose again to 34.9% of all their housing loans, the largest monthly share ever. From an overall market perspective, a little below 34% of all loans written were for investment purposes.

HousingLendingPCJuly2104 The relative growth in Owner Occupied versus Investment loans is quite stark. Also of note is that growth in both types of loan appears to be slowing recently.

HomeLendiingGrowthByTypeJuly2014Turning to the banking statistics from APRA, total home lending from the banks was $1,273 billion (the gap between this and the RBA numbers of $109 billion is the non-bank sector).  CBA continues to lead the pack on Owner Occupied loans, whilst Westpac leads on Investment loans.

HomeLenidngTrendsJuly2014Looking at the share figures, of the main players, CBA and Westpac have the largest footprints and between them have more than half the market.

HomeLendiingSharesJuly2014Portfolio movements highlights significant Investment Loan grow at Westpac, and both types of loan at CBA. Away from the majors, Macquarie and Member Equity Bank grew faster than the other regional players.

HomeLendiingMovementsJuly2014Turning to deposits, the total with banks rose to $1,736 billion, up 1.2% in the month. Westpac, nab and ANZ lifted the value of deposits more than Westpac in July.

DepositMovementsJuly2014Finally, in the cards portfolios, the overall value fell by $270 million in July to $40.3 billion.  In terms of the portfolio, CBA continues to hold the largest share by value, with Westpac and ANZ following.

CardsJuly2014


Bank Profits Up To $8.4 Billion In June Quarter – APRA

Yesterday APRA published their quarterly ADI performance statistics to June 2014. So today we look at some of the detail contained in this mammoth release, with a focus on the four major banks, which makes up the bulk of the industry.

APRA reported that the net profit after tax for all ADIs was $8.4 billion for the quarter ending 30 June 2014. This is an increase of $0.1 billion (1.2 per cent) on the quarter ending 31 March 2014 and an increase of $0.2 billion (2.6 per cent) on the quarter ending 30 June 2013. The profit margin for all ADIs was 32.3 per cent for the year ending 30 June 2014, compared to 29.8 per cent for the year ending 30 June 2013. Impaired facilities were $19.9 billion as at 30 June 2014. This is a decrease of $1.8 billion (8.3 per cent) on 31 March 2014 and a decrease of $5.9 billion (22.9 per cent) on 30 June 2013. Whilst there are 161 entities within the data, a quick analysis of net profit shows that the big four have the lions share of profit after tax. So, we will focus our analysis on the majors.

AllandMajorsNetProfitJune2014We note that for the majors loans and deposits continue to grow, and they are overall quite well aligned, though deposit growth is slowing slightly more recently.

MajorsGrowthDepositsandLoansIncomeJune2014Looking at income sources for the majors, overall net interest income continues to rise, but the impact of lower rates, and discounting in the home loan market shows that gross interest income from the home loans has fallen from its peak in 2011. Bank margins are rising thanks to a change in funding, and lower international capital market rates.

MajorsInterestIncomeJune2014Looking at fee income, we see fees holding their own in value, but as a percentage of all income, fees are falling, standing at 20% of total income in the most recent quarter.

MajorsFeeIncomeJune2014Lower interest rates have had an impact on the mix of deposits, with more money going into call deposits than term deposits. With rates so low, term deposits, and certificates of deposits are less attractive.

MajorsDepositMixJune2014Looking at asset quality, the value of specific provisions have fallen again, as impaired facilities and past due payments have reduced. In fact the bulk of the profit growth can be traced to a reduction in the level of provisions!

MajorsAssetQualityJune2014Capital ratios stand at 12%, the highest they have been, although these are relatively modest compared with some other countries. We commented on the capital ratio question recently.

MajorsHomeCapitalJune2014So, overall, the banks remain strong, but the big four which dominate the banking scene in Australia are relying largely on the release of provisions and improved margins to maintain profit growth and profit margins.

Interest Only Loans Up To 43.2% In June – APRA

APRA just released their quarterly data on housing exposures of the Authorised Deposit-taking Institutions in Australia for the June 2014 quarter. As at 30 June 2014, the total of residential term loans to households held by all ADIs was $1.23 trillion. This is an increase of $29.7 billion (2.5 per cent) on 31 March 2014 and an increase of $97.2 billion (8.6 per cent) on 30 June 2013. Owner-occupied loans accounted for 66.2 per cent of residential term loans to households. Owner-occupied loans were $811.7 billion, an increase of $16.5 billion (2.1 per cent) on 31 March 2014 and $56.5 billion (7.5 per cent) on 30 June 2013.

ADIs with greater than $1 billion of residential term loans held 98.4 per cent of all residential term loans as at 30 June 2014. These ADIs reported 5.1 million loans totalling $1.21 trillion and an average loan size was approximately $237,000, compared to $230,000 as at 30 June 2013.

There are a number of interesting observations within the data, but the one which stands out is the continued growth in interest only loans. Looking at the new loans written, we see that 43.2% were interest only loans. This is the highest ever, and reflects the growth in investment loans where tax offsets are maximized by keeping the balance as high as possible.

NewLoansInterestOnlyJune2014We also see a growth in the number of loans which are approved outside normal criteria. It lifted to more than 3.5% of all loans written in the quarter. At a time when regulators are stressing the importance of good lending practice, this is a surprise, but reflects the fact that larger loans are required by some to chase inflated house prices.

OutsideServicabilityJune2014The proportion of new loans originated via brokers was 43%, based on the value of loans written. This is the highest for 5 years.

BrokerLoansJune2014Low documentation loans continue to make up only a small proportion of all loans written.

LowDocJune2014Turning to the portfolio data, (the stock of all loans held by ADI’s) we see the continued growth in interest only loans, to 35% of all loans, the continued fall in low document loans,

LoanStockTypesJune2014

The average loan balances across the portfolio for loans with offsets, and interest-only mortgages continues to rise, with the average balance for the latter now at $299,000.

LoanStockAverageBalancesJune2014Investment loans across all ADI’s now make up 33.8% of all lending in the portfolio.

LoanStockPCInvestmentJune2014We see that the number of lending entities fell again to 162, highlighting continued concerns about the competitive tension in the industry.

NumberofEntitiesJune2014


June Finance Data – ABS

The ABS published their June lending data today, covering commercial, housing and other lending categories. Owner occupied housing rose 1.8% in seasonally adjusted terms, Personal finance fell 1.8% and commercial lending rose by 12.1% in June after a fall of 5.9% in May.

AllLendingJune-2014Looking at housing lending, investment lending remains significant (though in percentage terms it fell slightly this month). This is on a seasonally adjusted basis.

HousingLendingJune-2014Investment lending accounted for 38% of all housing including refinance, and unsecured.

InvestmentPCJune2014Looking more narrowly, the proportion of investment loans written remains close to record, at 46.3% of loans, the all time record is 46.8% (May 2014). This is calculated by removing refinance and unsecured lending.

InvestmentTrendJune2014

June Housing Finance Up 1% – ABS

The ABS published their housing finance data today to June 2014. In seasonally adjusted terms, the total value of dwelling finance commitments excluding alterations and additions rose 1.0%. The value of commitments grew faster than the number of transaction, so the average loan size is increasing.

TotalCommittmentsJune2014Growth in NSW, WA and TAS was faster than the national average.

StateMovingAverageJune2014

We see the momentum spread across the states, with WA and NSW making the largest growth contribution. VIC and QLD grew more slowly.

TotalCommittmentsValueStateJune2014

First time buyers are still at historic lows. In original terms, the number of first home buyer commitments as a percentage of total owner occupied housing finance commitments rose to 13.2% in June 2014 from 12.6% in May 2014.

FTBPCJune2014

State variations are quite marked. NSW has the lowest proportion of first time buyers, WA the highest. The VIC data shows the impact the removal of some first time buyer incentives in 2013.

FTBPCStateJune2014

Investors loans grew faster than owner occupied loans. This is consistent with the results from our household research.

OOINVSplitsJune2014The splits, after removing refinance of existing loans are 47% investment loans and 53% owner occupied loans.

OOINVPCSplitsJune2014So, momentum continues, the trends are set, growth in the investment sector, first time buyers excluded, and overall growth stimulated by rising prices. The RBA quarterly statement on monetary policy, issued today, indicates they are  comfortable with the current position:

One area where there has been a marked improvement is dwelling investment, which grew strongly in the March quarter and is clearly in an upswing. The increase in dwelling investment is being underpinned by the ongoing strength in the established housing market. Housing price inflation over 2014 to date has not been as rapid as it was over the second half of 2013, but prices continue to rise. Loan approvals are higher than they were a year ago, but have been little changed since late last year. At this level, they are consistent with growth in housing credit stabilising at a rate that is a bit faster than income growth, although the growth of investor credit has continued to outpace that of owner-occupiers. The high rate of housing price inflation has underpinned strong growth in standard measures of household wealth. Along with the very low level of interest rates, this has seen consumption growing a little faster than household income, leading to a gradual decline in the saving rate over the past 18 months or so. Nevertheless, after picking up through 2013, consumption growth looks to have slowed in the first half of this year, with weaker retail sales growth and consumer sentiment falling to below-average levels. It remains to be seen whether this slower growth of consumption is temporary. Indeed, a timely measure of consumer sentiment has rebounded recently to be back above average.

I am less sure, because we are banking on larger loans supporting the growth in house prices, despite record low interest rates, and a significant rise in investment loans. There are risks in this scenario.

Housing Lending Reaches Record $1.375 Trillion in June – RBA

The RBA published their financial aggregates to June 2014, and rounds outs the picture we discussed yesterday. Looking at lending aggregates first, we see investor housing moved up 8.7% in the 12 months to June 2014, whilst owner occupied lending grew over the same period by 5.3%, thus, combined, housing grew 6.4% in the past year. Business lending grew, but was boosted by the provision of bridging loan facilities associated with the re-structure of a domestic corporate entity, and personal credit was up by 3.5% over the last 12 months.

FinancialAggregates12MonthPCGrowthJune2014We can show the monthly data, which highlights how housing lending has been moving. The growth in investment lending is clear.

FinancialAggregates1MonthPCGrowthJune2014Turning to the value lent, housing lending reached a new record, $1.375 trillion.

FinancialAggregatesMonthlyBalancesJune2014Looking at the split between owner occupied and investment lending, the stronger growth on the investment side is again clear,

InvestmentLendingSplitValueJune2014and is at a new record of 33.73% of all housing loans outstanding.

InvestmentLendingSplitPCJune2014Looking at how the banks are funding this lending growth, we see overall growth in deposit growth slowing

FinancialAggregatesDepositBalancesJune2014and overseas funding rising.

FinancialAggregatesOffshoreBorrowingsBalancesJune2014The continued growth in investment lending will drive house prices higher, and bloat the bank’s balance sheets, but is not economically sustainable. Ever greater leverage into the housing sector remains a concern. That said, data from our latest household surveys, just in, highlights that investors are getting a second wind, so more growth in likely. Updated survey results will be released next week.

June Bank Lending Data Up Again!

APRA published their monthly banking statistics for June 2014 yesterday. This is a snapshot of the bank’s total books by category. Momentum continues in the housing sector, with owner occupied lending up 0.7% and investment lending up 1.2% in the month, and totalling $1.266 trillion. Looking at the trend since January, we see the majors still sitting in their familiar positions, and we note the momentum at ING and Macquarie also.

HomeLoanTrendsJune2014Looking in detail at the relative share in June, CBA has more than 27% of owner occupied lending, and Westpac nearly 32% of investment loans.

HomeLoanSharesJune2014Looking at the movements, month on month in value terms, we see Westpac grew their investment lending most strongly, CBA grew both owner occupied lending and investment lending, whilst nab focused more on owner occupied lending. Macquarie is writing both owner occupied and investment loans. Bendigo is more focused on owner occupied lending.  Members Equity appears to be loosing a little from their owner occupied loans.

HomeLoanMovementsJune2014Turning to Credit Card Loans, balances rose 0.2% in the month (after a fall last month), at $40.6 billion. CBA still leads the pack, and we continue to see ANZ and Citi shrinking their portfolios. Macquarie, as we highlighted previously picked up an additional portfolio last month.

CreditCardLoansJune2014Finally, if we look at deposits, balances grew at 0.64% in the month, to $1.72 trillion. Not much change in the relative positioning of the banks.

DepositsJune2104However, it is worth noting that nab balances fell in the month, ANZ rose a little, whereas CBA and Westpac had stronger $5billion plus uplifts.

DepositMovementsJune2014Finally, loans grew faster than deposits in the month, and the gap in funding is drawn from the financial markets, where spreads have dropped significantly, more than 65 basis points in some cases from 12 months ago. This is why we are seeing deposit rates falling, as we highlighted recently and savers are looking for yield elsewhere.

Later we will look at the RBA data, which includes the non-bank sector to round out the monthly analysis.

Lending Finance Slips In May – ABS

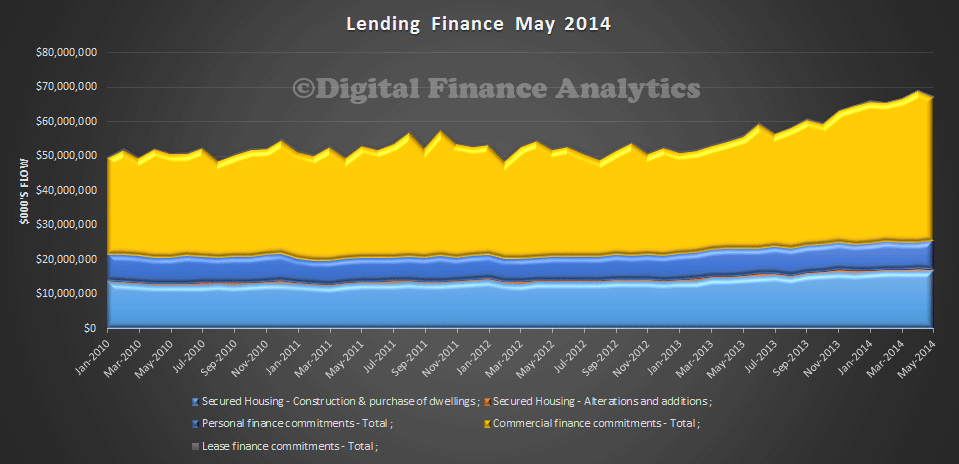
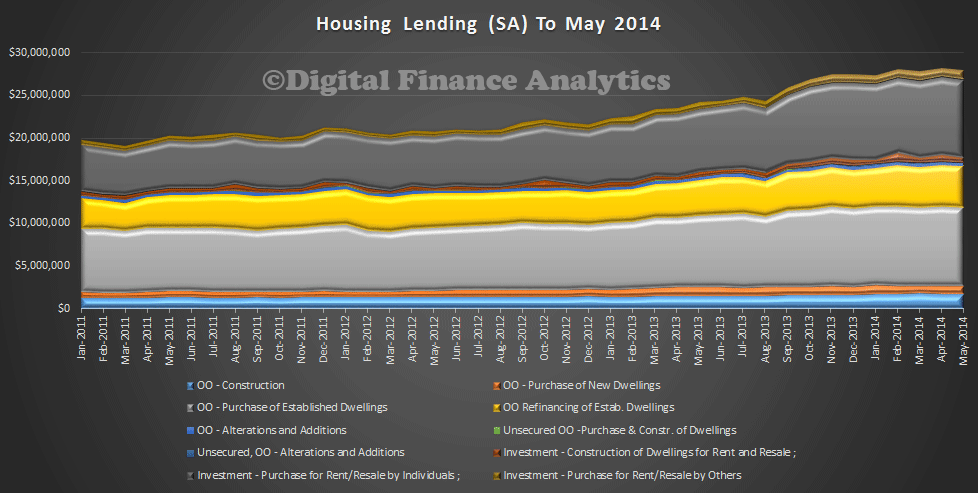
The ABS today published their data series on Lending Finance in Australia to May 2014. The seasonably adjusted value for owner occupation fell 0.7% compared with April, whilst overall commercial lending fell 6.0% month on month. There were increases in personal finance and leasing, but overall lending fell. We start with a chart showing the trend growth in seasonally adjusted terms from January 2010. Remember that commercial lending includes investment housing.

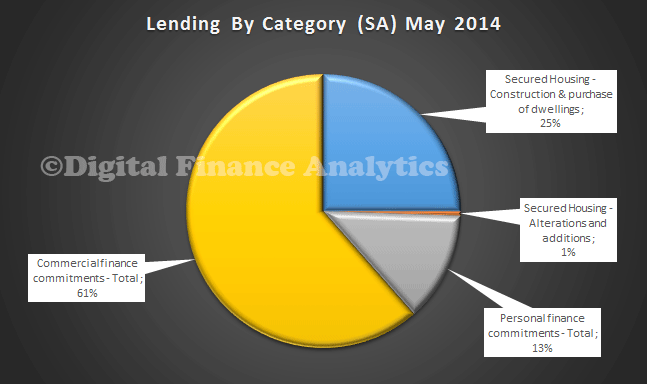
AllLendingAllCateMay201425% of loans were for housing owner occupation, 13% were for personal finance (both revolving and fixed term loans), and 61% were commercial loans.

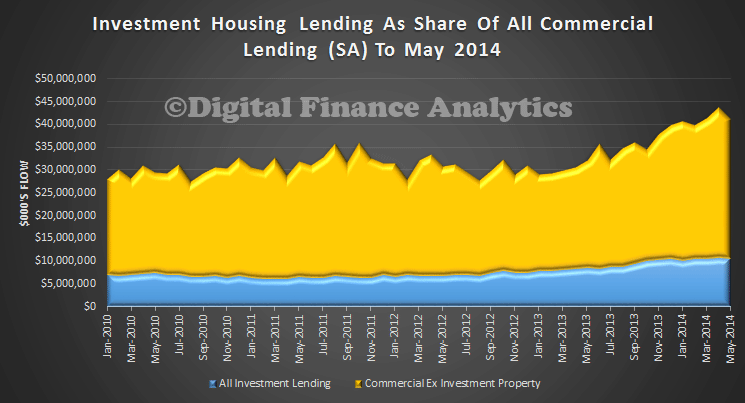
AllLendingAllCatePCMay2014So now we separate out the share of investment loans from commercial lending, and we see the growth has stalled.

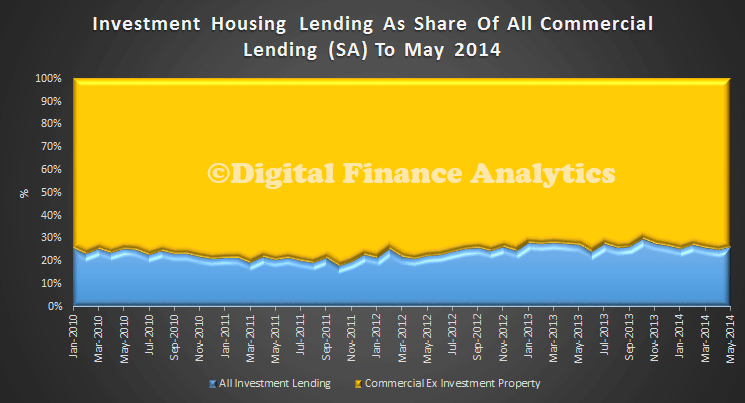
InvestmentShareofCommercial-May2104 This is more striking when we look at the percentage splits. About 25% of all commercial lending is for investment housing purposes.

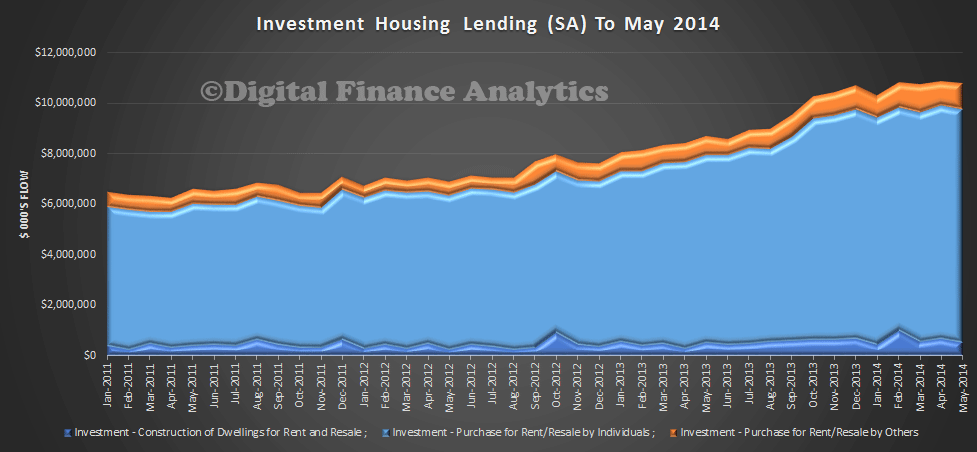
InvestmentShareofCommercial-PCMay2104Turning to housing lending, we see that this has also stalled in May. The growth in the “others” category, includes self-managed superannuation investors, though it is still a relatively small proportion of all lending.

HousingLendingMay-2014InvestmentMay2014

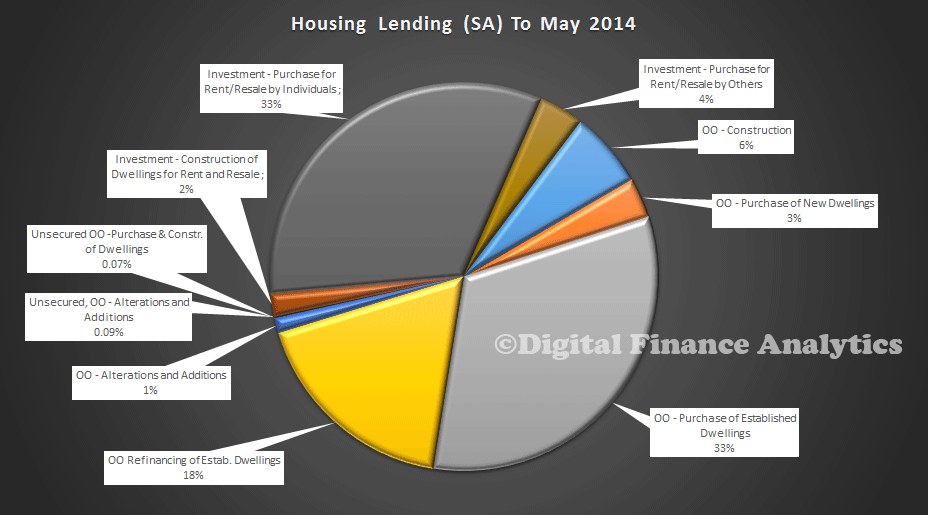
Looking at the splits, investment housing accounted for 39% of loans, 4% of which are for other entities, including SMSF’s. Refinancing accounted for 18% of lending, and 33% was for the purchase of established dwellings.

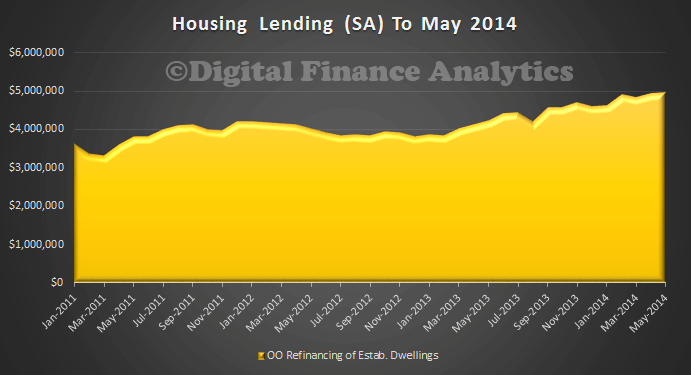
LendingPieMay2014  Finally, it is worth noting the trend growth in refinancing, households are still looking to lock in the current low rates, and to reduce their monthly repayments where possible.

RefinanceMay2014We hold to our view that momentum is shifting, as we reported recently.


Housing Sector Likely To Stall

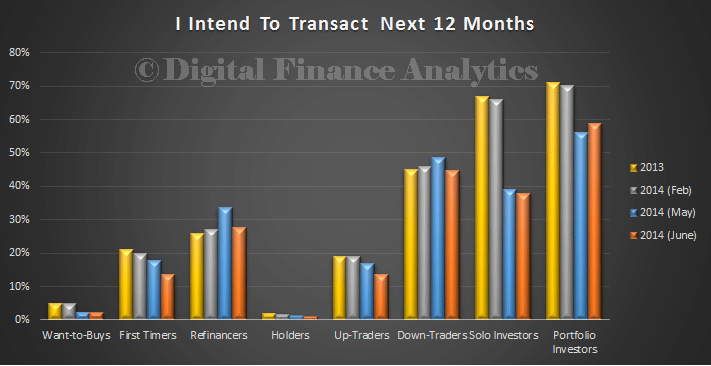
Reflecting on the ABS data released today, and already covered here, and putting that into context of our household surveys, we think momentum is changing and the housing sector could stall in coming months. Demand for new finance fell 0.8% in May. Whilst refinancing remains quite buoyant, thanks to low rates, investors appear to be slowing, as already foreshadowed in our surveys.

Transact12MonthsDFAJun14First time buyers are still at low levels,

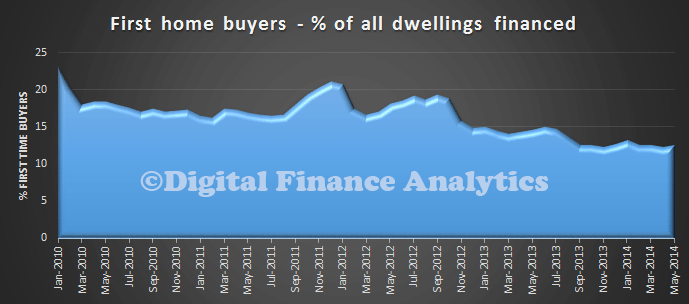
OOFTBMay2014and they are still priced out of the market.

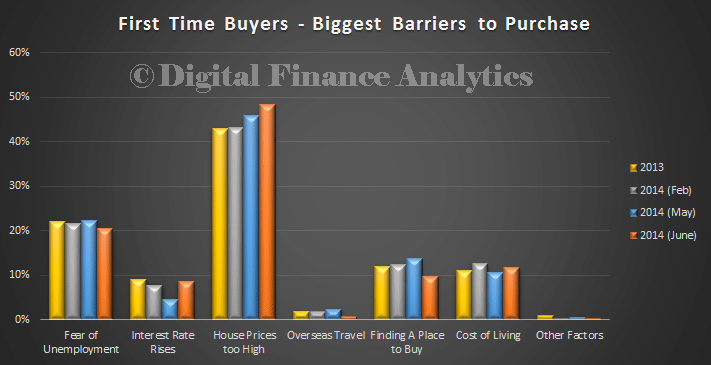
FTBDFAJun14The current low interest rates and rising prices have together encouraged households to transact sooner than they might otherwise would, pulling transactions forwards, but this won’t last.

So, if future demand is not coming from first time buyers and investors, where will demand come from? Well, we know there are many households who would like to enter the market, but cannot because prices are too high, these property inactives won’t change their tune anytime soon. Will foreign investors keep the property ship afloat? The problem here is there is little good data on overseas investors, and in any case, is this sensible policy?  The contribution which SMSF investors might make will hardly move the dial.

We also know that unemployment is up, and likely to continue to trend this way, which directly impacts households and mortgage stress. In addition consumer confidence is not that flash.

We think interest rates may be taken down by the RBA later in the year, but lower rates wont bring more households out of the woodwork because the banks won’t relax their serviceability buffers any further.

Putting all this together, it is likely we are at the top, and both house prices and lending will probably reverse later in the year. This creates a massive problem for the RBA who were banking on housing being the economic bridge between the end of the mining boom and the return to growth from other commercial sectors.

We should have implemented policies to stimulate the commercial sector earlier, rather than inflating house prices and the banks balance sheets with unproductive lending. Lending to business returns growth to the economy,  flowing funds to inflated housing does not.

Housing Finance Up To $1.3 Trillion In May – ABS

The ABS released their latest housing statistics today. Total ADI lending now tops $1.3 trillion. Investment lending has reached a new high at 33.8% of all loans. The trend estimate for the total value of dwelling finance commitments excluding alterations and additions rose 0.2%. Investment housing commitments rose 0.3% and owner occupied housing commitments rose 0.2%. However, In seasonally adjusted terms, the total value of dwelling finance commitments excluding alterations and additions fell 0.8%.
OOMay2014There were some state variations in owner occupation loans, but in percentage terms there is more noise in the data from the smaller states. NSW, QLD and SA were up from the previous month, whilst VIC and TAS fell month on month.

OOStatePCMay2014

The proportion of fixed rate loans remain elevated, but off its 20% high in 2013.

OOFixedMay2014First time buyers were slightly higher in May, but still lower than average and close to all time lows.

OOFTBMay2014Investment lending is still a significant factor, with close of 33.8% of lending for investment purposes. This is an all time record for investment lending.

InvestmentPCMay2014The banks have a greater proportion of investment lending …

InvestmentPCBanksMay2014compared with credit unions or building societies.

InvestmentPCCUMay2014 InvestmentPCBSMay2014The stock of total ADI housing lending is now above $1.3 trillion in original terms.

StockHousingLoansMay2014Finally, note there is an investigation into the first time buyer data. The ABS advise that in collecting this information, lenders are asked to report all loans to first home buyers. Concerns have been raised that under-reporting could occur if some lenders were only able to accurately report on those buyers receiving a first home buyer grant. Most data on first home buyers are collected by the Australian Prudential Regulation Authority (APRA) under the Financial Sector (Collection of Data) Act 2001. APRA is contacting lenders on behalf of the ABS to investigate whether lenders experience any difficulties reporting on loans to first home buyers. The outcomes from the investigation will be published on the ABS website.