Australia’s and New Zealand Has Fiscal Space To Support Demand

Moody’s says that on 22 March, Australia (Aaa stable) announced economic relief measures, totalling AUD66 billion ($38.2 billion, or around 3% of
GDP) in support to households, businesses and guarantees to small and medium-sized enterprises (SMEs), in addition to a package announced previously and a set of measures aimed at supporting credit.

On 17 March, New Zealand (Aaa stable) announced a NZD12.1 billion ($7.3 billion), or 4% of GDP, stimulus package to provide immediate support to the economy and alleviate the disruption caused by the coronavirus outbreak.

Both governments have indicated that they will adopt further measures amid the rapidly deteriorating global economic outlook.

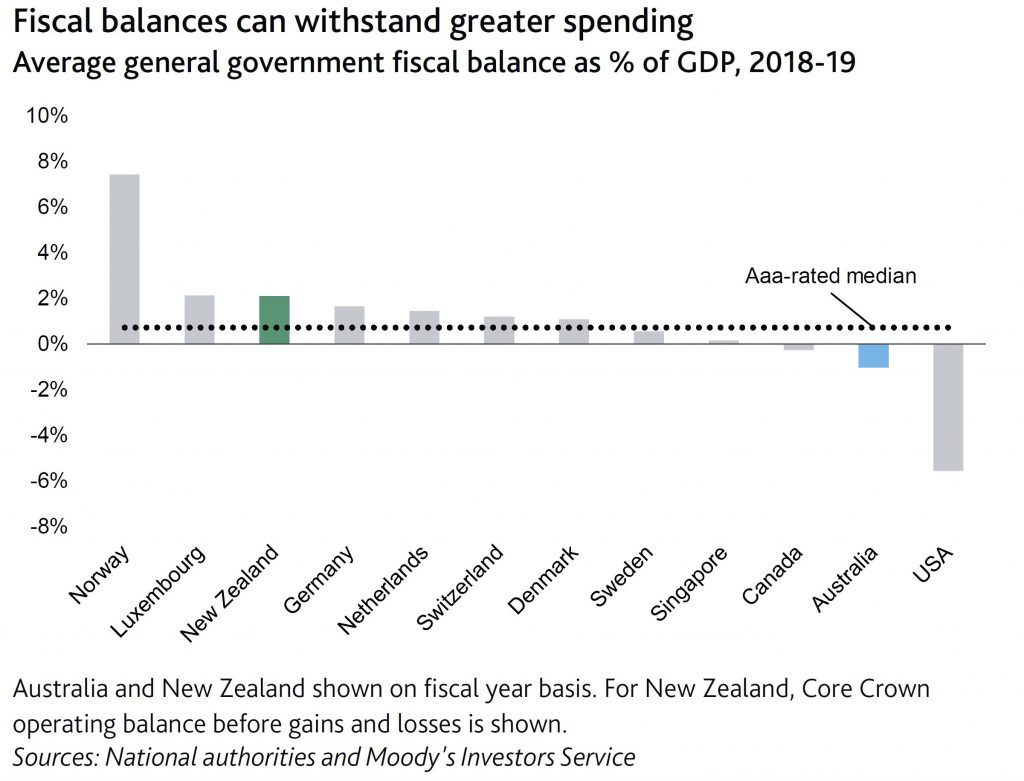
The measures highlight the strong institutional capacity of both Australia and New Zealand to develop emergency fiscal responses during an unprecedented global shock. The measures also demonstrate a high degree of fiscal flexibility that allows for larger near-term budgetary expenditure without threatening longer-term fiscal strength.

In addition to the previously announced AUD17.6 billion support to the economy, the Australian government plans to spend about AUD25 billion in support to businesses in this and the next fiscal year (the fiscal year ends in June), AUD21 billion in support to households and to offer AUD20 billion of guarantees to SMEs. Measures include a boost to SMEs’ cash flow, with upfront payments, temporary relief on creditors’ claims for financially distressed companies, a direct lump-sum payment to individuals and, specifically, to vulnerable households among other measures.

The New Zealand government will spend NZD6 billion by June 2020, as around NZD5.1 billion of the entire package is allocated as wage subsidies for affected businesses in all regions and sectors. The measure aims to stave off a significant deterioration in the labor market. The government has also announced various business tax changes to alleviate businesses’ cash flow pressures and NZD500 million in additional spending on public healthcare, much of which will go on measures that prevent transmission of the coronavirus in the country.

These stimulus packages come in addition to ongoing monetary policy stimulus in both economies. The Reserve Bank of Australia (RBA) has cut its policy rate by 50 basis points so far in March and offered an at least AUD90 billion (0.5% of GDP) special funding facility to commercial banks, which includes an incentive to increase lending to small and medium sized businesses.

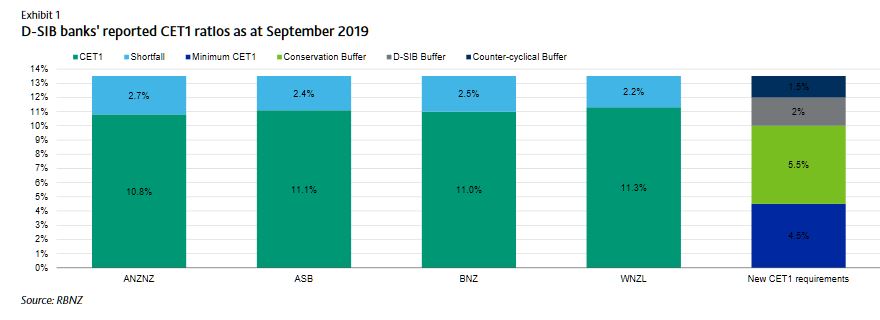
The Reserve Bank of New Zealand (RBNZ) delivered an emergency policy rate cut of 75 basis points on 16 March, in addition to announcing a 12-
month delay to the increase in bank capital requirements, which it estimates will allow banks additional lending capacity of around
NZD47 billion (16% of GDP).

The RBA has also announced a quantitative easing program, aimed at ensuring the yield on three-year government bonds remains around 0.25%, while the RBNZ has left the door open for unconventional monetary policy including largescale asset purchases. {Subsequently Announced].

After accounting for these stimulus packages, Moody’s expects a moderate weakening in both governments’ fiscal positions, with Australia’s
surplus turning to a deficit in fiscal 2020. New Zealand plans to fund its stimulus package with increased debt issuance and a drawdown in cash reserves, pushing net debt above the target range of 15%-25% of GDP.

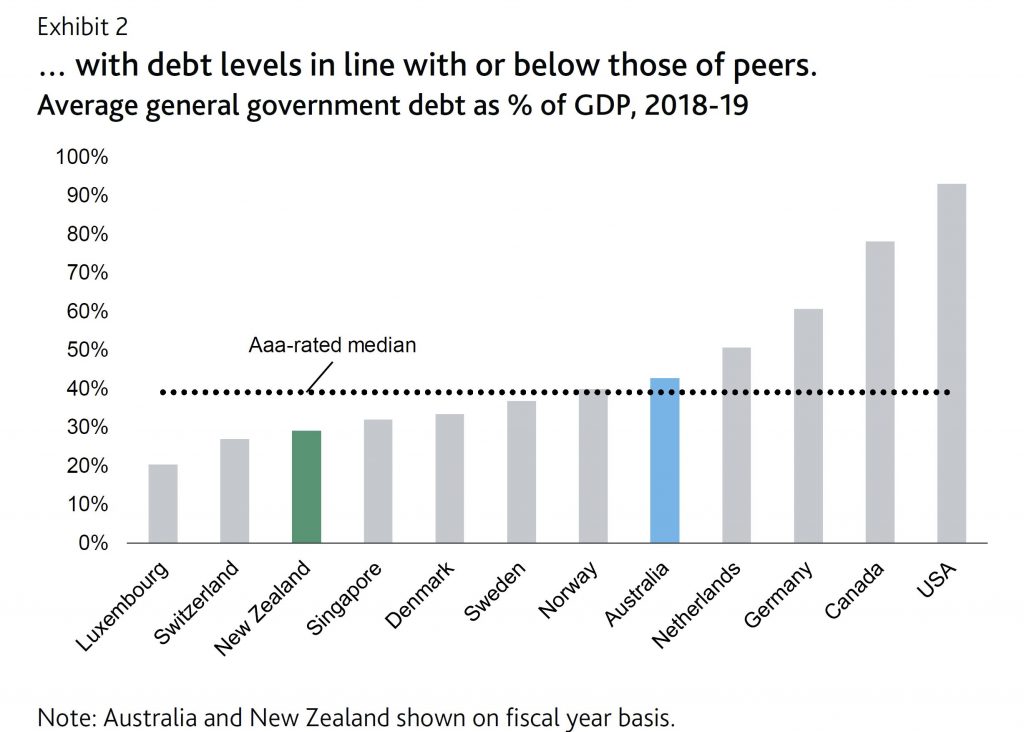
Beyond these measures, weaker revenue growth because of slower economic activity and the triggering of automatic stabilizers will weaken fiscal balances. Moody’s does not view this near-term budgetary expansion by both sovereigns as significantly threatening their fiscal strength. Indeed, it highlights the flexibility and capacity that both governments possess to utilize fiscal policy to support their credit profiles amid an increasingly difficult global economic environment. Particularly for New Zealand, fiscal surpluses and debt levels below Aaa-rated peers provide ample fiscal flexibility

Coronavirus will hurt spending in China, with spillover to global companies

On 29 January, the World Health Organization said that China’s coronavirus has infected nearly 6,000 people domestically so far, with an additional 68 confirmed cases in 15 other countries. The primary impact is on human health. However, the risk of contagion is affecting economic activity and financial markets. The immediate and most significant economic impact is in China but will reverberate globally, given the importance of China in global growth as well as in global company revenue. By sector, the coronavirus will likely have the largest negative impact on goods and services sectors within and outside of China that rely on Chinese consumers
and intermediary products. Via Moody’s.

China’s annual GDP growth forecast unchanged so far, but composition could shift

In our baseline, we expect the outbreak to have a temporary impact on China’s economy and for annual GDP growth in China to remain in line with our forecast of 5.8% in 2020. However, the composition of growth will likely shift because of a dampening of consumption in the first quarter, potentially offset by stimulus measures. Nonetheless, there is still a high level of uncertainty around the length and intensity of the outbreak, and we will review our forecasts as conditions evolve.

Following the outbreak of Severe Acute Respiratory Syndrome (SARS) in 2003, growth and financial markets in China weakened significantly, but for only a short period. An offsetting rebound limited the overall negative effects on annual growth. But the SARS episode is not a perfect comparison, since the composition of the Chinese economy has changed appreciably since 2003.

Over the past 16 years, the contribution of consumption to China’s economic growth has risen significantly. Therefore, the impact of the coronavirus through the consumption channel may well be higher now. If there is indeed a sharp slowdown in consumption, we would expect macroeconomic policy to be eased in response. This could lead to a shift in the drivers of growth in 2020.

The virus will likely have an effect on the revenue of China’s discretionary travel, transportation, lodging, restaurants, retail and services sectors. However, the impact on offline retail sales could be smaller compared with the weakness following the SARS outbreak because of the rapid shift to online sales in China over the past decade. Non-discretionary consumer demand related to the healthcare sector and medical equipment will likely surge.

Chinese authorities have been proactive in taking quarantine measures to contain the infection, including closing public transportation in some cities and conducting screening in major transportation centers. These measures help contain the spread of infection and promote early treatment, although they add costs and constrain economic activity.

Among the challenges of containing the coronavirus include that it can be contagious during the incubation period, and many of those infected or potentially infected traveled ahead of the Lunar New Year. The next few weeks will be vital for determining the extent of infection and the effectiveness of the quarantine measures.

Loss of productivity will likely weigh on domestic supply as a result of sickness, furloughs, and potential delays in manufacturing production given the government’s decision to extend the Lunar New Year holiday. This situation will likely also reduce private investment, but this effect will be secondary to the effect on consumer spending, and will also depend on the macroeconomic policy response.

Hubei province will bear the brunt of economic impact

The outbreak began in Wuhan, the capital of Hubei province and the key transportation and industrial hub in central China. The economic effects on the local area will be significant. Hubei province had expected to record a regional economic growth rate of up to 7.8% in 2020 according to the local authorities, 200 basis points higher than our forecast for China’s total economy. As China’s ninth-most populous and seventh-highest province by GDP, a slowdown in economic activity will pose significant repercussions for the country as a whole.

Hubei’s role in linking China’s eastern coastal area with the central and western regions will extend the ripple effect on neighboring cities and provinces with a higher reliance on service sectors and with higher population densities.

China’s size and interconnectedness amplifies global impact

The fear of contagion risk is already evident in global financial markets. In addition, the negative spillover will also affect countries, sectors and companies that either derive revenue from or produce in China. China has an even higher share in world growth and is even more closely connected with the rest of the world than during the SARS episode. If the outbreak spreads significantly outside China, the burden on healthcare sectors in other affected countries will potentially increase. The revenue of companies and sectors that rely on Chinese demand will be affected as that demand dampens.

The outbreak will also potentially have a disruptive effect on global supply chains. Global companies operating in the affected area may face output losses as a result of the evacuation of workers. Companies operating outside China that have a strong dependence on the upstream output produced from the affected area will also be under pressure because of possible supply chain disruptions resulting from temporary production delays.

Other Asian-Pacific economies are vulnerable to a decline in tourism from China

The outbreak will take a toll on tourism sectors elsewhere in the region, and places outside the region that receive tourists from China. The initial outbreak occurred a few weeks before the Lunar New Year, which has increasingly become a popular time to travel. China has imposed travel bans on outbound group tours to contain the spread of the virus. The fear of contagion could dampen consumer demand and affect tourism, travel, trade, and services in Hong Kong, Macao, Thailand, Japan, Vietnam and Singapore, which have been the top destinations of Chinese tourists in recent years.

China’s National Immigration Administration recorded outbound travel grew about 12% year-on-year to 6.3 million trips during the 2019 Lunar New Year. Following the SARS outbreak, tourism fell sharply in most of these economies, particularly in Singapore and Hong Kong, which were also subject to a relatively high number of infections. We expect the risk of potential negative spillovers to domestic tourism in neighboring countries to be higher than during SARS because Chinese nationals now make up the largest share of visitors to other Asia-Pacific economies. The timing is particularly bad for Japan as it seeks to rebound from the dip in consumption, and presumably real GDP growth, in the last quarter of 2019 following a sales tax hike.

GDP To Take A [Small] Hit – Moody’s

According to a Moody’s report, just out, the near-term credit implications for Australia and the states are limited given a likely contained economic impact and the availability of ample fiscal buffers.

Taking into account both the direct costs and indirect loss of revenue, Moody’s estimate that the cost of the bushfires will reduce Australia’s
general government’s fiscal balance overall by around 0.1% of GDP per year in the next two fiscal years.

The bushfires are mainly concentrated in rural areas, predominantly in national parkland. As a result, the economic cost has been limited, says Moody’s, who revised their forecast for 2020 GDP growth to 2.1% from 2.3% in 2020.

Although fires have burnt across the country, they say the bushfires have been concentrated in NSW, covering an area more than six times larger than that affected by the 2018 Californian fires, for an economy that is seven times smaller than that of California. Predictions by the Australian Bureau of Meteorology indicate that the fires are likely to continue and could even intensify over the coming months.

The Commonwealth government bears some of the direct containment and repair costs – such as for the deployment of military resources for firefighting – as well as the ultimate costs through transfers to the states. The government also incurs some expenditure on relief for affected areas, with AU$2 billion already announced to support affected farmers and businesses. Moreover, Commonwealth tax revenue from affected areas will be hit by temporarily weaker economic activity.

In 2020, reconstruction will boost economic activity, partially offsetting the initial losses from the areas which are being rebuilt.

Over the longer term, if bushfires of this severity were to become more frequent, they would expect tourism and investment, especially in rural areas, to be affected:

…over time, increasingly frequent and severe natural disasters related to climate change are likely to result in rising and recurring costs for Australia’s general and local governments, which will test their capacity – currently strong – to mitigate these costs

Has Deutsche Bank’s Tide Turned?

On 10 December, Deutsche Bank AG hosted an investor day following the announcement this summer of its more radical shift in strategy. Via Moody’s.

We see the bank as being on track to achieving the majority of the plan’s targets, in particular with regard to the proposed de-risking, downsizing and cost-cutting measures, while achievement of the revenue growth targets may prove more challenging. Continued fast and steady progress in achieving the new goals and repositioning DB’s business model will be important to maintaining its current credit strength, which we believe will continue to be supported by its clean balance sheet and solid capital and liquidity metrics during execution.

Within the bank’s capital release unit (CRU), its key wind-down unit, the bank expects risk-weighted assets (RWAs) to decline toward €52 billion by the end of 2019, down 28% year over year, while it expects leverage exposures to fall to €120 billion, a decline of 57% year over year. This includes the effect of DB’s transaction agreement with BNP Paribas on DB’s global prime finance and electronic equities business, supporting further swift de-risking and downsizing of the CRU, as well as help financing the group’s restructuring program out of its own financial resources. DB expects adjusted costs to be €21.5 billion in 2019, and reiterated its target of €19.5 billion of adjusted costs in 2020 and €17 billion in2021.

Notwithstanding continued strong credit-positive cost control, management also guided for lower revenue growth, largely owing to lower interest rates negatively affecting its private bank franchise. DB now expects group revenue to be around €24.5 billion by 2022, a slight reduction from the earlier €25 billion target. This includes a cumulative negative revenue effect of €1.2 billion during the restructuring period. However, DB has already initiated measures aimed at offsetting approximately two-thirds of this revenue strain. Sustained execution success will therefore rely on DB’s ability to rebuild and stabilize core bank revenue against the backdrop of the increasingly challenging macroeconomic environment.

Despite the meaningful restructuring-related charges to date, DB maintained its Common Equity Tier 1 (CET1) ratio at 13.4% as of 30 September 2019, a solid buffer above the recently lowered European Central Bank CET1 capital ratio requirement of 11.59%. In addition, DB’s €243 billion liquidity reserve is well in excess of the requirements stipulated by the liquidity coverage ratio, which was 139% as of 30 September 2019 (its net buffer was €59 billion). DB expects its corporate bank unit to report compound revenue growth of 3% during the 2018-22 restructuring period, unchanged from the July announcement. DB aims to build on its strong global transaction banking, cash management and securities service franchises,as well as grow lending to German corporate customers.

DB expects costs to remain virtually flat as it retains client-facing staff and continues to invest in its franchise. Revenue growth will be supported by focusing on the aforementioned focus areas, as well as passing on negative interest rates to partly compensate for challenges in the euro area.

The investment bank unit aims to achieve 2% compound revenue growth, with an increase expected during the 2019-22 period. DB cited stronger-than-anticipated client retention and a rise in top 100 institutional client revenue as supporting its goals over the next few years. The investment bank unit’s profitability should further benefit from the announced cost-cutting measures over time, of which parts will have to be reinvested in technology and infrastructure to maintain leading positions in credit, foreign exchange, fixed income and currencies in Asia-Pacific and Europe, Middle East and Africa. The private bank will suffer most from the even lower interest rate environment. The bank now expects compound revenue growth to be flat over the 2018-22 period, a reduction from the 2% target set out in July. Private banking will remain key to extracting synergies from the integration of the DB franchise with the former Postbank, converting low-margin deposits into fee-producing investment products through collaboration with asset and wealth management, as well as the corporate bank.

The bank expects its asset management unit’s revenue to report a compound annual growth rate of 1% during the period. The reduced target takes into account lower equity market forecasts and a continued strain on margins in the asset management industry. The unit aims to extract a further €150 million of gross cost synergies by 2022, moving its cost-to-income ratio to below 70% (the bank’s asset management unit target is around 65%). Assets under management increased by 9% to €754 billion, driven by positive market performance and another quarter of positive net new money flows. The CRU has been able to downsize exposures faster than anticipated. Quickly reducing the CRU’s revenue and profitability drag to achieve fast and steady progress in reaching the new goals and repositioning DB’s business model will be important to maintaining its current credit strength, as well as safeguarding its capital adequacy metrics.

Impact Of New Zealand’s Stricter Capital Requirements

According to Moody’s, on 5 December, the Reserve Bank of New Zealand (RBNZ) announced the finalisation of its capital requirements for New Zealand banks. The RBNZ’s decision to raise capital requirements – although slightly watered down from its earlier proposal – is broadly credit positive, because it will make the banking system more resilient to shocks. At the same time, the higher capital requirements will weigh on the banks’ return on equity. We expect the new measures will prompt higher lending rates in efforts to boost profitability and constrain growth in more capital-intensive lending.

For domestic systemically important banks (D-SIBs), which are New Zealand’s four largest banks, ANZ Bank New Zealand Limited, ASB Bank Limited, Bank of New Zealand, and Westpac New Zealand Limited, the Common Equity Tier 1 (CET1), Tier 1 and Total Capital requirements have risen to 13.5%, 16% and 18% of risk weighted assets (RWA), respectively. While the new rules are a slight relaxation from the RBNZ’s initial proposal of 14.5%, 16% and 18% announced in December 2018, they represent a significant increase from the current requirements of 7%, 8.5% and 10.5%. For all other banks, the CET1, Tier 1 and total capital ratio requirements will be 11.5%, 14% and 16%, respectively.

The RBNZ also announced that existing Additional Tier 1 and Tier 2 securities will no longer count towards regulatory capital. Replacing them will be redeemable, perpetual, preference shares and subordinated debt, provided these securities do not have any contractual contingent features such as conversion or write-off at the point of non-viability.

The higher requirements will be implemented by maintaining a regulatory minimum Tier 1 ratio of 7%, of which 4.5 percentage points must be CET1 capital, and introducing a number of prudential capital buffers, which total 9 percentage points (see Exhibit 1). Under the new framework, banks can temporarily operate below 13.5%, but above 4.5%, without triggering a breach of regulatory requirements. However, they will be subject to more intensive supervision and other consequences such as dividend restrictions.
On average, the D-SIB CET1 ratios are around 2.5 percentage points lower than the new requirement of 13.5% (Exhibit 1).

The RBNZ is also limiting the difference between the calculation of RWAs by D-SIBs, which use the internal ratings based approach (IRB), and other banks that use the Standardised approach. This will be done by recalibrating the calculation IRB banks’ RWAs to around 90% of the outcome under the Standardised approach. The combination of higher capital ratio targets and higher RWAs imposed on D-SIBs could spur more competition by reducing some of the capital advantage previously enjoyed by banks using the IRB approach.

The new capital regime will take effect from 1 July 2020 and the banks will have up to seven years to meet the new rules, an increase from the five years initially proposed. The RBNZ’s decision to extend the transition period will ensure banks are well placed to meet the new targets, especially given the Australian Prudential Regulation Authority’s (APRA) recent changes to Australian Prudential Standards (APS) 222 to further restrict how much equity support Australia’s largest banks can provide to their New Zealand subsidiaries, and proposed changes to APS 111, which will increase the capital requirements of providing such support.

The Australian parents of the New Zealand D-SIBs Australia and New Zealand Banking Group Limited, Commonwealth Bank of Australia, National Australia Bank Limited, and Westpac Banking Corporation have all disclosed the estimated impact of the new rules (Exhibit 2).

US bank regulators lower capital requirements for the largest US banks

On 19 November, the US Federal Reserve, the Comptroller of the Currency, and the Federal Deposit Insurance Corporation approved a final capital rule for the largest US banks that requires them to adopt the standardized approach for counterparty credit risk (SACCR).

The rule must be adopted by those US banks which are mandated to use the Basel III advanced approaches (i.e., advanced internal ratings-based); other US banks may voluntarily adopt it. The advanced approaches banks include the eight US global systemically important banks: Bank of America, The Bank Of New York Mellon, Citigroup, Goldman Sachs, JPMorgan Chase & Co, Morgan Stanley State Street Corporation, and Wells Fargo & Company, as well as Capital One, Northern Trust Corporation, PNC Financial Services Group, and U.S. Bancorp. Many of these entities are also benefitting from the Fed’s Repo operations, which are designed to provide additional liquidity.

Moody’s says as originally proposed, SACCR would have resulted in a modest increase in risk-based capital requirements for the largest US banks but a modest decline in their leverage ratio requirements. However, in the final rule US regulators made several revisions to the original proposal which we expect will reduce both capital requirements, a credit negative.

The final rule is effective on 1 April 2020, with a mandatory compliance date of 1 January 2022. In 2014 the Basel Committee on Banking Supervision adopted SACCR as an amendment to the Basel III framework and in October
2018 US regulators proposed requiring the largest US banks to use SACCR for calculating their derivatives exposure amounts. SACCR is a more risk-sensitive approach to risk-weighting counterparty exposures than the current method and also revises certain calculations related to cleared derivatives exposures, including the measurement of off-balance-sheet exposures related to derivatives included in the denominator of the supplementary (i.e., Basel III) leverage ratio (SLR).

In the final rule, US regulators have made certain revisions to the original proposal, including reducing capital requirements for derivative contracts with commercial end-user counterparties and allowing for the exclusion of client initial margin on centrally cleared derivatives held by a bank on behalf of its clients from the SLR denominator.

Regulators explained that the reduction in capital requirements for exposures to commercial end-users is consistent with congressional
and other regulatory actions intended to mitigate the effect of post-crisis derivatives reforms on the ability of such counterparties to manage risks. Additionally, the exclusion of client initial margin on centrally cleared derivatives is consistent with the G20 mandate to establish policies that encourage the use of central clearing. The revisions may also prevent cross jurisdictional regulatory arbitrage because they would align the US with regulations in the UK and Europe on this matter, which are key jurisdictions where many of the largest US banks operate.

Nevertheless, a reduction in capital requirements would allow firms to increase their capital payouts or add incremental risk in other businesses without needing to hold more capital. Regulators estimate that the final rule would result, on average, in an approximately 9% decrease in large US banks’ calculated exposure amount for derivatives contracts and a 4% decrease in their standardized riskweighted assets associated with derivative exposures. The final rule would also lead to an increase of approximately 37 basis points (on average) in banks’ reported SLRs. If all 12 US banks subject to this rule were to maintain their SLRs at current levels instead of letting them rise as they would under the final rule, it would lead to the removal of approximately $55 billion in Tier 1 capital from the US
banking system.

Regulators also estimated that the final rule would lead to changes in individual banks’ SLRs, ranging from a decrease of five basis points to an increase of 85 basis points. Regulators did not identify which bank would receive the largest benefit. Moody’s estimate that if one of the six largest US banks is the beneficiary of an 85-basis-point increase in its SLR and the SLR was previously its binding capital constraint, allowing it to return to its shareholders an amount of capital equal to the entire benefit, it would lead to a reduction of between $9 billion and $25 billion in capital at just one bank.

In addition, on 19 November, US banking regulators published a final rule that amends the supplementary leverage ratio calculation to exclude custody bank holdings of central bank deposits. The change will only apply to The Bank of New York Mellon, State Street Corporation and Northern Trust Corporation.

Although the amended calculation is credit negative because it will allow custody banks to reduce capital and still meet one of their regulatory requirements, the practical effect is limited because other regulatory capital measures, specifically post-stress capital requirements, constrain the banks.

The final rule reflects the implementation of Section 402 of the 2018 Economic Growth, Regulatory Relief and Consumer Protection Act (EGRRCPA). Although EGRRCPA primarily aims to reduce regional and community banks’ regulatory burden, it also identifies central bank deposits held by custody banks as unique. In particular, custody banks maintain significant cash deposits with central banks to manage client cash fluctuations linked to custody and fiduciary accounts. Typically, these client cash positions are funds awaiting distribution or investment, but they can spike significantly in times of stress when custodial clients liquidate securities.

Under the final rule, only the Federal Reserve, the European Central Bank or central banks of Organization for Economic Cooperation and Development member countries that have been assigned a zero risk weight under regulatory capital rules are considered qualifying central banks. The rule also defines a custody bank as any US depository institution holding company with assets under custody to total assets of greater than 30:1. This ratio precludes other large custody providers also subject to the supplementary leverage ratio, such as JPMorgan Chase & Co., from excluding central back deposits in their capital calculation, because unlike the three qualifying firms they are not predominantly engaged in custody and asset servicing.

Looked at in isolation, the final rule would allow BNY Mellon, State Street and Northern Trust to reduce their Tier 1 capital by roughly $8 billion in aggregate – a significant 17% reduction – and still maintain the same supplementary leverage ratios. However, that ratio is just one of many capital requirements.

Indeed, regulators’ own analysis of the supplementary leverage ratio revisions, based on 2018 data, indicates that the final rule is unlikely to reduce Tier 1 capital for any of the three affected holding companies because other capital requirements are more binding.

Specifically, performance of the banks’ capital requirements under the Federal Reserve’s Comprehensive Capital Analysis and Review (CCAR) process has constrained them.

The future course of the custody banks’ capital positions is not yet clear because other aspects of the US regulatory capital framework remain in flux. In particular, regulators are developing a stress capital buffer, which we expect will be incorporated into the CCAR process. On balance, we anticipate that the custody banks are likely to face a capital regime that is less restrictive, though the extent of capital relief is still uncertain.

However, the banks’ reduced supplementary leverage ratio requirement is an early indication of the likely trajectory.

GFC Lessons For Banks Remain Unlearned

On 7 October, the European Central Bank (ECB) published its liquidity stress test results for 103 euro area banks. ECB’s increased focus on stressed liquidity is credit positive for these banks. As the liquidity coverage ratio (LCR) has a very short 30-day horizon, ECB looking at liquidity stresses lasting six months provides a much more meaningful measure. The test results will be used to strengthen the liquidity risk assessment in the 2019 Supervisory Review and Evaluation Process (SREP), but will not have a direct effect on capital requirements. Via Moody’s.

Overall, the stress test highlights a marked variation in euro area banks’ ability to cope with severe liquidity shocks. It demonstrated that there are pronounced pockets of vulnerability, with 75% of banks being unable to cope with a severe stress that lasted six months. While individual bank results were not released, the ECB stated that large universal banks and G-SIBs were the most exposed.

The ECB focused on idiosyncratic (rather than systemwide) shocks calibrated on the basis of recent liquidity crises. The effect was measured in terms of survival horizons by looking at banks’ cumulative cash flows and available counterbalancing capacity (i.e. the liquidity the banks can generate based on available collateral) in three scenarios. The scenarios include a baseline, in which the bank is no longer able to tap the wholesale funding market; an adverse shock, which adds a limited deposit outflow, limited withdrawals of committed lines, and a one-notch rating downgrade; and an extreme shock scenario, which adds severe deposit run-offs, pronounced withdrawals of committed lines, and a three-notch rating downgrade.

Overall, the banks’ reported median survival period was 176 days, or almost six months, under the adverse shock scenario and 122 days (just over four months) in the extreme shock scenario. Only 25% of the banks have liquidity buffers that would withstand the extreme shock scenario for six months or longer, and the majority (75%) have a survival period that is shorter than six months. Survival periods varied markedly, with differences driven mainly by the banks’ funding mix.

There are significant pockets of vulnerability. Although results for individual banks have not been disclosed, four banks from different
jurisdictions and with different business models have a survival period of less than six months even in the baseline scenario, which we consider very weak, and 11 banks have a survival period of less than two months under the extreme shock scenario. Universal banks and global systemically important banks (G-SIBs) are also harder hit by the stress scenarios.

Exhibit 2 shows the (simple average) effect of the three scenarios compared to the initial stock of net liquidity, with overall outflows equivalent to around 27% of total assets under the extreme scenario. The key effect under the baseline scenario is caused by the lack of access to wholesale markets, followed by deposit withdrawals under the adverse and extreme scenarios.

Although any stress test must be based on assumptions and scenarios, we note that past liquidity crises (according to the ECB’s stress test announcement in February 2019) lasted between four and five months on average. However, 43% of the real life stresses lasted longer than six months. With a median survival horizon of a little longer than four months, many banks may have a survival horizon that may prove short, particularly in a bank-specific crisis with more limited opportunities for the central bank to intervene with extraordinary measures. It also points to the need for banks to mobilize additional non-tradable collateral in addition to the readily available liquidity buffers, which is one of the areas where the ECB observed scope for improvement.

Universal banks and G-SIBs, which are generally more reliant on less stable deposits and wholesale funding, despite having large liquidity buffers, were the hardest hit by the stress scenarios. Their median survival in the adverse shock scenario was 126 days, and 80 days in the extreme shock scenario.

Small domestic and retail lenders, which generally benefit from more stable deposits and lower reliance on wholesale funding, were relatively less affected. Their median survival was more than 180 days under the adverse shock scenario and was 140 days under the extreme shock scenario, indicating that they would maintain positive liquidity for significantly
longer than the universal banks and G-SIBs. The results are in line with our assessment where large banks often have weaker funding and liquidity assessments compared to smaller domestic retail banks. Exhibit 3 shows the counterbalancing capacity and the liquidity outflows per type of bank, with G-SIBs/universal banks significantly more negatively affected compared to small domestic/retail lenders.

The stress test also identified vulnerabilities related to cash flows in foreign currencies, where survival periods generally are shorter than those reported at consolidated level. Whereas the median survival period in EUR was 125 days, the median survival periods in USD and GBP were 57 and 53 days, respectively. This suggests that the lessons during the global financial crisis have not been fully learnt. In addition, some banks’ collateral management practices, which are essential in the event of a liquidity crisis, also need improvement.

The ECB also cautioned that banks may underestimate the negative effect that a credit rating downgrade could trigger. Previous liquidity crises have shown that deteriorations can go quickly and fast.

German Bank Stress Test Hit By Low Interest Rates

Moody says that on 23 September, German bank regulator Bundesanstalt fuer Finanzdienstleistungsaufsicht (BaFin) and the German central bank, the Deutsche Bundesbank, published the results of their biennial stress test applied to 1,412 small and midsize German banks that fall under BaFin’s direct oversight. The tested banks represent 38% of German banking system assets. The stress test scenario was designed well ahead of the recent decision of the European Central Bank (ECB) to lower the rate on its deposit facility to a negative 0.50%.

Instead, the scenario tests the banks for a severe economic downturn combined with rising interest rates and credit spreads. The capital buffers of the tested German banks remained robust under stress with a Common Equity Tier 1 ratio of 13.0% on average, down 3.5 percentage points from the year-end 2018 starting point of 16.5%. The drawback of this scenario is that it does not address the more plausible future environment of weakening economic growth combined with extended low interest rates.

A return on equity survey that accompanied the stress test, however, was more revealing. The survey required the banks to contrast their five-year base-case assumptions for return on equity evolution (from 2018 to 2023) with five defined interest-rate scenarios.

The closest interest rate scenario to current market expectations simulates the present ultra-low interest rates lasting throughout the five years. In terms of potential to impair the banks’ profitability, it is also the most severe. Based on the assumption of a static balance sheet,2 banks would see their profitability falling by more than 50%. The high probability of this interest rate scenario unfolding suggests that the banks need to materially increase their focus on cost management to protect their credit profiles.

Unchanged rate environment is the most severe scenario. The survey results show improved forecasts for base-case profitability at the end of the five-year horizon against the same survey two years ago (2016-21). In part, this reflects moderate progress in trimming high cost bases. The German regulators cautioned, however, that the improvement is substantially driven by the fact that about half of the participating banks (Group B) assumed a rise in interest rates over the five-year horizon from year-end 2018 levels.

They added that even the flat interest rate assumption employed by the other half (Group A) based on year-end 2018 interest rates has become an optimistic scenario. Exhibit 2 shows that long-term interest rates have in fact declined by around 100 basis points since the end of 2018, broadly in line with Scenario 4 (the most severe scenario), with an even more pronounced decline in longer-term rates.

The banks’ simulated results are better under the assumption of dynamic balance sheets. This is because active management intervention to counteract interest rate-driven income declines remains an important lever to reduce the profitability pressure on German banks. Close to half the bank managers surveyed indicated that under Scenario 4, an interest rate drop of 100 basis points, they would consider applying negative interest rates to the deposits of retail clients. Less than one third excluded this for retail and corporate clients under this scenario.

Managers of banks that participated in this year’s stress test expect a combination of weaker deposit margins and a reduced contribution from maturity transformation business to outweigh moderately improving lending margins. This was the case even in Scenario 1 (based on year-end 2018 institutions’ plans with a dynamic balance sheet). It illustrates that banks with lower dependence on maturity transformation results (i.e. with higher fees and commissions income) and with more flexible funding options are better positioned to defend their profitability during a period of extended low interest rates.

As in prior years, the stress test exercise excluded the 21 large German banking groups that are under the direct supervision of the ECB.

We believe that, on aggregate, these larger banks benefit from their access to more diversified funding sources.

The low interest rate environment has particularly compressed the net interest margin on newly originated loans if these new loans have been financed with retail deposits. This is because banks have so far felt unable to charge for retail deposits and these deposits have effectively been floored at 0% interest, even as lending rates have continued to fall.

In contrast, the use of secured or unsecured market funding sources (where costs have continued to fall) available to the larger banks, enables them to substantially offset the decline in interest rates earned on their newly originated loans. This is illustrated in Exhibit 3 using residential mortgage loans as an example. On the other hand, despite economies of scale, large banks’ cost efficiency materially lags the efficiency of smaller German banks – and in turn the efficiency of small German banks lags international peers.

ECB Introduces Deposit Tiering System

On 12 September, the European Central Bank (ECB) announced that it will introduce a two-tier system for banks’ reserve remuneration, exempting a portion of deposits in excess of the minimum reserve requirement from the negative deposit facility rate and giving that portion a 0% rate instead. The introduction of the tiering system on banks’ excess liquidity placed at the central bank is credit positive, says Moody’s.

This is because it will reduce the cost of holding liquidity at the ECB, providing a partial offset. They expect that the tiering mechanism will be particularly positive for banks with material excess liquidity.

The announcement comes as the ECB’s Governing Council announced that it would maintain its accommodative monetary policy stance given slowing economic conditions in Europe, persistent downside risks of global trade tensions and muted inflationary pressures. As a result, the ECB relaunched its Asset Purchase Programme and lowered the rate on the deposit facility by 10 basis points to negative 0.50% from negative 0.40%.

The tiering system on banks’ excess liquidity will moderate the negative effect of persistent low rates on banks in the euro area.

The two-tier system will exempt from negative interest a maximum volume of six times the banks’ minimum reserve requirement, therefore paid at 0%. The minimum reserve requirement and the non-exempted portion of the excess reserves will be charged 0.5%.

The tiering system will apply to all banks and start at the end of October 2019.

Since the aggregated minimum reserve requirement is currently €132 billion, approximately €786 billion (six times the aggregated minimum requirement) would be exempt from negative rates. The remaining reserves and deposit facility would be subject to the new deposit rate of negative 50 basis points, providing a net annual benefit to the euro area’s banks of about €2 billion relative to the status quo of negative 40 basis points on the full balance of €1.9 trillion liquidity placed at the ECB, equivalent to 0.8% of EU banks’ annual net interest income.

In 2018, Moody’s estimate that banks’ €1.8 trillion of total liquidity placed at the central bank at a rate of negative 0.40% cost around €7 billion. This compares with US banks, whose deposits placed with the US Federal Reserve in 2018, remunerated at a rate of 2.35%, represented a revenue of around €40 billion.

The introduction of a two-tier system for banks’ reserve remuneration will be particularly positive for German and French banks, whose liquidity holdings exceed the most their reserve requirements and account for more than 60% of the total liquidity placed at the ECB. The tiering mechanism that the ECB has introduced is similar to the mechanism implemented by Switzerland’s central bank, which also set exemption thresholds for deposit rates as a multiple of banks’ minimum reserve requirements.

Southern European banks will benefit to a lesser extent because they do not hold large amounts of excess reserves at central banks.

However, they will continue benefiting from the third series of targeted longer-term refinancing operations (TLTRO III). The ECB in June 2019 announced that banks could access two years of funding at 10 basis points above the ECB’s refinancing rate of 0%. On 12 September, the ECB removed the 10-basis-point surcharge and announced that TLTRO funding would extend to maturities of three years instead of two, conditions that will be particularly favourable for banking systems with large outstanding repayments from previous TLTRO programmes, such as those in Italy and Spain.

China’s New Prime Rate Mechanism Makes Banks More Risky

On 17 August, the People’s Bank of China (PBOC), the central bank, announced reforms to the loan prime rate (LPR) mechanism. Via Moody’s.

Beginning on 20 August, the new LPR will average the lending rate quoted by 18 banks on that same day to determine the lending rate for all banks when they originate new floating rate loans. This process will then be repeated on the 20th of each month.

This reform will narrow Chinese banks’ lending margins, a credit negative. The narrower margins on loans will also encourage banks to increase their risk appetite and, as a result, weaken asset quality.

According to the PBOC, the National Interbank Funding Center will announce the new LPR at 9.30am on the 20th of every month.

A five-year tenor will be added to the existing one-year LPR to serve as a reference rate for banks pricing long-term loans such as mortgages. To expand the representativeness of the LPR, the PBOC also included eight small banks – including two city commercial banks, two rural commercial banks, two foreign banks and two private-invested banks – to the existing 10, including state-owned and joint stock commercial banks, participating in LPR quotations. Banks’ use of LPR as a pricing reference will be included into and evaluated by China’s Macro Prudential Assessment.

The new mechanism liberalizes interest rates because it will explicitly replace the current loan pricing based on benchmark rates, which are not sensitive to changes in market rates. Under the current practice, introduced in October 2013, 10 banks decide the LPR on a daily basis. This gives them little incentive to price their LPR differently than the PBOC’s benchmark lending rate, which has not changed since October 2015. Although this mechanism was designed to approximate market-oriented interest rates, the actual rate has closely matched the government’s benchmark lending rate. In recent months money market rates and bond yields have declined substantially but actual bank loan rates have remained high, resulting in a wider gap above market interest rates, protecting Chinese banks’ lending margins.

The new LPR formation will be based on open market operations (OMO) rates, mainly the one-year interest rate of the medium-term lending facility (MLF) combined with a premium to reflect bank’s own funding cost, risk premium and credit supply and demand. The PBOC created the MLF in September 2014 to provide banks with medium-term funding typically for three-months to one-year. As of 15 August, the MLF interest rate is 3.3%. We expect the PBOC will increase the frequency to adjust the MLF interest rate to better reflect market rates.

Because of current market conditions, the implementation of the new LPR loan pricing mechanism will directly weigh on bank rates on new loans and lower their net interest margins. We expect that the banks with large loan exposures due for re-pricing in the near-term will be more immediately exposed. The actual impact over time will also be affected by differences in bank’s asset mix, revenue mix, the credit profile of borrowers and cost management.

We expect that the banks’ narrowing margins on traditional loans will prompt some banks to increase their risk appetite, potentially weakening asset quality. For example, banks could shift their investment portfolios to high yield bonds and other high-yield investments from low yield Treasury bonds and investment-grade bonds.

From a risk-management perspective, the new mechanism, by making loan rates more responsive to market rates, will increase banks’ exposure to market volatility and interest rate risk. The lack of a developed interest rate derivative market in China will add to this pressure by limiting banks’ ability to hedge or transfer this risk.