APRA’s non-bank oversight may curb mortgage risks

From Australian Broker.

Broader powers by the Australian Prudential Regulation Authority (APRA) to oversee the non-bank sector will have a positive effect on the residential mortgage market, said analysts from global ratings agency Moody’s.

The measures, announced in last week’s Federal Budget, could see APRA regulating lending by non-bank financial institutions.

This policy, if passed by the Australian government, would help curb riskier mortgage lending in the non-bank sector and thereby reduce any risks found in Australian residential mortgage back securities (RMBS).

“Non-bank lenders have significantly increased their origination of riskier housing investments and interest only mortgages over the past two years, a period over which APRA has introduced measures aimed at limiting growth of such loans by banks and other authorised deposit-taking institutions (ADIs),” analysts wrote in an article for Moody’s Credit Outlook.

“APRA currently regulates banks and other ADIs, but does not regulate lending by non-bank financial institutions. Instead, regulatory oversight of the non-bank sector is presently the responsibility of the Australian Securities and Investments Commission, which enforces responsible lending but does not have the power to implement macro-prudential policy measures.”

By extending APRA’s powers into the non-bank sector, the regulator would be able to set specific limits and ensure loan quality remains comparable to that of banks and other ADIs, Moody’s said. These broader powers would fall on top of the regulator’s March 2017 policy to monitor warehouse facilities that banks use to fund non-bank lenders.

In 2016, housing investment loans issued by non-bank lenders make up for 36% of all mortgages found in Australian RMBS, a large increase from the 16% found in 2015.

In a similar manner, interest-only loans accounted for 46% of all mortgages banking RMBS by the non-banks in 2016, compared to 21% in 2015.

Non-bank lenders write 6% of the total housing loans in Australia.

Budget ignores housing market risks: Moody’s

From Investor Daily.

Tax initiatives introduced in the 2017 federal budget to address housing affordability concerns will do little to alleviate the build-up of “latent risks” in the housing market, according to Moody’s Investors Service.

The federal budget, released on Tuesday, 9 May, outlined a number of changes designed to improve housing affordability, offering tax incentives for first home buyers and tougher rules on foreign investors.

These include allowing retirees to exceed the non-concessional super contribution cap when they downsize their home, creating a new savings account within the super system for first home buyers, limiting foreign ownership in new developments and charging foreign investors who leave properties unoccupied for six or more months a year.

Moody’s noted that these initiatives may prove successful in improving housing affordability over the long-term, but cautioned that an immediate impact on halting the build-up of risk in the housing market was “unlikely”.

“Latent risks in the housing market have been rising in recent years as significant house price appreciation in the core housing markets of Sydney and Melbourne have led to very high and rising household indebtedness,” the ratings agency said.

This increase in household debt coincides with a period of low wage growth and a structural shift in labour markets, Moody’s said, subsequently leading to a rise in underemployment

“Whilst mortgage affordability for most borrowers remains good at current interest rates, the reduction in the savings rate, the rise in household leverage and the rising prevalence of interest-only and investment loans are all indicators of rising risks,” Moody’s said.

The ratings agency cautioned that loan borrowers “are more vulnerable to change in financial conditions” and this put banks at higher risk of losses in their residential mortgage portfolios and “triggering negative second-order consequences for the broader economy”.

Much Doubt Surrounds VIX Index’s Optimism

From Moody’s

Financial markets were recently visited by a rarity. During the past week, the VIX index closed under 10 points on May 8 and 9. Since its start in 1990, the VIX index has closed under 10 points on only 11, or 0.1%, of the span’s nearly 7,000 trading days.

Today’s very low VIX index reflects a great deal of confidence that there won’t be a deep sell-off by equities. Not only is there effectively little demand for insuring against a harsh correction, but sellers of such insurance are will to accept a low price for protection against a market plunge.

This insouciance seems odd given how richly priced the US equity market is relative to corporate earnings and the prospective returns from other assets such as corporate bonds. The current market value of US common stock — according to a model based on pretax profits from current production and Moody’s long-term Baa industrial company bond yield — exceeds its midpoint valuation by a considerable 24%. During 1999-2000’s memorable equity rally, the market value of US stocks first climbed 24% above its projected midpoint in 1999’s first quarter and would remain at least that high through 2000’s second quarter. During January 1999 through June 2000, the actual market value of US common stock exceeded its projected midpoint by 51%, on average.

Another comparison of the two periods shows a similarly striking difference between them. The earlier period averages of a 15.4:1 ratio for the market value of common stock to pretax operating profits and 8.05% for the long-term industrial company bond yield were far above the recent ratio of 11.7:1 and the latest Baa industrial yield of 4.68%.

In stark contrast to the current situation, during January 1999 through June 2000 the VIX index averaged a substantially higher 24.3 points when the market value of US common stock was at least 24% above its projected midpoint. Back then, the market had a greater appreciation of the considerable downside risk implicit in an overvalued equity market.

Two prior cases of a below-10 VIX index preceded vastly different outcomes

January 2007 and December 1993 were the two prior moments when the VIX index spent some time under the 10-point threshold. What followed them differed drastically.

January 2007 was merely 11 months before the December 2007 start to the worst recession since the Great Depression. In contrast, December 1993 was followed by 1994’s 4.0% annual advance by real GDP that was the first of a seven year span that had real GDP growing by a now unheard of 4.0% annually, on average. Far different was 2007’s 1.8% annual rise by real GDP that was at the start of what would be real GDP’s 0.9% average annual rise of the seven-years-ended 2013.

In the year following December 1993’s ultra-low VIX score, the market value of US common stock fell by -3.2% despite 1994’s 18.6% surge by pretax operating profits. A lift-off by the average 10-year Treasury yield from Q4-1993’s 6.13% to Q4-1994’s 7.96% was to blame for 1994’s short-lived drop by share prices. Nevertheless, partly because of 1994’s very strong showing by business activity, the earnings-sensitive high-yield bond spread narrowed from Q4-1993’s 438 bp to Q4-1994’s 350 bp.

For the year following January 2007’s brief stay by a less than 10-point VIX index, a drop by the 10-year Treasury yield from January 2007’s 4.64% to January 2008’s 4.00% failed to stave off a -3.4% drop by the market value of US common stock largely because of yearlong 2007’s -7.5% contraction of pretax operating profits. A swelling by the high-yield bond spread from January 2007’s 287 bp to January 2008’s 674 bp stemmed from the worsened outlook for business activity.

VIX Index and high-yield EDF differ drastically on yield spreads

May-to-date’s average VIX index of 10.4 points favors a 312 bp midpoint for the high-yield bond spread, which is much thinner than the recent actual spread of 377 bp. Throughout much of 2016, the VIX index proved to be a reliable leading indicator of where the high-yield spread was headed. Nevertheless, if only because the VIX index now resides in the bottom percentile of its historical sample, a higher VIX index is practically inevitable. Once the VIX index approaches its mean, the high-yield spread will be much wider than the recent 377 bp. (Figure 1.)

European Commission Proposes to Include Securitisation Swaps in Margining Rules

From Moody’s.

The European Commission (EC) Proposal to Include Securitisation Swaps in Margining Rules Is Credit Negative. The EC proposes to amend the European Markets and Infrastructure Regulation and extend the definition of “financial counterparty” to securitisation issuers.

Consequently, future securitisation swaps involving either an issuer or counterparty in the European Union (EU) will be subject to rules requiring two-way collateral posting (i.e., margining). The proposal is credit negative for existing deals with swaps because margining requirements reduce the likelihood that counterparties could be replaced if their credit strength deteriorated.

The proposal, if implemented, would affect existing deals even though it is unlikely to apply retroactively. After the revised margining requirements begin, replacing a counterparty would require entering into a replacement swap with margining. In practice, an issuer is unlikely to trade with a new counterparty if it is required to exchange margin. Existing transactions are not structured to provide issuers with the necessary liquid funds or operational capability to post collateral. The issue would be that margining could expose bondholders to significant risks, including the diversion of transaction cash flows to margin calls and the risk of swap termination should the issuer default on its collateral posting obligations.

The proposal would increase swap counterparty credit risk in affected securitisations because the credit protection value of swap replacement provisions depends on the ease with which swap counterparties can be replaced. Securitisation swaps commonly incorporate transfer triggers and collateral triggers to protect against counterparty credit risk. A transfer trigger requires a counterparty whose credit strength has deteriorated to transfer the swap to a stronger counterparty. A collateral trigger requires a counterparty whose credit strength has deteriorated to post collateral so that the issuer can pay for a replacement swap in case the counterparty defaults. Both triggers are designed to increase the likelihood of counterparty replacement, but neither is effective when margining requirements deter issuers from entering into swaps with new counterparties.

The proposal’s negative credit effect is not limited to transactions with EU issuers. The EU margin rules would also apply to securitisation swaps between non-EU issuers and EU counterparties. Non-EU issuers without sufficient local replacement counterparties typically seek global counterparties, but would likely only consider counterparties that are not subject to margining under the counterparties’ own local rules. With prospective swap counterparties in the US already affected by margining requirements, the addition of equivalent rules for EU counterparties could materially reduce the likelihood of counterparty replacement for some issuers outside the EU and the US.

The proposal would also potentially subject securitisation swaps to requirements for central clearing. However, because the majority of securitisation swaps are not currently eligible for clearing because of their non-standard terms, we do not expect a central clearing requirement to have a material credit-negative effect in practice. Should securitisation swaps become more widely clearable, the proposal introduces a threshold hedging exposure that would have to be exceeded before margin rules apply.If the proposal is implemented, securitisation swaps for new transactions will also be affected and the new rules could give rise to reduced use of swaps to address hedging risk, or the use of alternative types of derivatives or structural features. If efficient structural solutions are found, they could be used to address credit challenges for future transactions.

US Inflation’s Bad Breadth May Help Contain Interest Rates

From Moody’s

Though US consumer price inflation is well contained, Fed policymakers cannot help but notice the potential threat to financial stability emanating from ongoing equity price inflation. As long as US equities become more richly priced relative to both current and prospective earnings, the Fed has more than enough reason to hike rates. A further swelling of the US equity bubble will increase Fed rate-hike risks.

Not too long ago, the high-yield bond spread swelled and the projected default rate soared. However, that intensification of credit stress would be quickly reversed mostly because debt repayment problems were largely confined to the oil and gas industry. In other words, the late 2015 and early 2016 worsening of corporate credit conditions lacked enough breadth to endanger both financial stability and the business cycle upturn.

Some still hold that inflation will come roaring back. For now, however, price inflation has been confined to housing, medical care, share prices, and industrial commodities (including energy). However, industrial commodity prices have softened of late. For example, Moody’s industrial metals price index was recently -7.2% under its latest 52-week high of November 28, 2016 and was down by a deep -31.1% from its record high of April 2011. Moreover, the price of WTI crude oil was recently off by -12.2% from its latest 52-week high of February 23, 2017.

Despite the plunge by the US unemployment rate from Q1-2012’s 8.3% to Q1-2017’s 4.7%, the accompanying annual rate of PCE price index inflation slowed from 2.5% to 2.0%. Moreover, even after excluding food and energy prices, core PCE price index inflation also decelerated from Q1-2012’s 2.1% to the 1.7% of Q1-2017.

Excluding food and energy products, the US core consumer price inflation has been skewed higher by shelter costs. For example, March’s 2.0% annual rate of core CPI inflation slowed to 1.0% after excluding a 3.5% annual jump by shelter costs that supply 42% of core CPI. And recent indications are that renters’ rent inflation may soon slow owing to an abundance of new housing units coming on line in some of the US’ largest metropolitan regions.

Today, some cite the recent climb by broad measures of price inflation as signaling the approach of significantly higher interest rates. With real GDP growth expected to sputter along in a range of 2% to 2.5% annually through 2018 how else can you explain expectations of a climb by the 10-year Treasury yield from its recent 2.35% to 3.3% by 2018’s final quarter?

Often, reference is made to a tighter labor market for the purpose of invoking a sense of danger regarding a possible imminent return of runaway price inflation. According to one highly-respected economics group, “ the U.S. economy has now reached full employment and is likely to overshoot meaningfully, a path that has often proven risky”.

Nevertheless, large numbers of labor force dropouts suggest that the unemployment rate may be overstating labor market tightness. For example, though the unemployment rate plunged by -3.6 percentage points from Q1-2012’s 8.3% to Q1-2017’s 4.7%, the ratio of payrolls to the working-age population rose by a smaller +2.2 points from Q1-2012’s 55.1% to Q1-2017’s 57.3%. Coincidentally, despite how 2005-2007 showed a much higher 59.5% ratio of payrolls to the working-age population, by no means did any overheating by the labor market prove risky.

Put simply, the Phillips Curve is not what it used to be. A lower unemployment rate now supplies less of a lift to price inflation compared to the past. In fact, sometimes consumer price inflation slows notwithstanding a substantially lower jobless rate.


Financial CHOICE Act Passage Would Be Credit Negative for US Banks

From Moody’s.

Last Wednesday, the US House of Representatives’ Financial Services Committee held a hearing on the Financial CHOICE Act of 2017, which was introduced on 19 April and aims to provide banks relief from various provisions of the Dodd-Frank Wall Street Reform and Consumer Protection Act enacted in 2010.

The proposed legislation envisions a broad reduction in regulatory and supervisory requirements that would be negative for banks’ creditworthiness, increasing the potential asset risk in the banking system and the likelihood of a disorderly unwinding of a failed systemically important bank.

Increased likelihood of a disorderly bank resolution.

Among the CHOICE Act’s most notable provisions is the repeal of Title II of Dodd-Frank, including the orderly liquidation authority (OLA) to resolve highly interconnected, systemically important banks. Although the bill calls for a new section of the bankruptcy code to accommodate the failure of large, complex financial institutions, we believe that dismantling the OLA increases the likelihood of a disorderly wind-down of a failed systemically important bank with greater losses to creditors. Additionally, although the aim of repealing Title II is to end “too big to fail,” without the enactment of a credible replacement bank resolution framework, the actual effect could be the opposite.

A credible operational resolution regime (ORR) to replace OLA would require provisions specifically intended to facilitate the orderly resolution of failed banks and would provide clarity around the effect of a bank failure on its depositors and other creditors, its branches and affiliates.

The intent of OLA is to resolve failed banks as going concerns, preserving bank franchise value so as to limit losses to bank creditors and counterparties. If, under the new legislation, failed banks are liquidated instead of being resolved as going concerns, loss rates suffered by creditors would increase.

A disorderly resolution would also have greater repercussions for the broader financial markets and the economy. This suggests that although the intent of eliminating OLA may be to reduce the likelihood of future bank bailouts, absent an ORR we believe that the likelihood of a US government bailout of a systemically important US bank could actually increase.

A return to greater risk-taking, only partly offset by improved profitability prospects. The CHOICE Act would also ease restrictions on risk-taking by eliminating the Volcker Rule and rolling back the supervisory function of the US Consumer Financial Protection Bureau (CFPB), limiting it instead to the enforcement of specific consumer protection laws. Eliminating the Volcker Rule restrictions on proprietary trading could reverse the decline in banks’ trading inventories and private equity and hedge fund investments since the financial crisis. That decline in trading inventories has contributed to a decline in risk measures such as value at risk. How far inventories rebound and proprietary trading pick up will take time to become evident, but increased risk seems likely. Changes to the CFPB could also add risk by lifting the regulatory scrutiny that has caused banks to scale back or eliminate some riskier consumer lending products (such as payday advances).

The CHOICE Act also imposes a variety of restrictions and requirements on US banking regulators that could erode the robustness of US banking regulation. More generally, weakened supervision and oversight create the potential for increased asset risk in the banking system. From a credit risk standpoint, the resulting uptick in credit costs and tail risks from increased risk-taking would outweigh the potential boost to bank profitability from reduced compliance expenses and new revenue opportunities.

Less robust capital supervision and stress-testing.

The CHOICE Act calls for a reduction in the frequency of regulatory stress testing, and an exemption from enhanced US Federal Reserve supervision, including stress-testing, for banks with a Basel III supplementary leverage ratio of at least 10%. These measures would undermine the post-crisis Dodd-Frank Act Stress Test (DFAST) and Comprehensive Capital Analysis and Review (CCAR) regimes, which have driven both an increase in capital ratios and a more conservative approach to capital management.

We believe that DFAST and CCAR have been successful tools in reducing the risk of bank failures, not only improving capital and placing beneficial restrictions on shareholder distributions but, more importantly, stimulating vast improvements in banks’ internal risk management and capital planning processes. The DFAST and CCAR results are a useful, independent and public tool to analyze banks’ stress capital resilience over time. The public disclosures from these exercises are an important data point for creditors, the market and our own stress-testing analysis, and provide a strong incentive for bank management teams to closely manage and fully resource their stress-testing and capital-planning processes.

Treasury Yields May Fall Short of Consensus Views

From Moody’s

Once again, the 10-year Treasury yield confounds the consensus. As of early April, the consensus had predicted that the benchmark 10-year Treasury would average 2.6% during 2017’s second quarter. To the contrary, the 10-year Treasury yield has averaged a much lower 2.29% thus far in the second quarter, including a recent 2.30%. Moreover, the 10-year Treasury yield has moved in a direction opposite to what otherwise might be inferred from March 14’s hiking of fed funds’ midpoint from 0.625% to 0.875%. For example, April 27’s 10-year Treasury of 2.30% was less than its 2.62% close of March 13, just prior to the latest Fed rate hike.

The latest decline by Treasury bond yields since March 14’s Fed rate hike stems from a slower than anticipated pace for business activity that has helped to rein in inflation expectations. March’s unexpectedly small addition of 98,000 workers to payrolls increases the risk of lower than expected household expenditures that could bring a quick end to the ongoing series of Fed rate hikes.

As inferred from the CME Group’s FedWatch tool, the fed funds futures contract assigns a negligible 4.3% probability to a Fed rate hike at the May 3 meeting of the FOMC. However, the likelihood of a rate hike soars to 70.6% at June 14’s FOMC meeting. Thus, do not be surprised if the policy statement of May 3’s FOMC meeting strongly hints of a June rate hike. Nevertheless, a June rate hike probably requires the return of at least 140,000 new jobs per month, on average, for April and May.

Unlike the Treasury bond market’s more sober view of business prospects since the March 14 rate hike, equities have rallied and the high-yield bond spread has narrowed. Incredibly, the VIX index sank to 10.6 on April 27, which was less than each of its prior month-long averages. The closest was the 10.8 of November 2006, or when the high-yield bond spread averaged 330 bp. Thus, if the VIX index does not climb higher over the next several weeks, the high-yield bond spread is likely to narrow from an already thin 385 bp.

Market value of common stock nears record percent of revenues

As equity market overvaluation heightens the risk of a deep drop by share prices, Treasury bonds become a more attractive insurance policy in case the equity bubble bursts. This is especially true if the next harsh equity-market correction is triggered by a contraction of profits, as opposed to an inflation-inspired jump by interest rates.

Equities are now very richly priced relative to corporate gross-value-added, where the latter aggregates the value of the final goods and services produced by corporations. Basically, gross value added nets out the value of the intermediate materials and services from which final products are produced.

The market value of US common stock now approximates 226% of the estimated gross value added of US corporations, where the latter is a proxy for corporate revenues. During the previous cycle, the ratio peaked at the 185% of Q2-2007 and then bottomed at the 103% of Q1-2009. The ratio is now the highest since the 231% of Q1-2000. Not only was the latter a record high, but it also coincided with a cycle peak for the market value of US common stock.

All else the same, the fair value of equities should decline as bond yields increase. Thus, the overvaluation implicit to Q1-2000’s atypically high ratio of the market value of common stock to corporate gross value added was compounded by Q1-2000’s relatively steep long-term Baa industrial company bond yield of 8.28%. Even if the market value of US common stock now matched Q1-2000’s 231% of corporate gross value added, Q1-2000’s equity market appears to be much more overvalued largely because the April 26, 2017 long-term Baa industrial company bond yield of 4.65% was well under the 8.28% of Q1-2000. (Figure 1.)

Consensus implicitly foresees record-long business upturn

Be it the Blue Chip or the Bloomberg survey, the consensus long-term outlook for interest rates suggests a great deal of confidence in the longevity of the current business cycle upturn. April’s consensus projects a steady climb by fed funds and the 10-year Treasury yield into 2021, by which time the forecast looks for yearlong averages of 2.88% for the fed funds’ midpoint and 3.6% for the 10-year Treasury yield.

Thus, the consensus implicitly expects that the current economic recovery (which is about to finish its eighth year in July 2017) will reach an exceptional 12th year in 2021. The implied expectation of a record long business cycle upturn is derived from the observation that each previous recession since 1979 has prompted significant declines by both fed funds and the 10-year Treasury yield. The absence of any predicted drop by the 10-year Treasury yield’s yearlong average between now and the end of 2022 is tantamount to forecasting an economic recovery of record length. (Figure 2.)

The current record-holder among economic recoveries is the upturn of April 1991 through February 2001 that lasted about 9.75 years. In a distant second place is the upturn of December 1982 through June 1990 that covered roughly 7.5 years. If the consensus proves correct about the duration of the ongoing upturn, a seemingly overvalued equity market is far from exhausting its upside potential.

Long-term outlook on profits requires low long-term bond yields

The consensus also maintains positive views on the near- and long-term outlook for pretax profits from current production. April’s Blue Chip consensus not only expects pretax operating profits to grow by 4.9% in 2017 and by 4.2% in 2018, but March’s long-term outlook projected profits growth in each of the five-years-ended 2023 of 4.0% annually, on average. The realization of seven consecutive years of profits growth requires the avoidance of a possibly disruptive climb by interest rates. Thus, the 10-year Treasury might well have difficulty spending much time above 3%, if, as expected, corporate gross value added’s average annual growth rate is less than 4%. (Figure 3.)

Housing affordability is worsening, warns ratings agency

From Mortgage Professional Australia.

Moody’s report shows regulatory crackdowns and low-interest rates will not protect affordability, putting pressure on Government to take action in the Budget

Housing affordability is deteriorating in Australia despite the impact of regulatory crackdowns and low interest rates, a report by international ratings agency Moody investors Service has found.

Affordability worsened in the year to March 2017, with interest repayments requiring for 27.9% of household income on average, compared with 27.6% in March 2016. Affordability declined steeply in Sydney, Melbourne and Adelaide, according to the report, although it improved in Brisbane and Perth, which is currently the most affordable city in Australia, with the proportion of income going to repayments at 19.9%.

Moody’s expect that housing affordability will continue to deteriorate, blaming “rising housing prices, which outstripped the positive effects of lower interest rates and moderate income growth”. Whilst APRA’s restrictions on interest-only mortgage lending could dampen demand for apartments they could also reduce affordability, Moody’s claims: “the new regulatory measures have prompted some lenders to raise interest rates on interest-only and housing investment loans, which will make such loans less affordable.”

Proportion of joint-income required to meet interest repayments, March 2016:

  • Sydney 37.5%
  • Melbourne 30.3%
  • Brisbane 23.9%
  • Adelaide 23%
  • Perth 19.9%
  • Australia: 27.9%

Coming just weeks ahead of the 2017-18 Federal Budget, Moody’s report indicates the Government cannot rely on regulators and the RBA if it wants to improve affordability. In March Treasurer Scott Morrison said repayment affordability would play a major part in the Budget and was a bigger issue then the difficulty of first home buyers, whilst ruling out any changes to negative gearing.

In a series of sensitivity tests, Moody’s demonstrated the risks faced by Australian homeowners. Looking at the effect of house prices continuing to rise, income decreasing and interest rates increasing, Moody’s found Sydney homeowners were particularly vulnerable. A 10% rise in property values – far from unknown in the harbour city – meant an extra 3.8% of income needed to meet mortgage repayments.

Moody’s report did find that affordability was unchanged for apartments. Apartment owners spent an average of 24.5% of their income on repayments, compared to 29.3% for house owners. This is a national average: affordability of apartments did decline in Sydney and Melbourne.

House price falls would lead to ‘sharp’ slowdown

From InvestorDaily.

The relatively high leverage of Australian households would lead to a dramatic slowdown in growth in the event of housing market crisis, says Moody’s Investors Service.

Moody’s Investors Service found that “rapid increases” in house prices had been accompanied by higher leverage, and started from levels which were higher than those experienced by countries such as Spain and the US “even at the peaks of their respective housing market cycle”.

“Higher household debt levels increase the risk of consumer retrenchment in an adverse scenario and imply higher likelihood of stress in the banking system, all else equal,” the company said.

Household leverage relative to a household’s liquid assets is also particularly high when retirement assets are excluded, Moody’s said, and is even at a level “comparable to that observed in Ireland on the eve of its housing market crisis”.

“Including retirement assets brings the ratio down to levels comparable to Canada’s, but the illiquid nature of these assets limits the buffer role,” the research house said.

Moody’s said that while there are a number of superannuation clauses that would permit members to access these funds “in case of heightened financial pressure”, these would apply only to severe cases and might not help in the event of adverse conditions causing a ‘retrenchment’ in consumption.

“Moreover, having drawn on their superannuation funds, Australian households would likely attempt to rebuild them as soon as possible, which would weigh on consumption,” the company said.

Credit Cycle Enjoys a Respite

From Moody’s

For the first time since 1987-1988, the US credit cycle has stabilized following a surge by credit rating downgrades relative to upgrades, a jump by the high-yield default rate, and a pronounced widening by corporate bond yield spreads. After six years at 49% of US high-yield credit rating revisions from July 2009 through June 2015, downgrades soared to 71% in the year-ended June 2016. Then downgrades eased to 58% for the year-ended March 2017 and sank to 48% during Q1-2017.

The much reduced relative incidence of downgrades was joined by a drop for the forward-looking high-yield EDF (expected default frequency metric from February 2016’s current recovery high of 8.1% to a recent 3.7% and a narrowing by the high-yield bond spread from February 2016’s nearly eight-year high of 839 bp to a recent 412 bp. In addition, after peaking at January 2017’s 5.9%, the US high-yield default rate has eased to March’s 4.7% and is projected to average 3.1% during 2017’s final quarter.

Market expects profits to again outpace corporate debt

The deterioration of high-yield credit rating revisions comparing the six years ended June 2015 with the year ended June 2016 was linked to a dramatically different performance by nonfinancial-corporate profits from current production. After having advanced by 9.8% annually, on average, during the six years ended June 2015, profits from current production contracted by -9.2% annually during the year ended June 2016. The loss of financial flexibility to the shrinkage of profits was made worse by an acceleration of nonfinancial-corporate debt from the 2.5% average annualized rise of the six-years-ended June 2015 to the 6.8% year-over-year increase of the following 12 months. (Figure 1.)

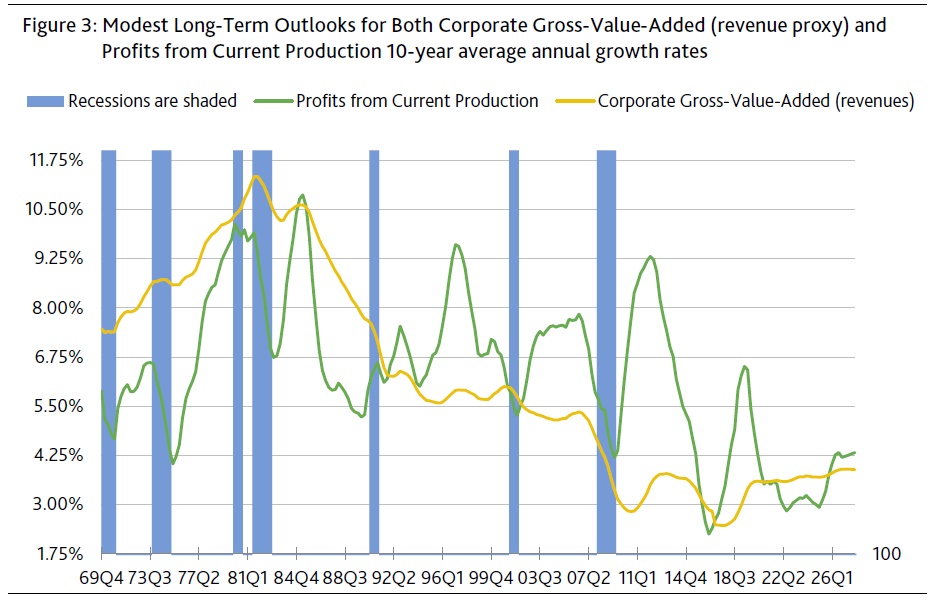
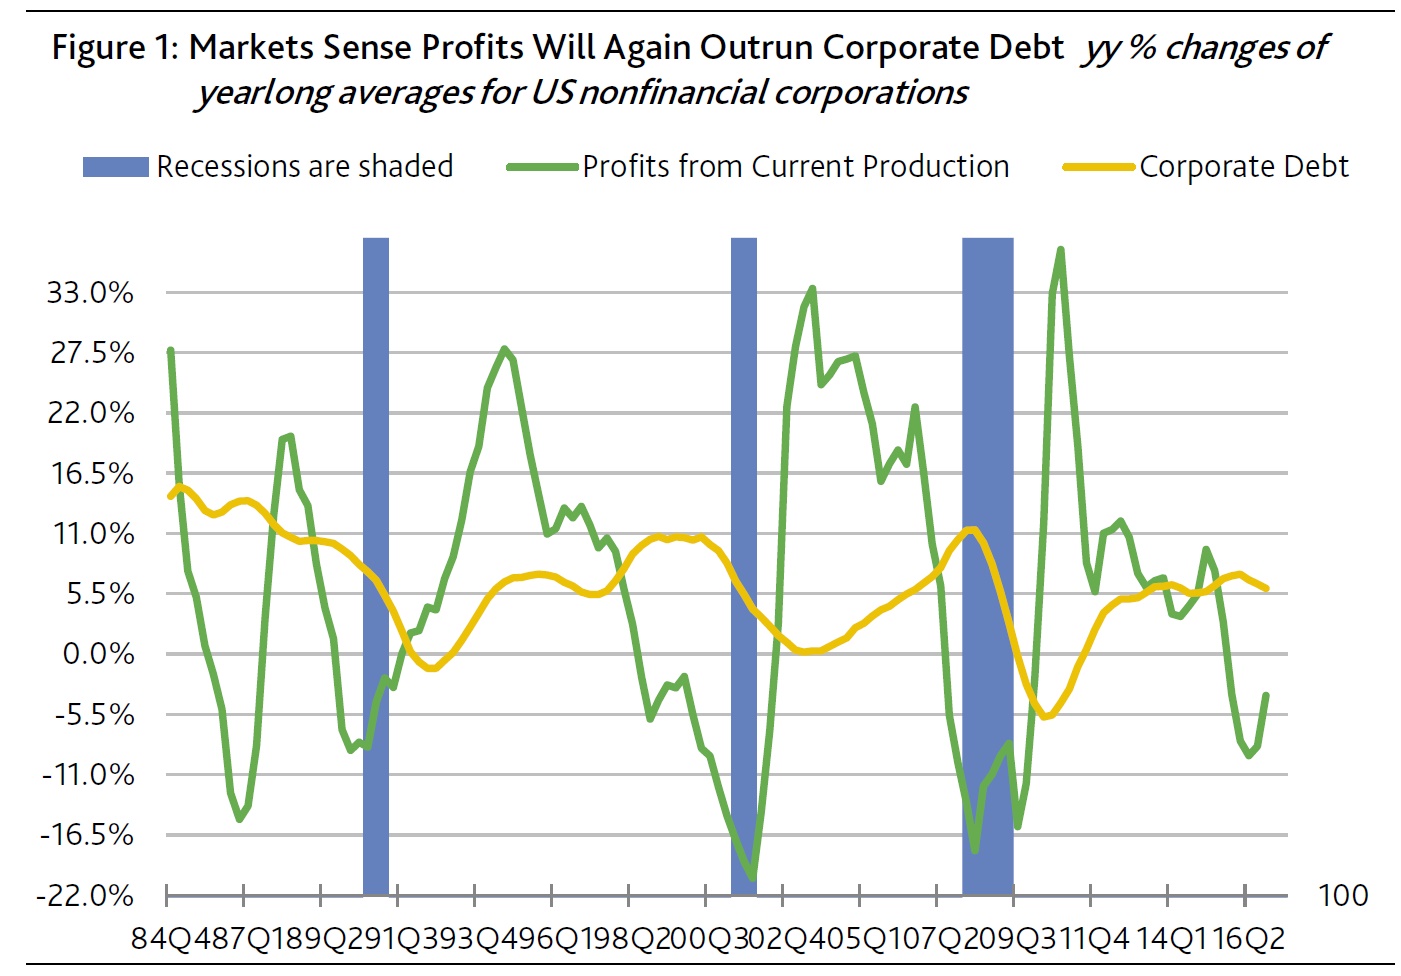
Few broad-based trends weaken corporate credit quality more than the simultaneous contraction of earnings and expansion of debt. To the contrary, the faster growth of profits vis-a-vis debt typically lessens default risk significantly.

Fourth-quarter 2016 showed a narrowing of debt’s faster expansion vis-a-vis profits. For the first time since Q1-2015’s year-to-year increase of 12.0%, Q1-2017’s profits from current production managed to grow from a year earlier by 3.0%. Previously, this measure of profits had contracted annually in each of the six quarters ended Q3-2016 by -7.0%, on average, which had been joined by an accompanying 6.8% average yearly increase for corporate debt. Though Q4-2016’s 5.2% annual increase by corporate debt still outran profits’ 3.0% rise, at least it occurred in the context of profits growth, as well as slowing noticeably from when profits shrank.

Credit often gets pummeled when profits shrink while debt grows

The last two times a year-long contraction by profits was accompanied by an acceleration of corporate debt, the imbalance eventually inflicted heavy damage on corporate credit. The two earlier episodes commenced in Q2-2007 and Q1-1998.

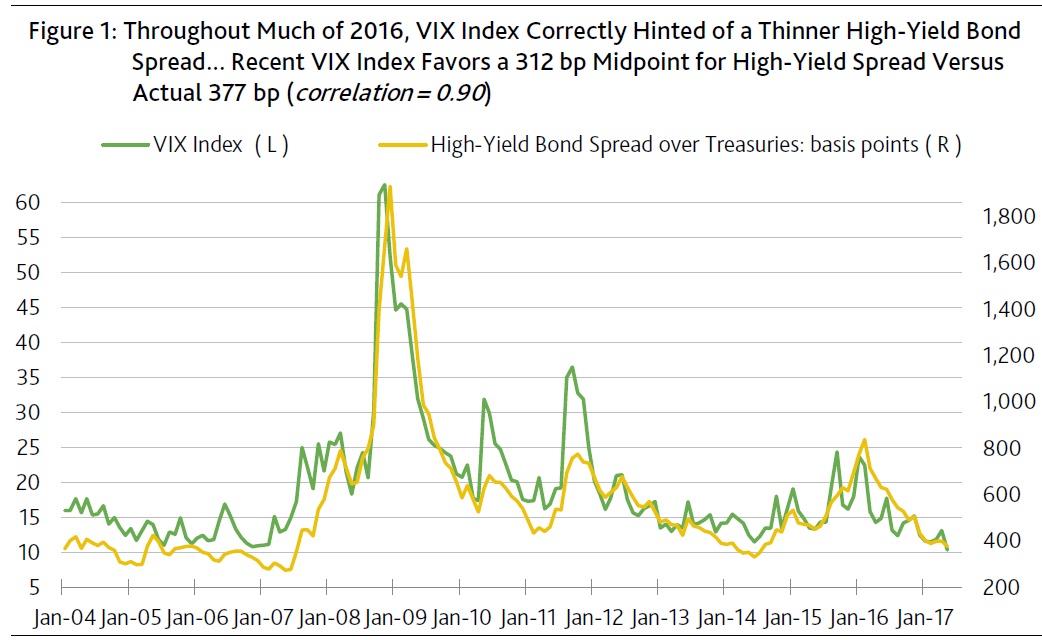
Ultimately, corporate bond yield spreads ballooned and the high-yield default rate climbed sharply higher. The high-yield bond spread swelled from the 283 bp of Q2-2007 and the 338 bp of Q1-1998 to cycle highs of 1,678 bp for Q4-2008 and 971 bp for Q4-2002. In addition, the default rate soared from Q2-2007’s 1.5% and Q1-1998’s 2.5% to cycle highs of 14.5% for Q4-2009 and 10.9% for Q1-2002.

Credit survived mid-1980s drop by profits amid rapid debt growth

However, when corporate debt’s moving year-long average outran comparably measured profits beginning with Q2-1985 and ending in Q3-1987, both spread widening and the climb by the default rate were much more limited compared to 2007 and 1998. Better yet, unlike 1998 and 2007, 1986’s simultaneous contraction of profits and expansion of debt did not eventually lead to a recession.

Markets now sense that the 2015-2016 bout of brisk debt growth amid shrinking profits will mimic what transpired in the mid-1980s and, thus, will be succeeded by a profits recovery that outpaces corporate debt. That is exactly what occurred from Q4-1987 through Q4-1988, when profits’ 15.0% annualized advance well outran the still lively 10.3% annualized growth of corporate debt.

Nevertheless, the 1987-1988 reprieve was short lived. By year-long 1989, the unfavorable imbalance returned, as profits contracted by -6.9% annually while corporate debt grew by +9.6%.

The experience of the mid- to late-1980s warns against becoming too optimistic if, as the market implicitly expects, profits again outrun debt by late 2017. By itself, the current upturn’s maturity suggests that pent-up demand has been mostly depleted. For example, despite the most attractive auto sales incentives since 2009, unit sales of light motor vehicles fell from a year earlier in 2017’s first quarter. Elsewhere, a growing number of retail chains struggle with lower than expected sales.

The pace of home sales during housing’s peak selling season of March through June will provide critical insight regarding the health of domestic expenditures. If home sales unexpectedly stall, profits may be incapable of outpacing corporate debt, which would widen spreads significantly and worsen the now benign outlook for defaults. Comparably to what transpired in the 1980s, corporate credit’s current reprieve may not last much longer than a year. And that would be especially true if short- and long-term interest rates rose to heights that are too burdensome for financial markets and business activity.

High-yield downgrades eclipse upgrades when focusing on fundamentals
The US high-yield credit rating revisions of 2017’s first quarter showed the most upgrades relative to downgrades since 2014’s third quarter. A preliminary count revealed 89 upgrades and 83 downgrades. However, the accompanying revisions of investment-grade ratings showed three more downgrades (17) than upgrades (14).

It is important to note that not all rating revisions are the consequence of changed fundamentals. For example, some rating revisions stem from changes in creditor protection owing to the issuance of new debt. Other revisions not viewed as fundamentally driven include stand-alone special-events such as mergers, acquisitions, divestitures, equity buybacks, special dividends, and infusions of common equity capital.

Whenever fundamentals and special events simultaneously trigger a rating revision, the rating change is tallied as driven by fundamentals. Only when the influence of fundamentals is viewed as negligible is the revision deemed to be for some other reason.

Recognizing the impossibility of establishing unequivocally that a rating change was due only to fundamentals, fundamentals appear to have been responsible for 54 of Q1-2017’s high-yield upgrades and 59 of the high-yield downgrades. Thus, when considering only rating changes caused by fundamental drivers, Q1-2017 was home to more high-yield downgrades than upgrades.

The first-quarter 2017 upgrade share of high-yield credit rating changes fell from 52% to 48% after limiting the sample to fundamentally-driven revisions. Fundamentals last figured in more high-yield upgrades than downgrades in 2014’s third quarter, or when non-financial corporations posted lively year-to-year advances of 5.8% for gross-value-added and 11.3% for profits from current production, as the high-yield spread averaged a thin 376 bp.

Comparable revenue and earnings results for 2017’s first quarter are not yet available, though the consensus looks for implied year-long 2017 gains of 4.3% for gross-value-added and 5.0% for pretax operating profits. First-quarter 2017’s high-yield bond spread of 397 bp was much thinner than the 477 bp of Q4-2016, or when upgrades’ share of high-yield rating changes fell from 32% overall to just 27% when limited to fundamentals.

A switch to the opposite direction held for investment-grade revisions, too, where the 11 upgrades led the eight downgrades when limiting the sample to fundamentally driven rating changes. Mergers and acquisitions (M&A) figured in nine of the 17 investment-grade downgrades, but entered into fewer three of the group’s 14 upgrades.

No longer do the problems of the oil & gas industry skew the number of downgrades higher. In Q1-2017, the oil & gas industry figured in 12 upgrades and 12 downgrades — 11 apiece for high-yield and one each for investment grade. Ample liquidity and firmer energy prices account for why the frequency of oil & gas-related high-yield rating revisions improved from the per quarter averages of four upgrades and 57 downgrades from the year-ended June 2016.

Recent high-yield spread implies the market expects more upgrades than downgrades

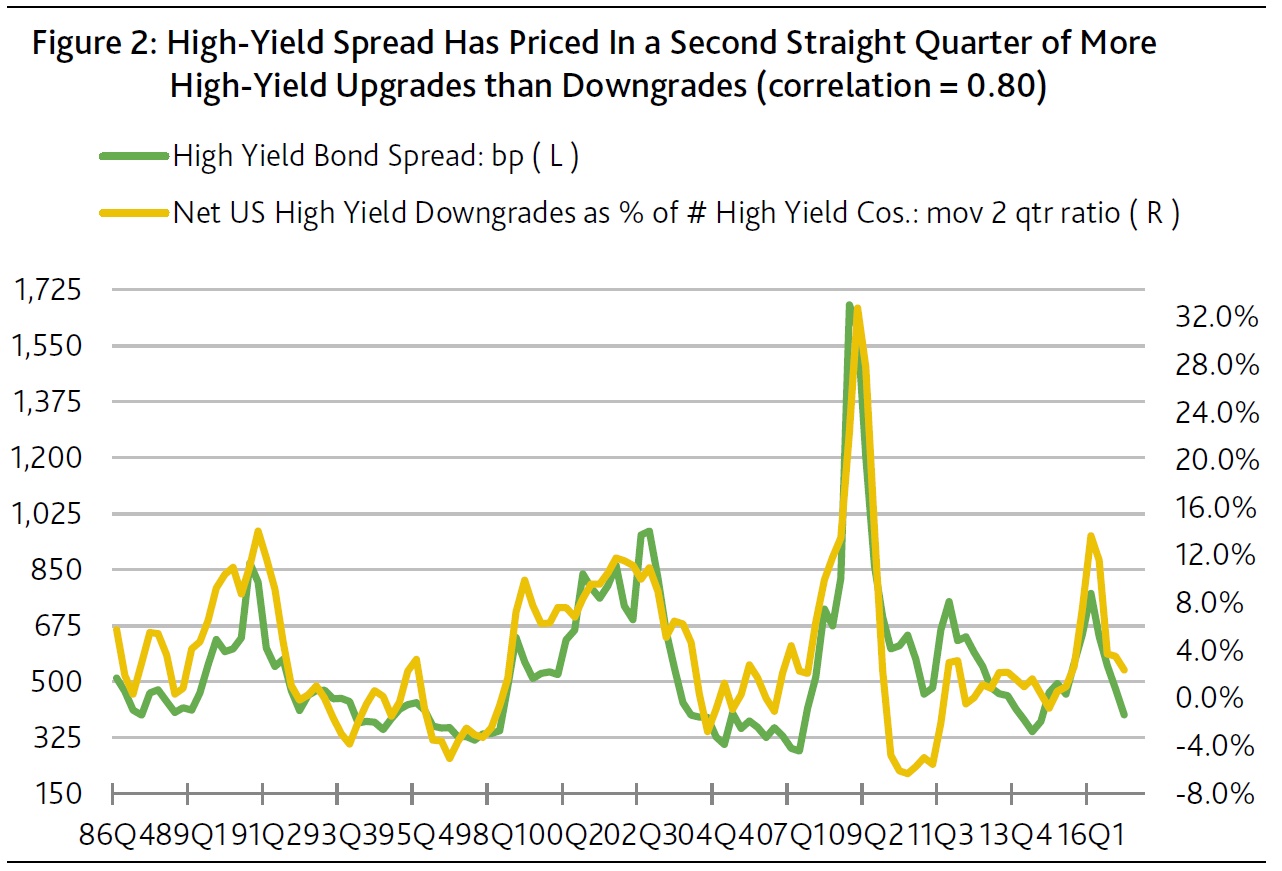
As derived from a sample that commences with 1986’s final quarter, the quarter-long average of the US high-yield bond spread generates a relatively strong correlation of 0.80 with the moving two-quarter ratio of net high-yield downgrades as a percent of the number of high-yield issuers. Net high-yield downgrades, or the difference between the number of downgrades less upgrades, fell from Q4-2016’s +53 to Q1-2017’s -6. In turn, the moving two-quarter ratio of net high-yield downgrades dipped from Q4-2016’s 3.6% to Q1-2017’s 2.4% of the number of high-yield issuers.

The narrowing of the high-yield bond spread from the 551 bp of Q4-2016 to Q1-2017’s 477 bp was qualitatively consistent with the accompanying drop by the relative incidence of net downgrades. First-quarter 2017’s moving two-quarter net downgrade ratio was the lowest since the 1.0% of 2015’s second quarter, or when the high-yield spread averaged 462 bp. When the net downgrade ratio last peaked at Q1-2016’s 13.7%, the high-yield spread averaged a very wide 776 bp. (Figure 2.)

If high-yield downgrades equal upgrades over a two-quarter span, the long-term statistical relationship predicts a midpoint of 436 bp for the high-yield bond spread. Thus, the recent high-yield spread of 412 bp implicitly expects that upgrades will outnumber downgrades for a second straight quarter in Q2-2017.