Bank of England’s Plans To Accelerate Digital Disruption

On 20 June, the Bank of England announced plans to facilitate the UK economy’s adoption of new technology through a more open financial infrastructure, via Moody’s. Although many of these plans would ultimately enable faster adoption of new technology with broader and cheaper access to financial services, they would likely be an overall credit negative for incumbent banks, which generate profits thanks in part to high barriers to entry and privileged access to data.

The Bank of England’s announcements include a variety of proposals including better infrastructure to improve payments, easier access to finance for small and midsize enterprises (SMEs), smoothing the transition to a lower-carbon economy, reducing the regulatory burden on the financial industry, and facilitating the adoption of cloud-based technologies to increase operational resilience.

Some of these initiatives will directly benefit incumbent banks. The introduction of a climate stress test will help banks reposition their credit portfolios in anticipation of the transition to a less carbon-intensive economy and thus avoid the credit risk in so-called stranded assets. The Bank of England will also explore ways of using machine learning and artificial intelligence to reduce the need for regulated financial firms to supply it with large amounts of data and to automate part of its own analytical work. These efforts should reduce regulatory costs for banks. And, a new policy on the use by banks of cloud technology and the automation of more post-trade processes will help firms adopt a cheaper and more robust infrastructure.

However, these benefits for banks are likely to be outweighed by the effect of proposals to further open up financial services provision in the UK and reduce barriers to entry.

In the payments system, the Bank of England notes that while payments via card systems are convenient for customers, these processes entail friction and inertia that result in costs for the real economy. For example, fees can consume between 0.5% and 2% per transaction, while the eventual transfer of funds between buyer and seller can take several days to complete (with fees and delays being typically greater for international transactions). In response, the UK government announced a review of payments systems, which will likely lead to further initiatives to further boost the ability of providers of newer and cheaper forms of direct payment to access the
wider market.

For its part, the Bank of England will continue to open up its real time gross settlement payment system to non-bank payment service providers. The central bank will also consult on whether to allow more firms beyond a small group of systemically important banks to access its balance sheet. Such moves, while apparently cautious at this stage, will intensify competition and lead to further margin pressure on incumbent UK banks. In addition, the Bank of England will explore ways to support new digital currencies such as that announced by Facebook, which are also likely to disintermediate established banks.

Meanwhile, the central bank will also promote greater competition in SME financing. Currently, the vast majority of SME lending in the UK is conducted through the largest four banking groups, and new entrants face significant barriers to entry, typically lacking the customer account data which helps banks make their credit decisions. The Bank of England suggests further promoting the existing principles of “open banking,” which allows customers to take control of their data and share them securely with alternative providers, helping SMEs create a “portable credit file.” Doing so would aim to reduce barriers to entry and stimulate competition, thus adding to margin pressure on banks.

Since the open banking initiative began in early 2018, there has been little effect on market shares in retail banking in the UK. But over time, the above measures mean that incumbent banks would likely experience margin declines in some of their traditionally more profitable activities of commercial lending.

Credit resurgence could have ‘undesirable’ impact

The fall in interest rates and an easing of lending standards will “breathe life” into the property market, but not without consequences, according to Moody’s Analytics, via The Adviser.

Financial intelligence agency Moody’s Analytics has released its Second Quarter 2019 Housing Forecast Report, in which it has noted its outlook for the Australian housing market.

Drawing on CoreLogic’s Hedonic Home Value Index, the research agency noted the correction in residential property prices, which it said was “a long time coming” after a “strong run-up” in values across more densely populated markets, particularly in Sydney and Melbourne.

However, Moody’s has observed that while residential home prices have moderated from their peak in September 2017, the decline has not led to a “material” improvement in housing affordability, with values still 20 per cent higher than during the pre-boom period in 2013.

Nonetheless, Moody’s has reported that it expects the Reserve Bank of Australia’s (RBA) cut to the official cash rate and proposals to ease home loan serviceability guidelines from the Australian Prudential Regulation Authority (APRA) to rekindle demand for credit and spark activity in the housing market.

“An important driver of the slowdown in Australia’s housing market has been tighter credit availability, partly as a consequence of the regulator – the Australian Prudential Regulation Authority – tightening lending conditions, which has made it relatively more difficult to purchase a property, particularly for investors,” Moody’s noted.

“These serviceability requirements were eased in May.

“Expectations of further lending reductions flowing on from RBA cash rate reductions will also breathe life into the property market and add weight to our view that the national housing market will reach a trough in the third quarter of 2019 and gradually improve thereafter.”

However, Moody’s warned that a resurgence in the housing market activity could further expose the economy to risks associated with high levels of household debt.

“This could see the household leverage-to-GDP ratio climb, making Australia stand out further amongst its peers,” Moody’s stated.

“This is an undesirable position to be in, particularly given the questions around sustainability of the potentially rising debt load.”

Moreover, recent changes in the regulatory landscape have been interpreted by some observers as as a sign that the economy could be at risk of falling into recession amid growing internal and external headwinds.

Treasurer Josh Frydenberg recently acknowledged that “international challenges” could pose a threat to the domestic economy.

Fears of a looming recession have prompted some observers, including the CEO of neobank Xinja, Eric Wilson, to encourage borrowers to pocket mortgage rate cuts passed on following the RBA’s decision to lower the cash rate.

Mr Wilson claimed that resisting the urge to accrue more debt would help borrowers build a buffer against downside risks in the economy.

The Australian Bureau of Statistics’ (ABS) Australian National Accounts data for the quarter ending March 2019, reported GDP growth of 0.4 per cent, with annual growth slowing to 1.8 per cent – the weakest since September 2009.

However, Moody’s economist Katrina Ell has said she expects the RBA’s monetary policy agenda to help revive the economy.

“The combination of increased monetary policy stimulus, expectations of the housing market reaching a trough in the third quarter of 2019, and fiscal policy playing a relatively supportive role including via income tax cuts should boost GDP growth to 2.8 per cent in 2020,” Ms Ell said.

18 US Banks pass Federal Reserve stress test

On 21 June, the US Federal Reserve (Fed) published the results of the 2019 Dodd-Frank Act stress test (DFAST) for 18 of the largest US banking groups, all of which exceeded the required minimum capital and leverage ratios under the Fed’s severely adverse stress scenario; via Moodys’.

These results are credit positive for the banks because they show that the firms are able to withstand severe stress while continuing to lend to the economy. In addition, most firms achieved a wider capital buffer above the required minimum than in last year’s test, indicating a higher degree of resilience to stress. The 2019 results support our view of the sector’s good capitalization and benefit banks’ creditors.

The median stressed capital buffer above the required Common Equity Tier 1 (CET1) ratio increased to 5.1% from 3.5% last year, a substantial change. However, the 18 firms participating in 2019 were far fewer than the 35 that participated in 2018, helping lift the results this year. This is because passage of the Economic Growth, Regulatory Relief, and Consumer Protection Act in May 2018 resulted in an extension of the stress test cycle to two years for 17 large and non-complex US bank holding companies, generally those with $100-$250 billion of consolidated assets, which pose less systemic risk.

This is the fifth consecutive year that all tested firms exceeded the Fed test’s minimum CET1 capital requirement. As in prior years, the banks’ Tier 1 leverage and supplementary leverage ratios had the slimmest buffers of 2.8% and 2.4%, respectively, above the required minimums as measured by the aggregate.

Under DFAST, the Fed applies three scenarios – baseline, adverse and severely adverse – which provide a forward-looking assessment of capital sufficiency using standard assumptions across all firms. The Fed uses a standardized set of capital action assumptions, including common dividend payments at the same rate as the previous year and no share repurchases. In this report, we focus on the severely adverse scenario, which is characterized by a severe global recession accompanied by a period of heightened stress in commercial real estate markets and corporate debt markets.

This year’s severely adverse scenario incorporates a more pronounced economic recession and a greater increase in US unemployment than the 2018 scenario. The 2019 test assumes an 8% peak-to-trough decline in US real gross domestic product compared with 7.5% last year and a peak unemployment rate of 10% that, although the same as last year, equates to a greater shock because the starting point is now lower (the rise to peak is now 6.2% compared with 5.9% last year).

The severely adverse scenario also includes some assumptions that are milder than last year: housing prices drop 25% and commercial real estate prices drop 35%, compared with 30% and 40% last year; equity prices drop 50% compared with 65% last year; and the peak investment grade credit spread is 550 basis points (bp), down from 575 bp last year. We consider this exercise a robust health check of these banks’ capital resilience.

Finally, the three-month and 10-year Treasury yields both fall in this year’s severely adverse scenario, resulting in a mild steepening of the yield curve because the 10-year yield falls by less. As a result banks’ net interest income faces greater stress than in last year’s scenario, which assumed unchanged treasury yields and a much steeper yield curve.

Increased funding of European deposit guarantee schemes announced

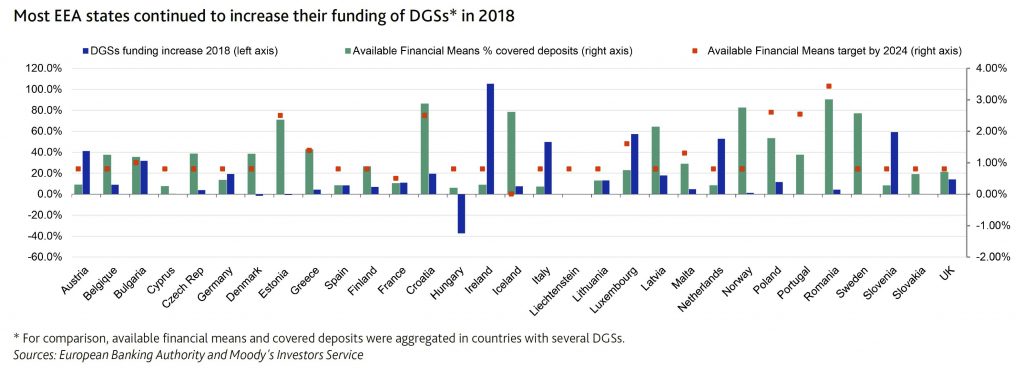
On 17 June, the European Banking Authority (EBA), published 2018 data on national Deposit Guarantee Schemes (DGSs) across the European Economic Area (EEA), which show that 32 of 43 DGSs increased their funds available to cover deposits in 2018 by levying banks.

Here of course the $250k deposit scheme is unfunded and currently inactive.

Moody’s says that the target of 0.8% of covered deposits by 2024 set out in the Deposit Guarantee Schemes Directive (DGSD) has already been achieved in 17 of the 43 DGSs in the EEA. The gradually increasing harmonisation of DGSs in Europe is credit positive for European banks because it improves European banking systems’ financial stability by better protecting depositors against the consequences of credit institution insolvency. As DGS funding increases and exceeds the 0.8% threshold, they also expect banks’ levies to moderate, which will benefit their profitability.

Since the 2009 financial crisis, European authorities developed policies and tools to buttress financial systems’ resiliency and help authorities prevent and, if needed, tackle bank distress without having to resort to taxpayers’ support. DGSs form one of these tools.

Under current EU legislation, depositors are protected by their national DGS up to €100,000 (or the equivalent in local currency). This protection applies regardless of whether ex ante funding has been accrued by DGS. Under the DGSD, all EEA banks are required to contribute to national DGSs so that at least 0.8% of covered deposits are funded by 2024 (and by exception, no less than 0.5% of the covered deposits, like in France2).

Nine member states have set up DGSs with higher funding targets such as Romania (3.43%) and Poland (2.6%). Some countries, such as Iceland, have not yet defined their national funding target, while others have defined numerous DGSs for different categories of banks and depositors, as in Germany for private, public, savings or cooperative banks, hence there are more DGS than there are EU countries.

As of year-end 2018, 16 countries had already reached the DGSD’s 0.8% minimum funding ratio for 2024, and 10 countries exceeded their national target. The levies banks paid increased by around 12% in 2018, while covered deposits grew only by 3.6%. As of year-end 2018, EEA member states had reached in aggregate a funding ratio of 0.65% of covered deposits, up from 0.6% in 2017.

Out of the 31 banking systems addressed in the EBA report, 25 increased the funding for the DGSs in 2018, with very large increases in Ireland (+105.2%), Slovenia (+59.2%) or Luxembourg (+57.3%). The diversity in funding efforts reflects different starting points since some countries did not have DGS or limited ex-ante funding when the DGSD was adopted. For instance Luxembourg had no funding in 2015 and a target of 1.6% of covered deposits.

Despite progress, the third pillar of the banking union – the European deposit insurance scheme (EDIS) proposal adopted in 2015 – is not yet in sight due to a lack of political consensus. The EDIS proposal builds on the system of national DGSs and would provide a stronger and more uniform degree of insurance cover in the euro area. This framework would reduce the vulnerability of national DGSs to large local shocks.

Canada’s Soft Home Price Landing?

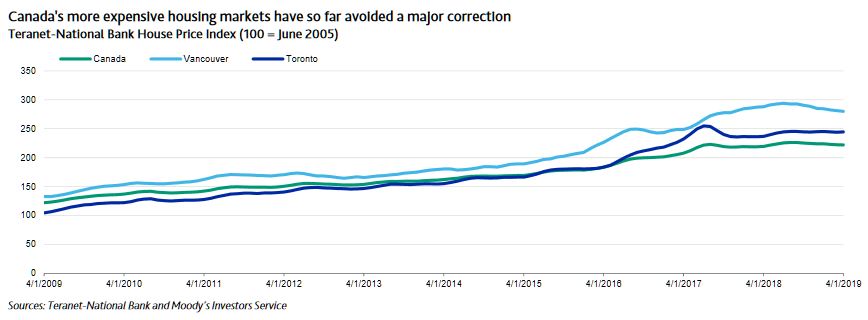
On 14 June, the Canadian Real Estate Association (CREA) reported that May home sales rose 1.9% nationally from April, says Moody’s. The report confirms other recent data suggesting that macro-prudential measures the Canadian government has taken to cool extreme houseprice appreciation over the past five years have been successful in engineering a “soft landing,” easing market concerns that some of the country’s more expensive markets such as Toronto and Vancouver were poised for a major correction. CREA now predicts home sales nationally will rise a sustainable 1.2% in 2019, a reversal from a previous forecast for a drop of 1.6%.

Reducing elevated house-price growth without triggering a severe correction in housing markets supports financial stability in Canada’s
banking system and reduces the prospect of rapid consumer deleveraging, which would pressure Canadian bank asset quality. Although Canadian banks’ mortgage portfolios are relatively resilient, unsecured consumer exposures would generate substantial incremental loan losses under the stress of a major housing price correction. This would pressure profitability at the Canadian domestic systemically

important banks (D-SIBs) and be detrimental to their strong credit profiles. The D-SIBs are Bank of Montreal, Bank of Nova Scotia, Canadian Imperial Bank of Commerce, Royal Bank of Canada, The Toronto-Dominion Bank and National Bank of Canada. Rising house prices in the major urban areas of Toronto and Vancouver have been the main driver of the growth in Canadian residential mortgage debt to almost CAD1.9 trillion (about 95% of GDP) as of 31 March 2019. Roughly 50% of domestic banking assets are
residential mortgages. Positively, about 85% of Canadian mortgage debt is in disciplined amortizing structures, which are lower risk than interest-only home equity lines of credit (HELOCs).

Policy decisions by the national and several provincial governments, including the tightening of mortgage eligibility requirements, have stabilized prices somewhat in recent quarters. We expect a more sustainable growth rate in housing prices over the next year, as supported by the CREA announcement.

A significant number of Canadian mortgages are explicitly backstopped by the Canadian government through Canada Mortgage and Housing Corporation (CMHC, Aaa stable) insurance, and the loans’ historical credit quality is high. However, federal initiatives to reduce the government’s exposure to housing risk have reduced the proportion of insured mortgages to about 33% at 31 March 2019 from 47% at 31 March 2014.

Structural features of the Canadian mortgage market also buffer banks against the effects of a housing shock: mortgage loans are full recourse, securitization and broker origination levels are low, payments are not tax-deductible and the level of subprime loans is low.

Banks are not invulnerable to losses on mortgages in a stress scenario, but losses would be moderate relative to strong capitalization and earnings. The non-mortgage consumer loans of Canadian banks are relatively more prone to rapid deterioration in the event of an economic shock, especially given high household indebtedness. These exposures also have higher expected loss given defaults than real estate secured debt. We expect increased provisions for credit losses on consumer portfolios over the next year, starting from a low base, with the potential for more significant asset quality deterioration in the event of an economic shock. Evidence of a moderation in housing price growth rates reduces the prospect of this risk.

JPMorgan’s digital banking “failure” is credit positive

On 6 June, JPMorgan Chase & Co. announced that it would shut down Finn, its digital consumer banking brand focused on attracting younger customers, via Moody’s.

At first glance, some might consider the decision to shut down the offering as a setback, however it also demonstrates JPM’s superior ability compared to many peers to experiment and invest aggressively in technology while maintaining robust profitability. A customer-centric approach to innovation is essential for incumbent firms to react to the offerings of financial technology (fintech) challengers.

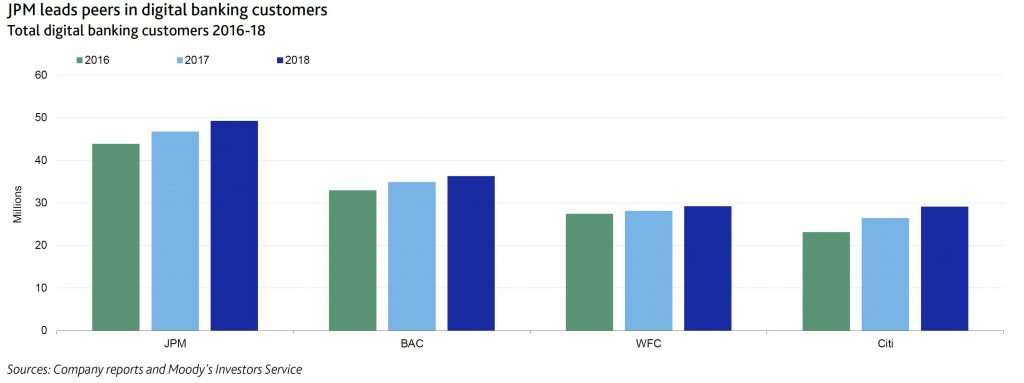
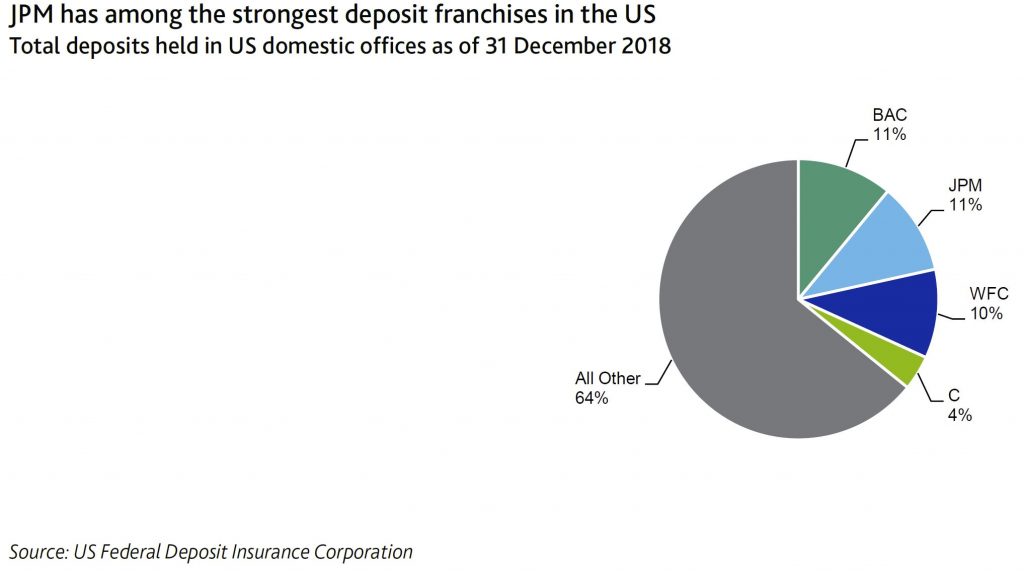
Finn gave users access to an app, branded separately from JPM’s flagship Chase mobile app but running on the same back-end infrastructure, along with various perks, including JPM branch access for more complex banking services and use of the ATMs of partner banks. But more than half of Finn’s users had existing relationships with JPM, which may have influenced the decision to re-focus on the Chase digital banking brand. JPM leads peers in digital banking customers and possesses among the strongest US consumer deposit franchises.

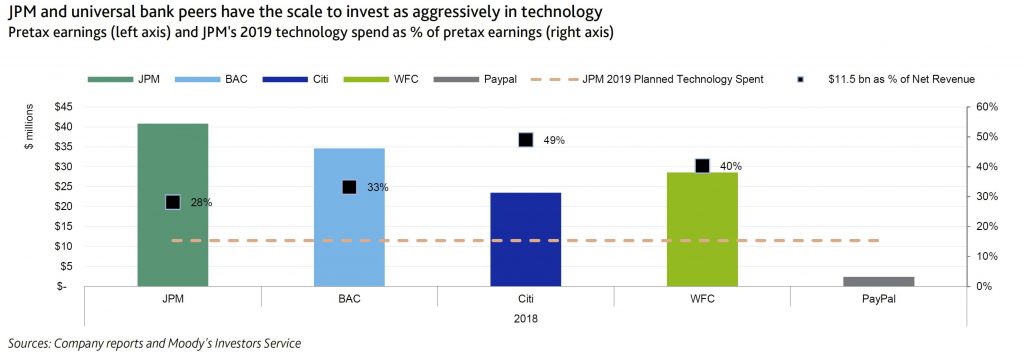
Earlier this year, JPM during its annual investor day announced plans to make $11.5 billion in technology investments in 2019 – a sum equivalent to 28% of its 2018 pre-tax earnings, a credit positive. Only a few of JPM’s large consumer banking peers possess the scale to make such a commitment. These technology investments are important for JPM as it faces a growing number of fintech challengers along various points of the consumer and wholesale banking value chain. JPM noted that these investments would go
toward various initiatives, including developing new products, enhancing client choice, personalization and ease of doing business, and business efficiency.

Germany Increases Banks’ Countercyclical Buffer

On 27 May, Germany’s bank supervisor Bundesamt für Finanzdienstleistungsaufsicht (BaFin) published a recommendation of the
national financial stability committee that would require banks to hold an additional 0.25% capital cushion against their domestic riskweighted
assets (RWAs). At the same time, BaFin indicated its intention to follow this recommendation, which would become binding after a 12-month transition period on 1 July 2020. Via Moody’s.

The announcement is credit positive for German banks because it will encourage those with tighter capital cushions to set aside additional funds for risks that could surface in the case of changes to the current macroeconomic environment, foremost those related to a potential underestimation of future credit risks in a cyclical downturn, risks to collateral values in residential mortgage lending or risks related to the future interest rates trajectory.

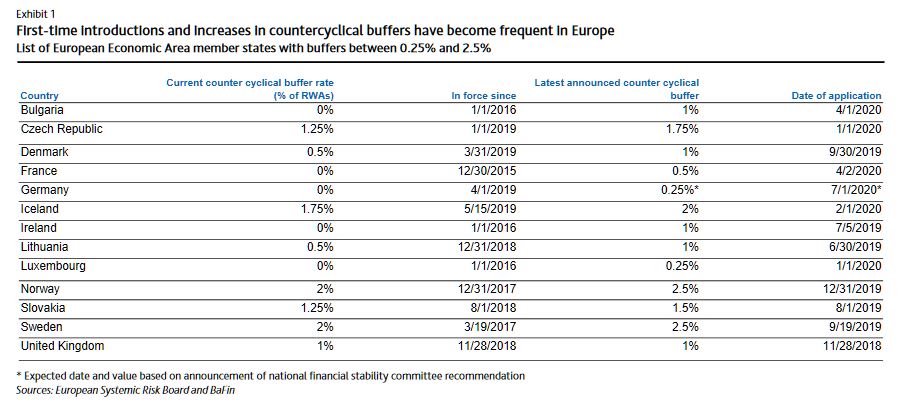
Germany is the 13th country in the European Economic Area to introduce a countercyclical capital buffer, and in most fellow member states the first step introduction has been followed by at least one increase later. Exhibit 1 provides an overview of initial and current countercyclical buffer (CCyB) requirements.

Germany’s 0.25% proposal will apply to German exposures of all European Economic Area banks and it remains very close to the bottom of the range compared with Norway and Sweden, whose CCyBs will reach the maximum of 2.5% later this year. Even so, we believe BaFin’s moderate first step and its ability to increase the requirement will lead German banks to further strengthen their capital buffers and it clearly signals BaFin’s aim to maintain the pace of systemwide RWA growth at a sound level. RWA growth, as a result of increased lending in combination with tighter RWA measurement rules, outpaced capital retention of Germany’s largest institutions during 2018 according to the supervisor, leading to declines in capital ratios.

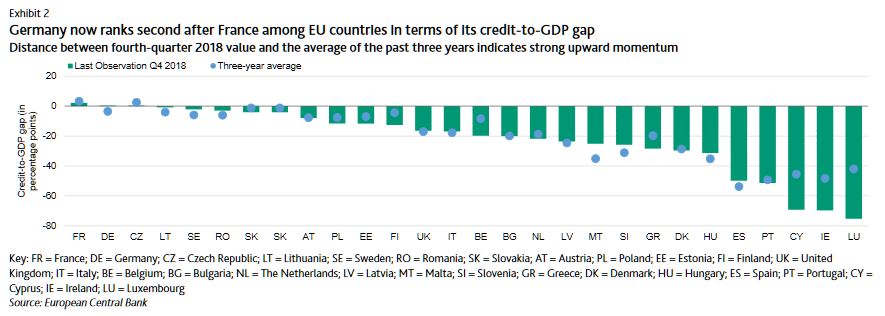
In setting the level of the CCyB, regulators are exercising their judgment while taking into account a range of factors including any deviation of the credit-to-GDP ratio from its long-term trend, asset price levels, business lending conditions, and any increase in the stock of nonperforming loans. While below the formulaic +2% threshold that would flag a potential need for raising the CCyB, exhibit 2 shows the German credit-to-GDP gap has been closing to a large extent in recent quarters.

The German announcement echoes a recent recommendation by the International Monetary Fund, which had laid out a similar reasoning in the preliminary view of its annual Article IV mission which assesses the economic and financial development in the Germany. Regarding asset and profitability risks observed by the financial stability committee, we share the view that the German banking system’s current profitability is vulnerable once loan-loss provisioning needs normalise upwards, since the system’s preprovision income levels have further lost ground against international peers

While the sector’s continued prudence in new residential mortgage origination benefits banks, the financing of the banking sector’s long-term fixed-rate assets through current-account deposits results in asset-liability mismatch risks that we expect will at least in part become visible once interest rates rise and if they do so at a faster pace than the banks expected.

Moody’s On APRA Moves

Via Moody’s. On 21 May, the Australian Prudential Regulation Authority (APRA) announced a proposal to remove its requirement that banks use an interest rate floor of at least 7% in their assessment of mortgage serviceability. The proposal will help support credit growth and could stem falling house prices. The announcement also has the potential to increase household leverage. However, banks have progressively tightened mortgage underwriting practices, which will mitigate the risk of a resurgence in excessive credit growth and another house price boom.

Since December 2014, APRA has required banks to assess loan serviceability using the higher of either an interest rate floor of at least 7% or a 2% cent buffer over the loan’s interest rate. APRA also recommended that banks should operate above these minimum requirements, which resulted in most banks using a 7.25% floor and 2.25% buffer. Under APRA’s proposal, banks will be allowed to set their own interest rate floor, but will need to incorporate a buffer of at least 2.5%.

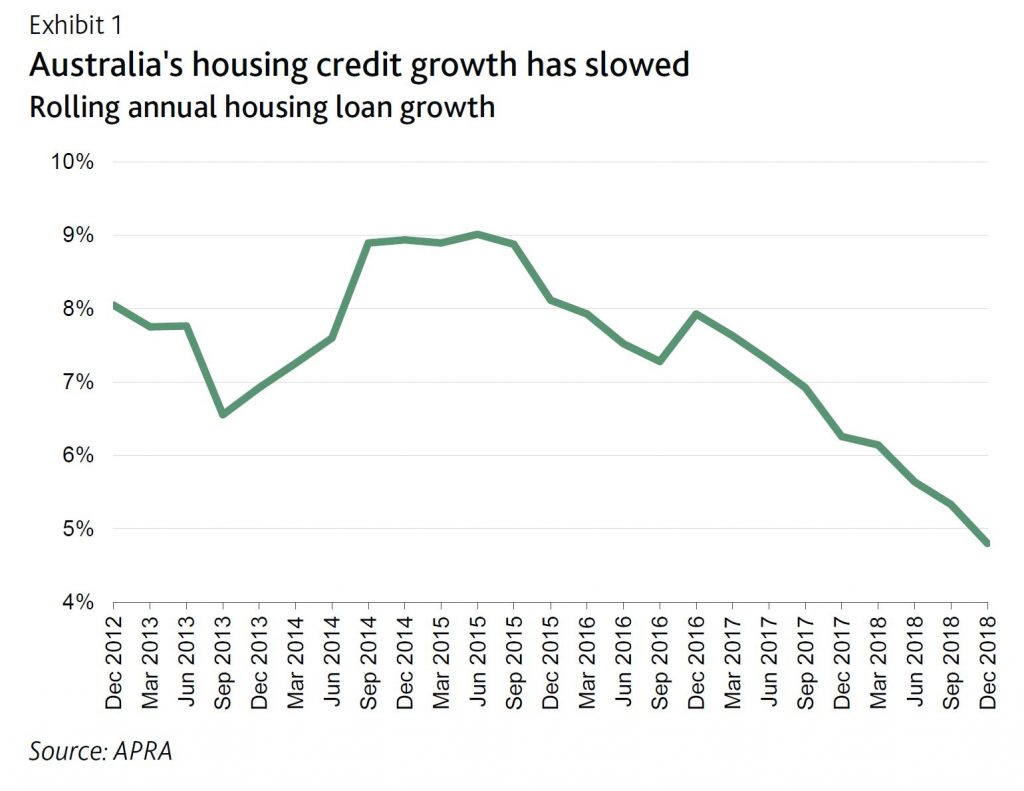
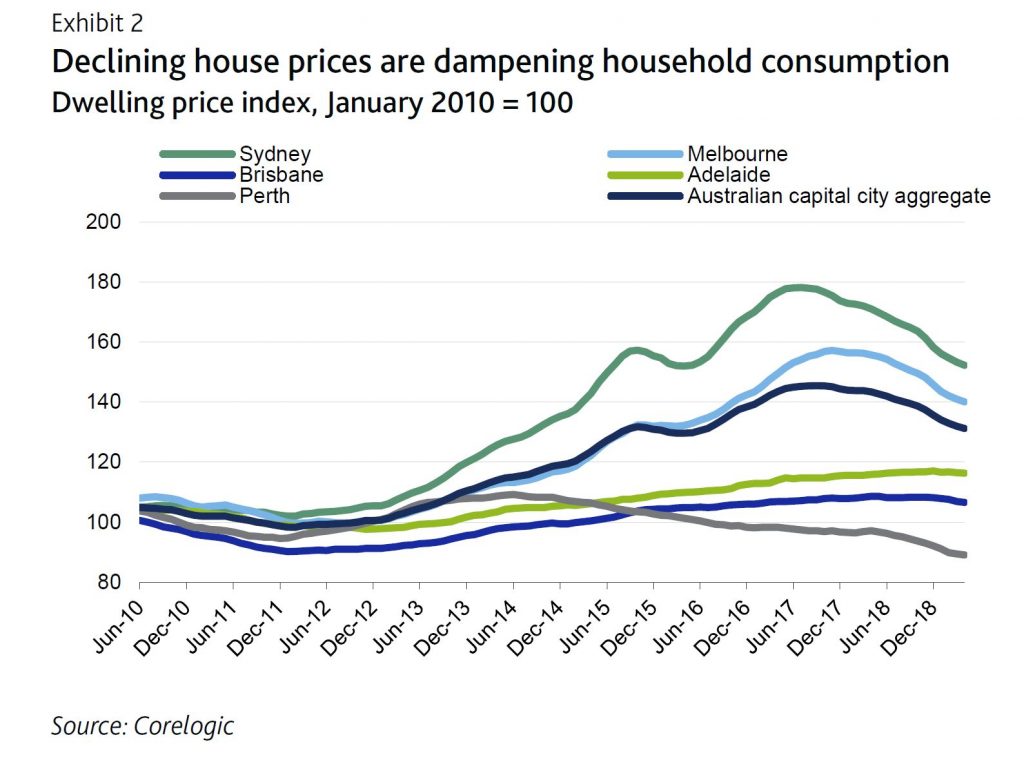
The proposal is likely to increase borrowing capacity, with some banks reporting that the interest rate floor has been a key contributor to the decline in borrowing capacity in recent years1. Improving access to credit will support credit growth for the banks, which has declined significantly from its peak in 2014 …

… and, in turn, stem the fall in house prices.

Falling house prices are dampening household consumption and contributing to a weaker growth outlook for Australia.

APRA said that a review of the interest rate floor was necessary because interest rates have declined since 2014 and are likely to remain at historically low levels for some time, which means that the gap between the 7% floor and actual rates paid on home loans may become unnecessarily wide. Furthermore, since the introduction of a single rate floor, banks have introduced differentiated pricing for mortgage products. This has resulted in the highest interest-rate buffer being applied on lower-priced and less-risky owner-occupier principle and interest loans, while the smallest buffer was being applied to investors with interest-only loans. Interest-only loans are generally more risky and attract a higher interest rate.

This proposal reflects the unwinding of APRA’s macroprucential policies that were progressively introduced from 2014, during a period of rapid growth in credit and housing prices. Such policies included interest-only lending restrictions that were removed in December 2018 and the removal of investor lending restrictions in April 2018. These restrictions had been in place since March 2017 and December 2014, respectively.

Despite declining house prices, high household leverage remains a key risk to Australian banks. And there is a risk that the lowering of the interest rate floor, in combination with the potential for the Reserve Bank of Australia to lower the cash rate later this year, could drive a resurgence in excessive credit growth and another house-price boom. However, banks have progressively tightened mortgage underwriting practices, which provides a strong mitigant to this risk. For example, banks have become increasingly focussed on the verification of a customer’s declared income and living expenses. This move has decreased borrower capacity and significantly
lengthened the mortgage application process. Banks have also developed limits on lending at high debt/income levels, where debt is greater than 6x a borrower’s income, and have introduced haircuts on uncertain and variable income, such as non-salary and rental income.

The US Stock Market And Wealth Inequality

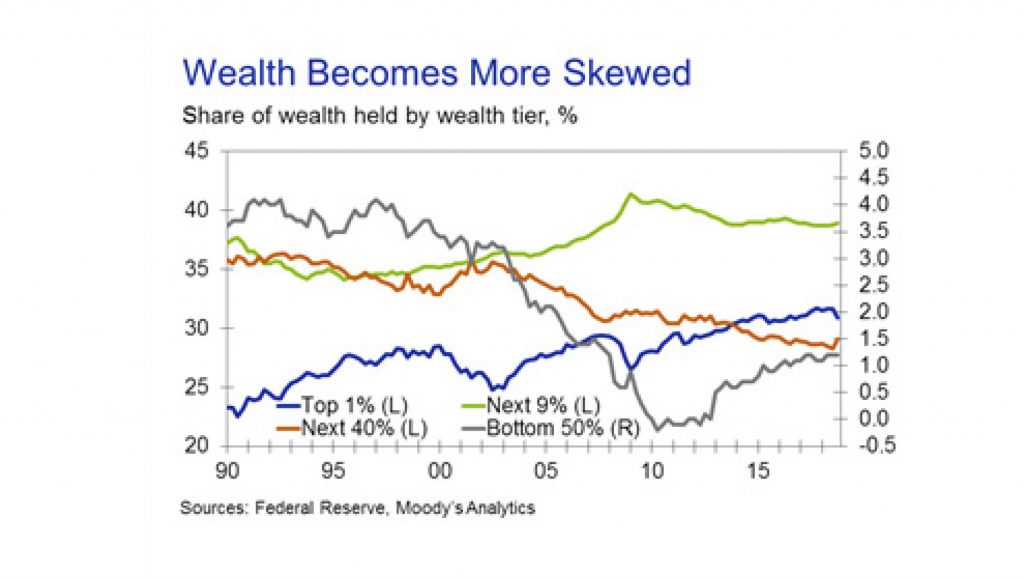
Moody’s says that inequality has been increasing in the U.S. for decades. This has been well-documented. However, new data from the Federal Reserve shed additional light on the distribution of wealth and how it has evolved over time. The Distributional Financial Accounts show levels and share of wealth across four segments of the wealth distribution: the top 1%, the next 9%, the rest of the top half, and the bottom half. This is done by sharing out household wealth as shown in the Financial Accounts using primarily the Survey of Consumer Finances, supplemented with other information in some instances.

The data clearly show the skewed distribution of wealth. The most recent data, for the fourth quarter of last year, show that the wealthiest 1% of households held 30.9% of total household wealth, only marginally below the record high of 31.7% a year earlier and well above the 1990 low of 22.5%. By contrast, the bottom half of the wealth distribution holds only 1.2% of all wealth, down from over 4% at points during the 1990s. However, it is better than the period immediately after the Great Recession, when this group was in debt in aggregate.

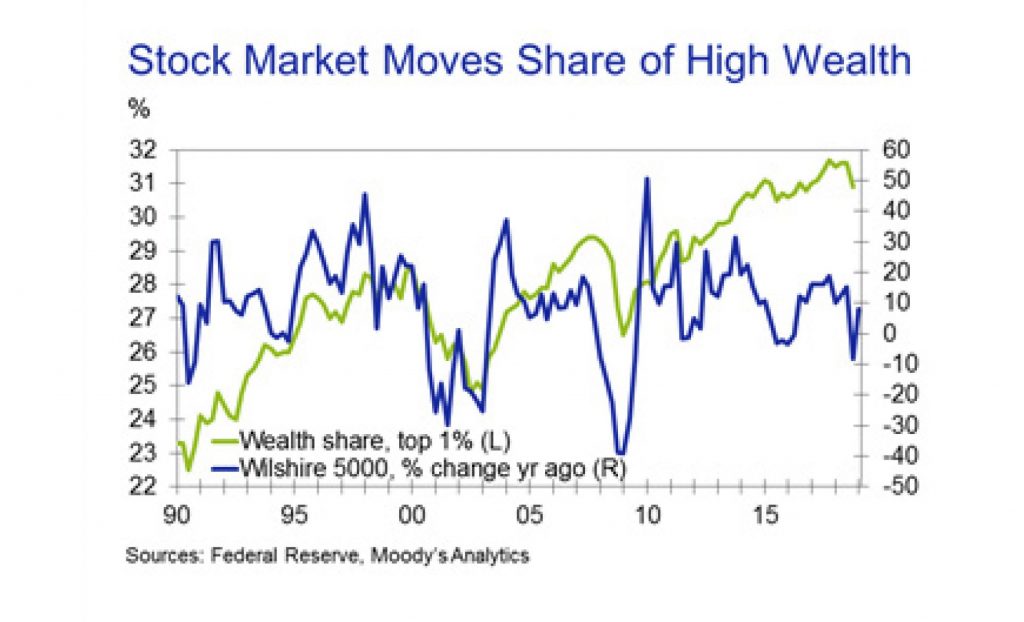
One clear feature of the data is that the distribution of wealth doesn’t change in a linear fashion. The share of wealth held by the richest 1% has declined at times, and in some cases sharply. For example, the share topped 28% at the start of 2000 before falling under 25% in late 2002. Similarly, the share fell from 29.4% in late 2007 to 26.5% in early 2009. Both declines corresponded with sharp declines in U.S. stock prices.

Ownership of stocks is heavily skewed toward the high end of the income and wealth distribution. Hence, the stock market is a strong driver of the share of wealth held by the richest households. The extent of the correlation may be surprising.

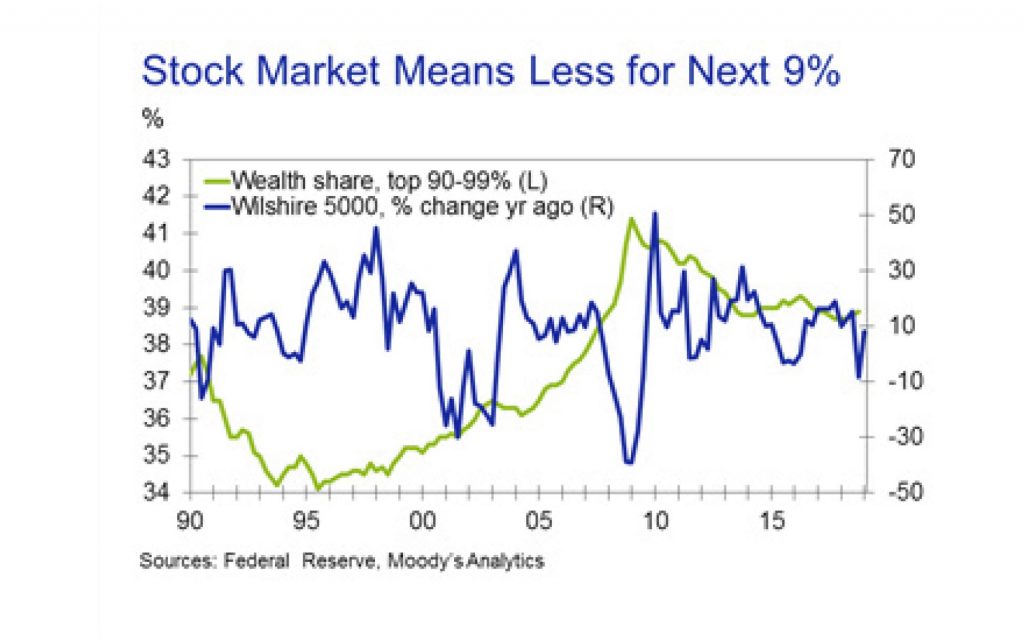
More interesting, the correlation largely breaks down for the next richest 9% of the population. Their share of wealth fell in the early 1990s, then rose steadily until the Great Recession before trending lower. While there is some correlation with movements in stock prices, they are clearly not the dominant driver they are for the richest households. This emphasizes how skewed wealth related to equity prices is.

To drive home the point, the correlation between the share of total wealth held by the richest 1% of households and the share of corporate equities and mutual fund shares held by the richest households is an astounding 94%. At present, equities and fund shares account for nearly 40% of wealth for this group of households. However, this share has grown dramatically over time. In the early 1990s it was under 20%, and over the entire history of the series it averages 30%.

This one component of wealth is the major driver of changes in share for the wealthiest households. Their share of wealth excluding stocks and mutual fund shares is about 4 percentage points lower on average, rises less, and is much more stable. This may understate the impact of equity prices on the wealth of these households, since equities are included in life insurance reserves and pension entitlements and correlate with equity in noncorporate businesses.

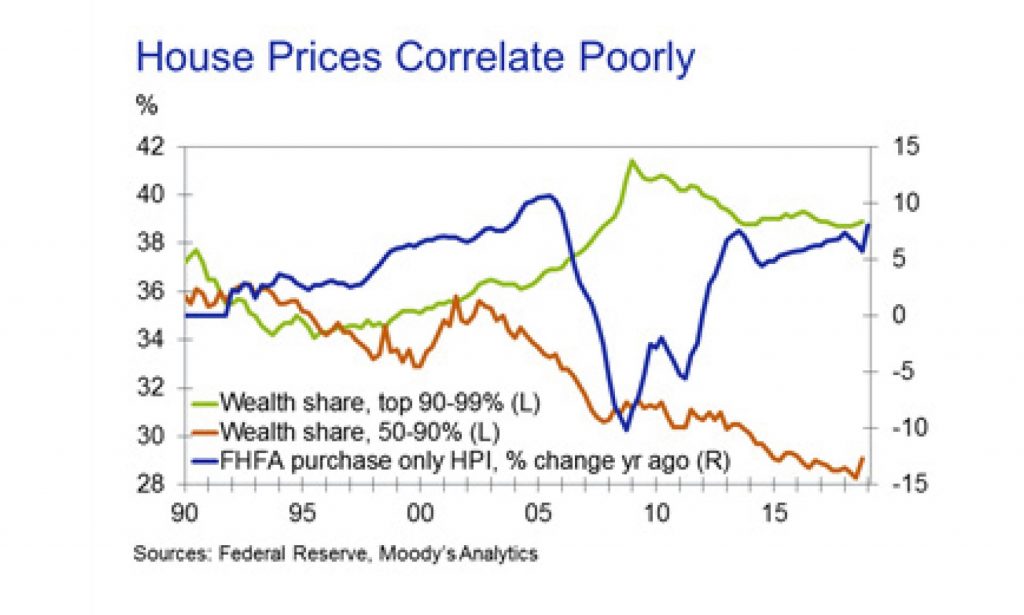
Other obvious candidates as drivers of changes in the wealth distribution fail to achieve anything like the apparent impact of equity markets. Despite making up a larger portion of household assets than corporate equities and mutual funds, housing wealth is less of a driver of wealth shares. Houses are more commonly owned, and, other than around the Great Recession, movements in house price growth tend to be gradual. Even for the lower-wealth households, where real estate would be their primary asset, there seems little linkage between house price growth and those households’ share of total wealth. Similarly, the link between unemployment and wealth shares is weak.

The differences in the makeup of household balance sheets at different positions in the wealth distribution are also shown in the distributional accounts data. This is one of the driving factors in the share movements. Therefore, it should not be surprising that corporate equities and mutual funds are most important for the richest households. They account for over a third of assets for the wealthiest 1% of households, compared with about a fifth for the next 9% of households, under 10% for the next 40% of households, and under 4% of assets for the bottom half of the wealth distribution. Equity in noncorporate business is similarly skewed heavily toward wealthy households.

By contrast, real estate assets are the most important piece of the balance sheet for the bottom half of the wealth distribution. For this group, they account for about half of all assets. The share declines sharply as wealth increases until it falls below 12% of assets for the richest 1% of households.

Pension entitlements are an important component of the balance sheet for households in the upper half of the wealth distribution, excluding the very rich. They make up almost a third of assets for households in the 50th-90th percentiles of the distribution and about 30% for households in the top 10% excluding the top 1%. However, they make up less than 10% of assets for the very wealthy and bottom half of the distribution. Most likely, lower-wealth households don’t have pensions while pensions for the very wealthy are swamped by other assets. Pension entitlements are important for future spending but may be less important for current spending if they are not well-understood.

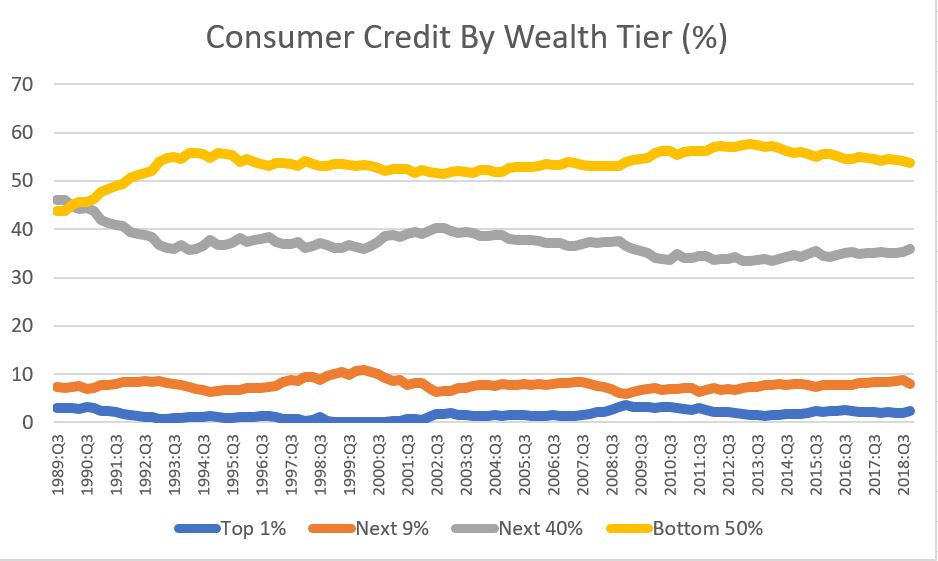
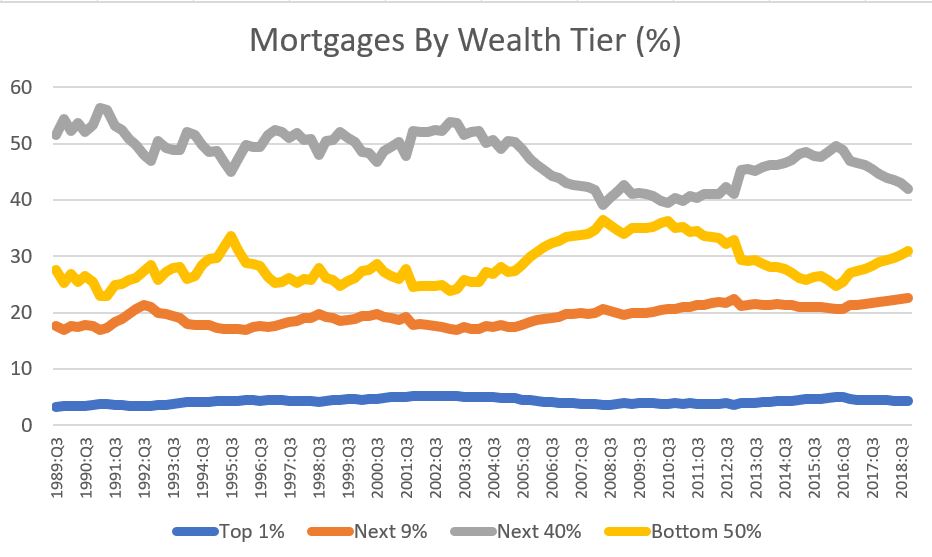
Liabilities follow what is probably an expected pattern. Mortgages account for a little over two-thirds of total household liabilities. However, they account for only a bit more than half of debt for households in the bottom half of the distribution. Consumer credit accounts for about 40% of their debt, the highest for any of the segments and well above the average of about a quarter.

The mortgage share increases until the top 1% of the distribution. They have nearly 15% of their debt in the other loans and advances category, dramatically more than other segments. This category captures debt related to their businesses and investments. Hence, just as real estate is a smaller portion of assets for the richest households, so too is mortgage debt a smaller share of liabilities.

The stock market has shown itself to be an important driver of the distributions of wealth. Current prospects are for the market to perform poorly by historical standards over the next year or so.

Economic growth is expected to slow and valuations remain high. Neither is favorable for the market.

The one silver lining in this is that weak stock market performance tends to associate with a moderation in wealth inequality.

Bank of Ireland Securitises Nonperforming Loans

According to Moody’s, on 10 April, Bank of Ireland Group plc, the holding company of Bank of Ireland, announced that it had entered a securitization agreement involving €370 million of legacy nonperforming buy-to-let mortgages. The transaction, which is scheduled to close on 18 April, is credit positive because it will reduce the bank’s problem loans ratio and modestly
improve asset risk, which remains a constraint on the bank’s standalone credit strength.

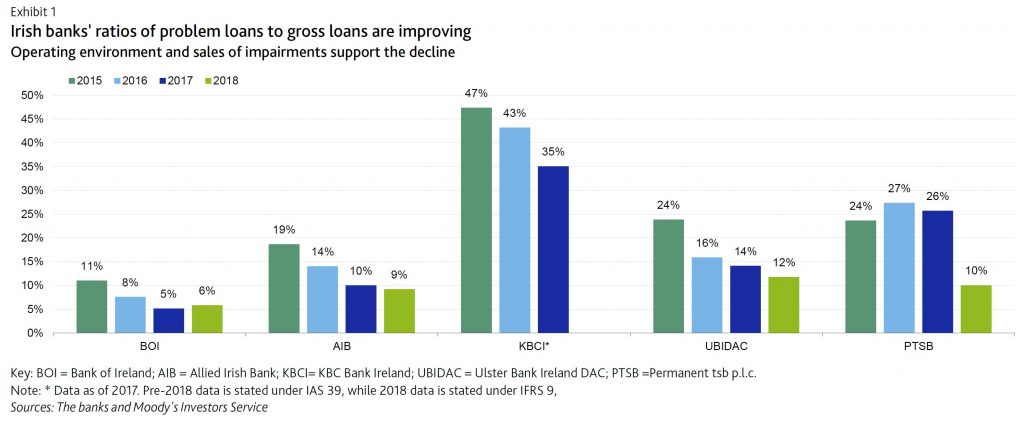
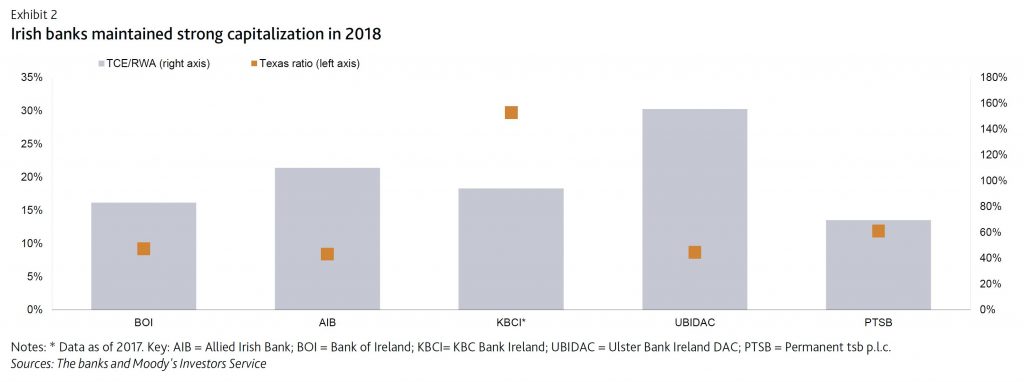
They estimate that following the transaction, the bank’s ratio of problem loans to gross loans will improve to 5.4% from 5.9% as of year end 2018, a step closer to European Central Bank guidance of 5%. The bank is on track to achieve the 5% nonperforming exposure target by end of this year. As of year-end 2018, the bank’s domestic peers reported problem loan ratios of 5.9%-11.9%, with BOI having the strongest ratio.

The transaction will boost BOI’s ratio of tangible common equity (TCE) to risk-weighted assets (RWAs) by 30 basis points from the 18.3% it reported for 2018 owing to the reduction in RWAs. The transaction will also improve the bank’s Texas ratio, the ratio of problem loans to loan-loss reserves and TCE, to 40% from 44% in 2018, which is one of the strongest among its peers.

Overall, these improvements strengthen BOI’s solvency and provide an improved base to support new lending. Moody’s expecst Ireland’s operating environment to remain supportive over the next 12-18 months, and that new lending will outweigh bad loan sales, leading to modest growth in the bank’s overall loan book this year.

The securitization of the impaired loans is an alternative to a direct sale, and allows BOI to maintain the customer relationship as the mortgage servicer. So far, in other impaired-loan securitizations, the originator has not stayed on as mortgage servicer. The BOI assets are notionally impaired performing loans which generate good predictable cashflows, and will typically not require active management, making them suitable for securitization.

In Ireland, banks must give borrowers at least 60 days’ notice before a change of servicer can can take place, and the transaction cannot close until this period has elapsed. During this period, the bank retains the assets on its balance sheet. However, since BOI is continuing to service the securitized loans, this notice period is not required, and NPL reduction is recognized the day the deal closes.

The sale of owner-occupied nonperforming mortgage loans has attracted close political scrutiny in Ireland amid claims that debt purchasers have taken a more aggressive approach to borrowers in arrears, including repossessing properties, than traditional banks.

However, Permanent tsb p.l.c. and Ulster Bank Ireland DAC last year each successfully completed sales of NPL portfolios backed by residential mortgages that helped reduce their legacy impairments. Allied Irish Banks,
p.l.c. recently announced an agreement to sell a pool of nonperforming mortgages that are primarily investment properties. Irish banks have been taking solid steps to reduce their impaired assets we expect this to continue, resulting in improving asset risk for the sector.